Webb’s NIRISS Returns to Full Operations

On Jan. 15, NASA’s James Webb Space Telescope’s Near Infrared Imager and Slitless Spectrograph (NIRISS) experienced a communications delay within the science instrument, causing its flight software to time out. Following a full investigation by NASA and Canadian Space Agency (CSA) teams, the cause was determined to likely be a galactic cosmic ray, a form of high-energy radiation from outside our solar system that can sometimes disrupt electrical systems. Encountering cosmic rays is a normal and expected part of operating any spacecraft. This cosmic ray event affected logic in the solid-state circuitry of NIRISS electronics known as the Field Programmable Gate Array. Webb engineers determined that rebooting the instrument would bring it back to full functionality.

After completing the reboot, NIRISS telemetry data demonstrated normal timing, and to fully confirm, the team scheduled a test observation. On Jan. 28, the Webb team sent commands to the instrument to perform the observation, and the results confirmed on Jan. 30 NIRISS is back to full scientific operations.

“NASA and CSA partnered to approach the problem as technically possible, using a detailed consideration of all areas of operation of the instrument. They analyzed all possible methods to safely recover the electronics. When performing the operation, reviews were held at each intermediate step. We are now happy to report that Webb’s NIRISS instrument is back online, and is performing optimally,” said Julie Van Campen, Webb Integrated Science Instrument Module (ISIM) systems engineer at NASA’s Goddard Space Flight Center in Greenbelt, Maryland.

Webb Spies Chariklo Ring System With High-Precision Technique

Editor’s Note: This post highlights data from Webb science in progress, which has not yet been through the peer-review process.

In an observational feat of high precision, scientists used a new technique with NASA’s James Webb Space Telescope to capture the shadows of starlight cast by the thin rings of Chariklo. Chariklo is an icy, small body, but the largest of the known Centaur population, located more than 2 billion miles away beyond the orbit of Saturn. Chariklo is only 160 miles (250 kilometers) or ~51 times smaller than Earth in diameter, and its rings orbit at a distance of about 250 miles (400 kilometers) from the center of the body.

We asked members of the science team observing Chariklo to tell us more about this unique system, the occultation technique, and what they learned from their Webb observations.

In 2013, Felipe Braga-Ribas and collaborators, using ground-based telescopes, discovered that Chariklo hosts a system of two thin rings. Such rings had been expected only around large planets such as Jupiter and Neptune. The astronomers had been watching a star as Chariklo passed in front of it, blocking the starlight as they had predicted. Astronomers call this phenomenon an occultation. To their surprise, the star blinked off and on again twice before disappearing behind Chariklo, and double-blinked again after the star reemerged. The blinking was caused by two thin rings – the first rings ever detected around a small solar system object.

Pablo Santos-Sanz, from Instituto de Astrofísica de Andalucía in Granada, Spain, has an approved “Target of Opportunity” program (program 1271) to attempt an occultation observation as part of Webb’s solar system Guaranteed Time Observations (GTO) led by Heidi Hammel from the Association of Universities for Research in Astronomy. By remarkable good luck, we discovered that Chariklo was on track for just such an occultation event in October 2022. This was the first stellar occultation attempted with Webb. A lot of hard work went into identifying and refining the predictions for this unusual event.

On Oct. 18, we used Webb’s Near-Infrared Camera (NIRCam) instrument to closely monitor the star Gaia DR3 6873519665992128512, and watch for the tell-tale dips in brightness indicating an occultation had taken place. The shadows produced by Chariklo’s rings were clearly detected, demonstrating a new way of using Webb to explore solar system objects. The star shadow due to Chariklo itself tracked just out of Webb’s view. This appulse (the technical name for a close pass with no occultation) was exactly as had been predicted after the last Webb course trajectory maneuver.

In the middle of a black background, a glowing white object seems to pulse with each image frame. The object, a star, is mostly round with tiny juts of light pulsing out from its edges. Another glowing white object, Chariklo, travels in toward the center from the 11 o’clock position. Chariklo is smaller and slightly less bright than the star. It crosses diagonally across the image, passing directly in front of its star and moving toward the 5 o’clock position.
This video shows observations taken by NASA’s James Webb Space Telescope of a star (fixed in the center of the video) as Chariklo passes in front of it. The video is composed of 63 individual observations with Webb’s Near-infrared Camera Instrument’s view at 1.5 microns wavelength (F150W) obtained over ~1 hour on Oct. 18. Careful analysis of the star’s brightness reveals that the rings of the Chariklo system were clearly detected. Credit: NASA, ESA, CSA, Nicolás Morales (IAA/CSIC)

The Webb occultation light curve, a graph of an object’s brightness over time, revealed that the observations were successful! The rings were captured exactly as predicted. The occultation light curves will yield interesting new science for Chariklo’s rings. Santos-Sanz explained: “As we delve deeper into the data, we will explore whether we cleanly resolve the two rings. From the shapes of rings’ occultation light curves, we also will explore the rings’ thickness, the sizes and colors of the ring particles, and more. We hope gain insight into why this small body even has rings at all, and perhaps detect new fainter rings.”

The rings are probably composed of small particles of water ice mixed with dark material, debris from an icy body that collided with Chariklo in the past. Chariklo is too small and too far away for even Webb to directly image the rings separated from the main body, so occultations are the only tool to characterize the rings by themselves.

Graphic titled “Centaur Chariklo Occultation Light Curve: NIRCam Filter F150W.” At the top is a diagram showing the change in relative position of a background star with respect to an icy body and its rings. The star appears to move behind the rings at two points along the path. Below the diagram is a graph showing the change in relative brightness of the star between 9:33 a.m. and 9:41 a.m. in Baltimore, Maryland, on October 18, 2022. The diagram and graph are aligned vertically to show the relationship between the relative position of the background star and the object and rings, and the measurements on the graph. The graphic shows that the brightness of the star is constant except when it appears to pass behind the rings, at which point it dips sharply. The graph shows two deep, narrow valleys when the star is partially blocked by the rings. For a full description, download the Text Description PDF.
An occultation light curve from Webb’s Near-infrared Camera (NIRCam) Instrument at 1.5 microns wavelength (F150W) shows the dips in brightness of the star (Gaia DR3 6873519665992128512) as Chariklo’s rings passed in front of it on Oct. 18. As seen in the illustration of the occultation event, the star did not pass behind Chariklo from Webb’s viewpoint, but it did pass behind its rings. Each dip actually corresponds to the shadows of two rings around Chariklo, which are ~4 miles (6-7 kilometers) and ~2 miles (2-4 kilometers) wide, and separated by a gap of 5.5 miles (9 kilometers). The two individual rings are not fully resolved in each dip in this light curve. Image credit: NASA, ESA, CSA, Leah Hustak (STScI). Science: Pablo Santos-Sanz (IAA/CSIC), Nicolás Morales (IAA/CSIC), Bruno Morgado (UFRJ, ON/MCTI, LIneA). Download the full-resolution version from the Space Telescope Science Institute.

Shortly after the occultation, Webb targeted Chariklo again, this time to collect observations of the sunlight reflected by Chariklo and its rings (GTO Program 1272). The spectrum of the system shows three absorption bands of water ice in the Chariklo system. Noemí Pinilla-Alonso, who led Webb’s spectroscopic observations of Chariklo, explained: “Spectra from ground-based telescopes had hinted at this ice (Duffard et al. 2014), but the exquisite quality of the Webb spectrum revealed the clear signature of crystalline ice for the first time.” Dean Hines, the principal investigator of this second GTO program, added: “Because high-energy particles transform ice from crystalline into amorphous states, detection of crystalline ice indicates that the Chariklo system experiences continuous micro-collisions that either expose pristine material or trigger crystallization processes.”

Graphic titled “Centaur Chariklo: Surface Composition; NIRSpec PRISM.” The graphic shows a reflectance spectrum in the form of a graph of the Brightness of Light (relative reflectance) on the vertical y-axis versus Wavelength of Light in microns on the horizontal x-axis.
Webb captured a spectrum with its Near-infrared Spectrograph (NIRSpec) of the Chariklo system on Oct. 31, shortly after the occultation. This spectrum shows clear evidence for crystalline water ice, which was only hinted at by past ground-based observations. Image credit: NASA, ESA, CSA, Leah Hustak (STScI). Science: Noemí Pinilla-Alonso (FSI/UCF), Ian Wong (STScI), Javier Licandro (IAC). Download the full-resolution version from the Space Telescope Science Institute.

Most of the reflected light in the spectrum is from Chariklo itself: Models suggest the observed ring area as seen from Webb during these observations is likely one-fifth the area of the body itself. Webb’s high sensitivity, in combination with detailed models, may permit us to tease out the signature of the ring material distinct from that of Chariklo. Pinilla-Alonso commented that “by observing Chariklo with Webb over several years as the viewing angle of the rings changes, we may be able to isolate the contribution from the rings themselves.”

Our successful Webb occultation light curve and spectroscopic observations of Chariklo open the door to a new means of characterizing small objects in the distant solar system in the coming years. With Webb’s high sensitivity and infrared capability, scientists can use the unique science return offered by occultations, and enhance these measurements with near-contemporaneous spectra. Such tools will be tremendous assets to the scientists studying distant small bodies in our solar system.

About the authors:

        • Heidi B. Hammel is a Webb interdisciplinary scientist leading Webb’s Cycle 1 Guaranteed Time Observations (GTO) of the solar system, including Program 1271 as highlighted here. She is the vice president for science at the Association of Universities for Research in Astronomy (AURA) in Washington, D.C.
        • Dean Hines is an observatory scientist at the Space Telescope Science Institute (STScI) in Baltimore, Maryland and part of Webb’s Mid-infrared Instrument Team. He is the principal investigator for Webb’s Guaranteed Time Observations Program 1272 “Kuiper Belt Science with JWST.”
        • Noemí Pinilla-Alonso is an associate scientist in planetary science at the Florida Space Institute at the University of Central Florida and deputy principal scientist for the Arecibo Observatory. She is leading the science analysis of the Chariklo system’s spectrum obtained by Webb’s Near-infrared Spectrograph.
        • Pablo Santos-Sanz is a planetary scientist at the Instituto de Astrofísica de Andalucía (CSIC) and director of the Sierra Nevada Observatory in Granada, Spain. He is the principal investigator for Webb’s Guaranteed Time Observations Program 1271 “ToO TNOs: Unveiling the Kuiper belt by stellar occultations.”

Near Infrared Imager and Slitless Spectrograph Operations Update

On Sunday, Jan. 15, the James Webb Space Telescope’s Near Infrared Imager and Slitless Spectrograph (NIRISS) experienced a communications delay within the instrument, causing its flight software to time out. The instrument is currently unavailable for science observations while NASA and the Canadian Space Agency (CSA) work together to determine and correct the root cause of the delay. There is no indication of any danger to the hardware, and the observatory and other instruments are all in good health. The affected science observations will be rescheduled.

James Webb Space Telescope Operations Update

The James Webb Space Telescope resumed science operations Dec. 20, after Webb’s instruments intermittently went into safe mode beginning Dec. 7 due to a software fault triggered in the attitude control system, which controls the pointing of the observatory. During a safe mode, the observatory’s nonessential systems are automatically turned off, placing it in a protected state until the problem can be fixed. This event resulted in several pauses to science operations totaling a few days over that time period. Science proceeded otherwise during that time. The Webb team adjusted the commanding system, and science has now fully resumed.

The observatory and instruments are all in good health, and were not in any danger while Webb’s onboard fault management system worked as expected to keep the hardware safe. The team is working to reschedule the affected observations.

Webb Glimpses Field of Extragalactic PEARLS, Studded With Galactic Diamonds

NASA’s James Webb Space Telescope has captured one of the first medium-deep wide-field images of the cosmos, featuring a region of the sky known as the North Ecliptic Pole. The image, which accompanies a paper published in the Astronomical Journal, is from the Prime Extragalactic Areas for Reionization and Lensing Science (PEARLS) GTO program.

“Medium-deep” refers to the faintest objects that can be seen in this image, which are about 29th magnitude (1 billion times fainter than what can be seen with the unaided eye), while “wide-field” refers to the total area that will be covered by the program, about one-twelfth the area of the full moon. The image is comprised of eight different colors of near-infrared light captured by Webb’s Near-Infrared Camera (NIRCam), augmented with three colors of ultraviolet and visible light from the Hubble Space Telescope. This beautiful color image unveils in unprecedented detail and to exquisite depth a universe full of galaxies to the furthest reaches, many of which were previously unseen by Hubble or the largest ground-based telescopes, as well as an assortment of stars within our own Milky Way galaxy. The NIRCam observations will be combined with spectra obtained with Webb’s Near-Infrared Imager and Slitless Spectrograph (NIRISS), allowing the team to search for faint objects with spectral emission lines, which can be used to estimate their distances more accurately.

On a black background, a white border outlines an irregularly shaped, mostly rectangular area. Within the outline lie hundreds of galaxies of various shapes, colors, and sizes. Two white boxes on the left side of the field enclose groups of galaxies. From each box, a line extends out beyond the border of the galaxy field to an enlarged image of the galaxy group, revealing streams of stars and tidal tails. On the right side, a third box encloses a spiral galaxy. A line extends beyond the border of the galaxy field to an enlarged image of the spiral galaxy. A few stars are also scattered across the image. Some have Webb’s characteristic 8 diffraction spikes, while others have additional spikes due to a combination of image exposures.
A swath of sky measuring 2% of the area covered by the full moon was imaged with Webb’s Near-Infrared Camera (NIRCam) in eight filters and with Hubble’s Advanced Camera for Surveys (ACS) and Wide-Field Camera 3 (WFC3) in three filters that together span the 0.25 – 5-micron wavelength range. This image represents a portion of the full PEARLS field, which will be about four times larger. Thousands of galaxies over an enormous range in distance and time are seen in exquisite detail, many for the first time. Light from the most distant galaxies has traveled almost 13.5 billion years to reach us. Because this image is a combination of multiple exposures, some stars show additional diffraction spikes. This representative-color image was created using Hubble filters F275W (purple), F435W (blue), and F606W (blue); and Webb filters F090W (cyan), F115W (green), F150W (green), F200W (green), F277W (yellow), F356W (yellow), F410M (orange), and F444W (red). Image credit: NASA, ESA, CSA, A. Pagan (STScI) & R. Jansen (ASU). Science: R. Jansen, J. Summers, R. O’Brien, and R. Windhorst (Arizona State University); A. Robotham (ICRAR/UWA); A. Koekemoer (STScI); C. Willmer (UofA); and the PEARLS team. Download the full-resolution version from the Space Telescope Science Institute.

We asked members of the PEARLS team that created this image to share their thoughts and reactions while analyzing this field:

“For over two decades, I’ve worked with a large international team of scientists to prepare our Webb science program,” said Rogier Windhorst, Regents Professor at Arizona State University (ASU) and PEARLS principal investigator. “Webb’s images are truly phenomenal, really beyond my wildest dreams. They allow me to measure the number density of galaxies shining to very faint infrared limits and the total amount of light they produce.”

“I was blown away by the first PEARLS images,” agreed Rolf Jansen, Research Scientist at ASU and a PEARLS co-investigator. “Little did I know, when I selected this field near the North Ecliptic Pole, that it would yield such a treasure trove of distant galaxies, and that we would get direct clues about the processes by which galaxies assemble and grow. I can see streams, tails, shells, and halos of stars in their outskirts, the leftovers of their building blocks.”

“The Webb images far exceed what we expected from my simulations in the months prior to the first science observations,” said Jake Summers, a research assistant at ASU. “Looking at them, I was most surprised by the exquisite resolution. There are many objects that I never thought we would actually be able to see, including individual globular clusters around distant elliptical galaxies, knots of star formation within spiral galaxies, and thousands of faint galaxies in the background.”

“The diffuse light that I measured in front of and behind stars and galaxies has cosmological significance, encoding the history of the universe,” said Rosalia O’Brien, a graduate research assistant at ASU. “I feel very lucky to start my career right now. Webb’s data is like nothing we have ever seen, and I’m really excited about the opportunities and challenges it offers.”

“I spent many years designing the tools to find and accurately measure the brightnesses of all objects in the new Webb PEARLS images, and to separate foreground stars from distant galaxies,” says Seth Cohen, a research scientist at ASU and a PEARLS co-investigator. “The telescope’s performance, especially at the shortest near-infrared wavelengths, has exceeded all my expectations, and allowed for unplanned discoveries.”

“The stunning image quality of Webb is truly out of this world,” agreed Anton Koekemoer, research astronomer at STScI, who assembled the PEARLS images into very large mosaics. “To catch a glimpse of very rare galaxies at the dawn of cosmic time, we need deep imaging over a large area, which this PEARLS field provides.”

“I hope that this field will be monitored throughout the Webb mission, to reveal objects that move, vary in brightness, or briefly flare up,” said Rolf. Added Anton: “Such monitoring will enable the discovery of time-variable objects like distant exploding supernovae and bright accretion gas around black holes in active galaxies, which should be detectable to larger distances than ever before.”

“This unique field is designed to be observable with Webb 365 days per year, so its time-domain legacy, area covered, and depth reached can only get better with time,” concluded Rogier.

About the Authors

      • Rogier Windhorst is a Regents Professor in the School of Earth and Space Exploration (SESE) of the Arizona State University (ASU). He serves as one of six Webb Interdisciplinary Scientists worldwide, and is the principal investigator of the Prime Extragalactic Areas for Reionization and Lensing Science (PEARLS) program (program IDs 1176, 2738). The PEARLS team consists of nearly 100 scientists spread across 18 time zones world-wide.
      • Rolf Jansen is a research scientist at ASU/SESE and PEARLS co-investigator. He selected the Webb North Ecliptic Pole Time Domain Field and led its development as a new community field for time-domain science with Webb, including the design of the NIRCam observations. He also is principal investigator of the Hubble images used in this color composite.
      • Seth Cohen is a research scientist at ASU/SESE and a PEARLS co-investigator. He led software development and photometric calibration, and generated object catalogs for this field.
      • Jake Summers is a research assistant at ASU/SESE, responsible for processing, organizing, and distributing the PEARLS data to the team, including the generation of initial mosaics and color composites.
      • Rosalia O’Brien is a graduate research assistant at ASU/SESE, responsible for measuring diffuse light, and for reprocessing the Hubble images.
      • Anton Koekemoer is a research astronomer at STScI, responsible for the astrometric alignment and combination of individual NIRCam detector images into the final PEARLS mosaics.
      • Aaron Robotham is a professor at the University of Western Australia’s ICRAR, and was responsible for the detector-level post-processing of the NIRCam data.
      • Christopher Willmer is a research astronomer at the University of Arizona’s Steward Observatory. A member of the NIRCam team, he helped develop the Webb North Ecliptic Pole Time Domain Field, and constructed camera artifacts templates.

Related Links:
The science paper by R. Windhorst et al.

– Christine Pulliam, Office of Public Outreach, Space Telescope Science Institute

NASA’s Webb Reaches New Milestone in Quest for Distant Galaxies

Editor’s Note: This post highlights data from Webb science in progress, which has not yet been through the peer-review process.

An international team of astronomers has used data from NASA’s James Webb Space Telescope to report the discovery of the earliest galaxies confirmed to date. The light from these galaxies has taken more than 13.4 billion years to reach us, as these galaxies date back to less than 400 million years after the big bang, when the universe was only 2% of its current age.

Earlier data from Webb had provided candidates for such infant galaxies. Now, these targets have been confirmed by obtaining spectroscopic observations, revealing characteristic and distinctive patterns in the fingerprints of light coming from these incredibly faint galaxies.

“It was crucial to prove that these galaxies do, indeed, inhabit the early universe. It’s very possible for closer galaxies to masquerade as very distant galaxies,” said astronomer and co-author Emma Curtis-Lake from the University of Hertfordshire in the United Kingdom. “Seeing the spectrum revealed as we hoped, confirming these galaxies as being at the true edge of our view, some further away than Hubble could see! It is a tremendously exciting achievement for the mission.”

Infographic of the spectra of four distant galaxies, showing the shift of the location of a spectral feature called the Lyman break, and the relationship between shift and time since the light was emitted, with images for reference.
The Webb Advanced Deep Extragalactic Survey (JADES) focused on the area in and around the
Hubble Space Telescope’s Ultra Deep Field. Using Webb’s NIRCam instrument, scientists observed the field in nine different infrared wavelength ranges. From these images (shown at left), the team searched for faint galaxies that are visible in the infrared but whose spectra abruptly cut off at a critical wavelength known as the Lyman break. Webb’s NIRSpec instrument then yielded a precise measurement of each galaxy’s redshift (shown at right). Four of the galaxies studied are particularly special, as they were revealed to be at an unprecedentedly early epoch. These galaxies date back to less than 400 million years after the big bang, when the universe was only 2% of its current age.
In the background image blue represents light at 1.15 microns (115W), green is 2.0 microns (200W), and red is 4.44 microns (444W). In the cutout images blue is a combination of 0.9 and 1.15 microns (090W+115W), green is 1.5 and 2.0 microns (150W+200W), and red is 2.0, 2.77, and 4.44 microns (200W+277W+444W).
Image Credit: NASA, ESA, CSA, and STScI, M. Zamani (ESA/Webb), L. Hustak (STScI). Science: B. Robertson (UCSC), S. Tacchella (Cambridge), E. Curtis-Lake (Hertfordshire), S. Carniani (Scuola Normale Superiore), and the JADES Collaboration
Download the full-resolution version from the Space Telescope Science Institute.

The observations resulted from a collaboration of scientists who led the development of two of the instruments on board Webb, the Near-Infrared Camera (NIRCam) and the Near-Infrared Spectrograph (NIRSpec). The investigation of the faintest and earliest galaxies was the leading motivation behind the concepts for these instruments. In 2015 the instrument teams joined together to propose the JWST Advanced Deep Extragalactic Survey (JADES), an ambitious program that has been allocated just over one month of the telescope’s time spread over two years, and is designed to provide a view of the early universe unprecedented in both depth and detail. JADES is an international collaboration of more than eighty astronomers from ten countries. “These results are the culmination of why the NIRCam and NIRSpec teams joined together to execute this observing program,” shared co-author Marcia Rieke, NIRCam principal investigator, of the University of Arizona in Tucson.

The first round of JADES observations focused on the area in and around the Hubble Space Telescope’s Ultra Deep Field. For over 20 years, this small patch of sky has been the target of nearly all large telescopes, building an exceptionally sensitive data set spanning the full electromagnetic spectrum. Now Webb is adding its unique view, providing the faintest and sharpest images yet obtained.

The JADES program began with NIRCam, using over 10 days of mission time to observe the field in nine different infrared colors, and producing exquisite images of the sky. The region is 15 times larger than the deepest infrared images produced by the Hubble Space Telescope, yet is even deeper and sharper at these wavelengths. The image is only the size a human appears when viewed from a mile away. However, it teems with nearly 100,000 galaxies, each caught at some moment in their history, billions of years in the past.

“For the first time, we have discovered galaxies only 350 million years after the big bang, and we can be absolutely confident of their fantastic distances,” shared co-author Brant Robertson from the University of California Santa Cruz, a member of the NIRCam science team. “To find these early galaxies in such stunningly beautiful images is a special experience.”

From these images, the galaxies in the early universe can be distinguished by a tell-tale aspect of their multi-wavelength colors. Light is stretched in wavelength as the universe expands, and the light from these youngest galaxies has been stretched by a factor of up to 14. Astronomers search for faint galaxies that are visible in the infrared but whose light abruptly cuts off at a critical wavelength. The location of the cutoff within each galaxy’s spectrum is shifted by the universe’s expansion. The JADES team scoured the Webb images looking for these distinctive candidates.

They then used the NIRSpec instrument, for a single observation period spanning three days totaling 28 hours of data collection. The team collected the light from 250 faint galaxies, allowing astronomers to study the patterns imprinted on the spectrum by the atoms in each galaxy. This yielded a precise measurement of each galaxy’s redshift and revealed the properties of the gas and stars in these galaxies.

“These are by far the faintest infrared spectra ever taken,” said astronomer and co-author Stefano Carniani from Scuola Normale Superiore in Italy. “They reveal what we hoped to see: a precise measurement of the cutoff wavelength of light due to the scattering of intergalactic hydrogen.”

Four of the galaxies studied are particularly special, as they were revealed to be at an unprecedentedly early epoch. The results provided spectroscopic confirmation that these four galaxies lie at redshifts above 10, including two at redshift 13. This corresponds to a time when the universe was approximately 330 million years old, setting a new frontier in the search for far-flung galaxies. These galaxies are extremely faint because of their great distance from us. Astronomers can now explore their properties, thanks to Webb’s exquisite sensitivity.

Astronomer and co-author Sandro Tacchella from the University of Cambridge in the United Kingdom explained, “It is hard to understand galaxies without understanding the initial periods of their development. Much as with humans, so much of what happens later depends on the impact of these early generations of stars. So many questions about galaxies have been waiting for the transformative opportunity of Webb, and we’re thrilled to be able to play a part in revealing this story.”

On a black background, two white, rectangular outlines are connected at one corner. Within the two outlines are hundreds of small galaxies of all colors.
This image taken by the James Webb Space Telescope highlights the region of study by the Webb Advanced Deep Extragalactic Survey (JADES). This area is in and around the Hubble Space Telescope’s Ultra Deep Field. Scientists used Webb’s NIRCam instrument to observe the field in nine different infrared wavelength ranges. From these images, the team searched for faint galaxies that are visible in the infrared but whose spectra abruptly cut off at a critical wavelength. They conducted additional observations (not shown here) with Webb’s NIRSpec instrument to measure each galaxy’s redshift and reveal the properties of the gas and stars in these galaxies.
In this image blue represents light at 1.15 microns (115W), green is 2.0 microns (200W), and red is 4.44 microns (444W).
Image Credit: NASA, ESA, CSA, and M. Zamani (ESA/Webb). Science: B. Robertson (UCSC), S. Tacchella (Cambridge), E. Curtis-Lake (Hertfordshire), S. Carniani (Scuola Normale Superiore), and the JADES Collaboration.
Download the full-resolution version from the Space Telescope Science Institute.

JADES will continue in 2023 with a detailed study of another field, this one centered on the iconic Hubble Deep Field, and then return to the Ultra Deep Field for another round of deep imaging and spectroscopy. Many more candidates in the field await spectroscopic investigation, with hundreds of hours of additional time already approved.

The James Webb Space Telescope is the world’s premier space science observatory. Webb will solve mysteries in our solar system, look beyond to distant worlds around other stars, and probe the mysterious structures and origins of our universe and our place in it. Webb is an international program led by NASA with its partners, ESA (European Space Agency) and CSA (Canadian Space Agency).

Release on ESA website

News Media Contacts

Alise Fisher
Headquarters, Washington
202-358-2546
alise.m.fisher@nasa.gov

Laura Betz
Goddard Space Flight Center, Greenbelt, Md.
301-286-9030
laura.e.betz@nasa.gov


Webb, Keck Telescopes Team Up to Track Clouds on Saturn’s Moon Titan

Editor’s Note: This post highlights data from Webb science in progress, which has not yet been through the peer-review process.

On the morning of Saturday, Nov. 5, an international team of planetary scientists woke up with great delight to the first Webb images of Saturn’s largest moon, Titan. Here, Principal Investigator Conor Nixon and others on the Guaranteed Time Observation (GTO) program 1251 team using Webb to investigate Titan’s atmosphere and climate describe their initial reactions to seeing the data.

Titan is the only moon in the solar system with a dense atmosphere, and it is also the only planetary body other than Earth that currently has rivers, lakes, and seas. Unlike Earth, however, the liquid on Titan’s surface is composed of hydrocarbons including methane and ethane, not water. Its atmosphere is filled with thick haze that obscures visible light reflecting off the surface.

We had waited for years to use Webb’s infrared vision to study Titan’s atmosphere, including its fascinating weather patterns and gaseous composition, and also see through the haze to study albedo features (bright and dark patches) on the surface. Titan’s atmosphere is incredibly interesting, not only due to its methane clouds and storms, but also because of what it can tell us about Titan’s past and future – including whether it always had an atmosphere. We were absolutely delighted with the initial results.

Team member Sebastien Rodriguez from the Universite Paris Cité was the first to see the new images, and alerted the rest of us via email: What a wake-up this morning (Paris time)! Lots of alerts in my mailbox! I went directly to my computer and started at once to download the data. At first glance, it is simply extraordinary! I think we’re seeing a cloud!” Webb Solar System GTO Project Lead Heidi Hammel, from the Association of Universities for Research in Astronomy (AURA), had a similar reaction: “Fantastic! Love seeing the cloud and the obvious albedo markings. So looking forward to the spectra! Congrats, all!!! Thank you!”

Thus began a day of frantic activity. By comparing different images captured by Webb’s Near-Infrared Camera (NIRCam), we soon confirmed that a bright spot visible in Titan’s northern hemisphere was in fact a large cloud. Not long after, we noticed a second cloud. Detecting clouds is exciting because it validates long-held predictions from computer models about Titan’s climate, that clouds would form readily in the mid-northern hemisphere during its late summertime when the surface is warmed by the Sun.

Side-by-side images of Saturn’s moon Titan, captured by Webb’s Near-Infrared Camera on November 4, 2022. Left image labeled “lower atmosphere and clouds” is various shades of red, from nearly black to nearly white. Three bright spots are labeled. Spot along the edge at 11 o’clock is labeled “Cloud A.” A larger, brighter spot at 1 o’clock is labeled “Cloud B.” A nearly white, crescent-shaped spot along the bottom from about 5 to 7 o’clock is labeled “Atmospheric Haze.” Right image labeled “atmosphere and surface,” is shades of white, blue, and brown. Clouds A and B are bright spots in the same locations as in the left-hand image. Cloud A, at 11 o’clock, is quite small and subtle. Cloud B, at 1 o’clock, is brighter and appears larger than in the left-hand image. Three surface features are labeled: Dark patch near Cloud A labeled “Kraken Mare.” Dark patch in middle lower right quadrant labeled “Belet.” Bright patch just inside the edge at about 4 o’clock labeled “Adiri.”
Images of Saturn’s moon Titan, captured by the James Webb Space Telescope’s NIRCam instrument Nov. 4, 2022. Left: Image using F212N, a 2.12-micron filter sensitive to Titan’s lower atmosphere. The bright spots are prominent clouds in the northern hemisphere. Right: Color composite image using a combination of NIRCam filters: Blue=F140M (1.40 microns), Green=F150W (1.50 microns), Red=F200W (1.99 microns), Brightness=F210M (2.09 microns). Several prominent surface features are labeled: Kraken Mare is thought to be a methane sea; Belet is composed of dark-colored sand dunes; Adiri is a bright albedo feature. Download the full-resolution version from the Space Telescope Science Institute . Image credit: NASA, ESA, CSA, A. Pagan (STScI). Science: Webb Titan GTO Team.

We then realized it was important to find out if the clouds were moving or changing shape, which might reveal information about the air flow in Titan’s atmosphere. So we quickly reached out to colleagues to request follow-up observations using the Keck Observatory in Hawai’i that evening. Our Webb Titan team lead Conor Nixon from NASA’s Goddard Space Flight Center wrote to Imke de Pater at University of California, Berkeley, and Katherine de Kleer at Caltech, who have extensive experience using Keck: “We just received our first images of Titan from Webb, taken last night. Very exciting! There appears to be a large cloud, we believe over the northern polar region near Kraken Mare. We were wondering about a quick response follow-up observation on Keck to see any evolution in the cloud?”

After negotiations with the Keck staff and observers who had already been scheduled to use the telescope that evening, Imke and Katherine quickly queued up a set of observations. The goal was to probe Titan from its stratosphere to surface, to try to catch the clouds we saw with Webb. The observations were a success! Imke de Pater commented: “We were concerned that the clouds would be gone when we looked at Titan two days later with Keck, but to our delight there were clouds at the same positions, looking like they had changed in shape.”

Side-by-side images of the atmosphere and surface of Saturn’s moon Titan, captured by Webb (left) and Keck (right). Both images are various shades of white, blue, and brown. Left: Webb NIRCam image captured on November 4, 2022. Three features are labeled: A bright spot along the edge at 11 o’clock is labeled “Cloud A.” A larger, brighter spot at 1 o’clock is labeled “Cloud B.” A dark patch in middle lower right quadrant is labeled “Belet.” Right: Keck NIRC-2 image captured on November 6, 2022. The same three features are labeled. They are in the same positions relative to each other, but appear to have moved or rotated slightly to the right. Cloud A appears somewhat larger than in the November 4 Webb image. Cloud B appears somewhat smaller. Belet, a dark feature, is now closer to the eastern edge of the visible hemisphere.
Evolution of clouds on Titan over 30 hours between Nov. 4 and Nov. 6, 2022, as seen by Webb NIRCam (left) and Keck NIRC-2 (right). Titan’s trailing hemisphere seen here is rotating from left (dawn) to right (evening) as seen from Earth and the Sun. Cloud A appears to be rotating into view while Cloud B appears to be either dissipating or moving behind Titan’s limb (around toward the hemisphere facing away from us). Clouds are not long-lasting on Titan or Earth, so those seen on Nov. 4 may not be the same as those seen on Nov. 6. The NIRCam image used the following filters: Blue=F140M (1.40 microns), Green=F150W (1.50 microns), Red=F200W (1.99 microns), Brightness=F210M (2.09 microns). The Keck NIRC-2 image used: Red=He1b (2.06 microns), Green=Kp (2.12 microns), Blue=H2 1-0 (2.13 microns). Download the full-resolution version from the Space Telescope Science Institute . Image credit: NASA, ESA, CSA, W. M. Keck Observatory, A. Pagan (STScI). Science: Webb Titan GTO Team.

After we got the Keck data, we turned to atmospheric modeling experts to help interpret it. One of those experts, Juan Lora at Yale University, remarked: “Exciting indeed! I’m glad we’re seeing this, since we’ve been predicting a good bit of cloud activity for this season! We can’t be sure the clouds on November 4th and 6th are the same clouds, but they are a confirmation of seasonal weather patterns.”

The team also collected spectra with Webb’s Near-Infrared Spectrograph (NIRSpec), which is giving us access to many wavelengths that are blocked to ground-based telescopes like Keck by Earth’s atmosphere. This data, which we are still analyzing, will enable us to really probe the composition of Titan’s lower atmosphere and surface in ways that even the Cassini spacecraft could not, and to learn more about what is causing the bright feature seen over the south pole.

We are expecting further Titan data from NIRCam and NIRSpec as well as our first data from Webb’s Mid-Infrared Instrument (MIRI) in May or June of 2023. The MIRI data will reveal an even greater part of Titan’s spectrum, including some wavelengths we have never seen before. This will give us information about the complex gases in Titan’s atmosphere, as well as crucial clues to deciphering why Titan is the only moon in the Solar System with a dense atmosphere.

Maël Es-Sayeh, a graduate student at the Universite Paris Cité, is particularly looking forward to these observations: “I will be using the data from Webb in my PhD research, so it’s very exciting to finally get the real data after years of simulations. I can’t wait to see what will come in part two next year!”

About the Authors

      • Conor Nixon, is a planetary scientist at the NASA Goddard Space Flight Center in Greenbelt, Maryland, and serves as Principal Investigator on the Webb Cycle 1 Guaranteed Time Observation program 1251.
      • Co-Investigator Heidi Hammel is a planetary scientist. She is Vice President for Science at AURA and leads the JWST Solar System Science Group.
      • Co-Investigator Sébastien Rodriguez is a planetary scientist at the Institut de Physique du Globe de Paris at the Universite Paris Cité, in France.
      • Imke de Pater is an Emeritus professor of astronomy at the University of California, Berkeley, and is lead of the Keck Titan Observing Team.
      • Katherine de Kleer is an Assistant Professor of Planetary Science and Astronomy at Caltech in Pasadena, California, and is a member of the Keck Titan Observing Team.
      • Juan Lora is an Assistant Professor of Earth & Planetary Sciences at Yale University in New Haven, Connecticut.
      • Maël Es-Sayeh is a graduate student in planetary sciences at Institut de Physique du Globe de Paris of the Universite Paris Cité, in France. 

– Margaret W. Carruthers, Office of Public Outreach, Space Telescope Science Institute

NASA Webb Image Coming This Week

NASA will share a new image or spectrum from the James Webb Space Telescope at least every other week on the mission’s blog. This week, check the blog on Thursday, Dec. 1 at 11 a.m. EST for new images highlighting one of Saturn’s moons.

In the meantime, learn more about what to expect as Webb observations make their way from raw data to published, peer-reviewed science.

News Media Contacts
Alise Fisher
Headquarters, Washington
202-358-2546
alise.m.fisher@nasa.gov

Laura Betz
Goddard Space Flight Center, Greenbelt, Md.
301-286-9030
laura.e.betz@nasa.gov

NASA Webb Micrometeoroid Mitigation Update

Micrometeoroid strikes are an unavoidable aspect of operating any spacecraft. NASA’s James Webb Space Telescope was engineered to withstand continual bombardment from these dust-sized particles moving at extreme velocities, to continue to generate groundbreaking science far into the future.

​​“We have experienced 14 measurable micrometeoroid hits on our primary mirror, and are averaging one to two per month, as anticipated. The resulting optical errors from all but one of these were well within what we had budgeted and expected when building the observatory,” said Mike Menzel, Webb lead mission systems engineer at NASA’s Goddard Space Flight Center in Greenbelt, Maryland. “One of these was higher than our expectations and prelaunch models; however, even after this event our current optical performance is still twice as good as our requirements.”

To ensure all parts of the observatory continue to perform at their best, NASA convened a working group of optics and micrometeoroid experts from NASA Goddard‘s Webb team, the telescope’s mirror manufacturer, the Space Telescope Science Institute, and the NASA Meteoroid Environment Office at NASA’s Marshall Space Flight Center in Huntsville, Alabama. After thorough analysis, the team concluded the higher-energy impact observed in May was a rare statistical event both in terms of energy, and in hitting a particularly sensitive location on Webb’s primary mirror. To minimize future impacts of this magnitude, the team has decided that future observations will be planned to face away from what is now known as the ‘micrometeoroid avoidance zone.’

“Micrometeoroids that strike the mirror head on (moving opposite the direction the telescope is moving) have twice the relative velocity and four times the kinetic energy, so avoiding this direction when feasible will help extend the exquisite optical performance for decades,” said Lee Feinberg, Webb optical telescope element manager at NASA Goddard. This does not mean that these areas of the sky cannot be observed, only that observations of those objects will be more safely made at a different time in the year when Webb is in a different location in its orbit. Observations that are time critical, such as solar system targets, will still be done in the micrometeoroid avoidance zone if required. This adjustment to how Webb observations are scheduled will have a long-term statistical benefit.

The team will implement the micrometeoroid avoidance zone starting with Webb’s second year of science, or “Cycle 2.” More information and guidance for Cycle 2 is available on JWST Observer News.

-Thaddeus Cesari, NASA’s Goddard Space Flight Center

News Media Contacts

Alise Fisher
Headquarters, Washington
202-358-2546
alise.m.fisher@nasa.gov

Laura Betz
Goddard Space Flight Center, Greenbelt, Md.
301-286-9030
laura.e.betz@nasa.gov

Beneath the Night Sky in a Galaxy (Not Too) Far Away

Editor’s Note: This post highlights data from Webb science in progress, which has not yet been through the peer-review process.

We spoke with Kristen McQuinn of Rutgers University, one of the lead scientists on Webb Early Release Science (ERS) program 1334, focused on resolved stellar populations. These are large groups of stars – including stars within the dwarf galaxy Wolf–Lundmark–Melotte (WLM) – that are close enough for Webb to differentiate between individual stars, but far enough for Webb to capture a large number of stars at once.

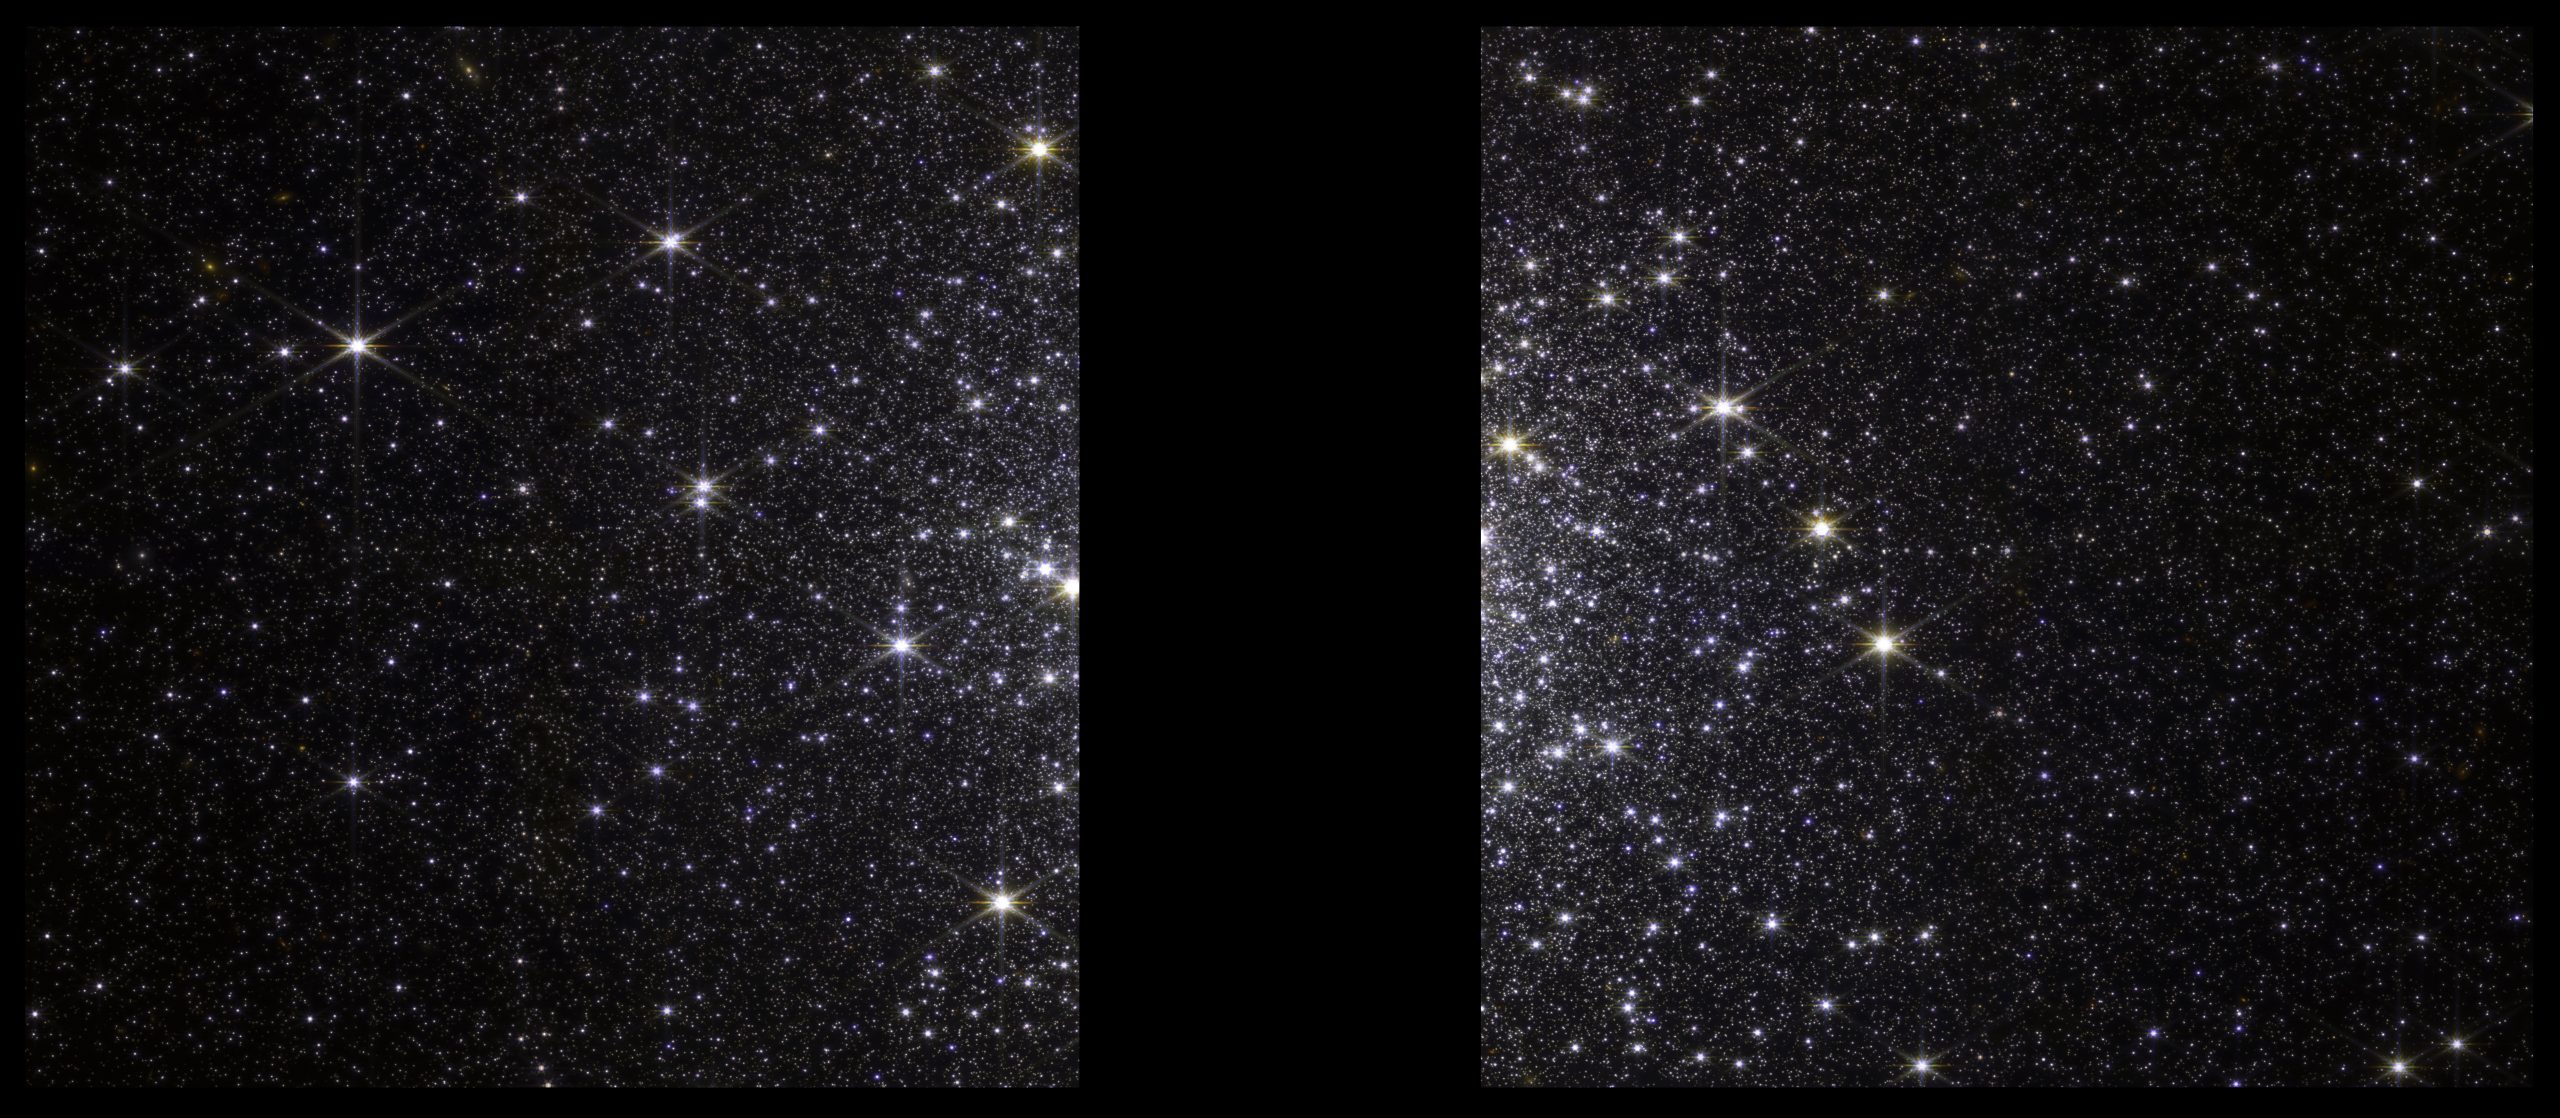
Labeled, side-by-side comparison of dwarf galaxy Wolf-Lundmark-Melotte (WLM) images, as seen by Spitzer’s IRAC on the left and Webb’s NIRCam on the right. Spitzer’s view resembles fuzzy white blotches against a black background, while Webb’s view appears much more focused and detailed. In Webb’s image, there are countless white stars dotting the scene, as well as yellow and orange background galaxies of various shapes. One prominent galaxy is a pale yellow spiral in the top left corner. Another defining feature is a large white star with long diffraction spikes, seen just to the right of the top center.
A portion of the dwarf galaxy Wolf–Lundmark–Melotte (WLM) captured by the Spitzer Space Telescope’s Infrared Array Camera (left) and the James Webb Space Telescope’s Near-Infrared Camera (right). The images demonstrate Webb’s remarkable ability to resolve faint stars outside the Milky Way. The Spitzer image shows 3.6-micron light in cyan and 4.5-micron in orange (IRAC1 and IRAC2). The Webb image includes 0.9-micron light shown in blue, 1.5-micron in cyan, 2.5-micron in yellow, and 4.3-micron in red (filters F090W, F150W, F250M, and F430M). Download the full-resolution version from the Space Telescope Science Institute. SCIENCE CREDIT: NASA, ESA, CSA, STScI, and Kristen McQuinn (Rutgers University). IMAGE PROCESSING: Alyssa Pagan (STScI).

So, tell us a bit about this galaxy, WLM. What’s interesting about it?

WLM is a dwarf galaxy in our galactic neighborhood. It’s fairly close to the Milky Way (only about 3 million light-years from Earth), but it’s also relatively isolated. We think WLM hasn’t interacted with other systems, which makes it really nice for testing our theories of galaxy formation and evolution. Many of the other nearby galaxies are intertwined and entangled with the Milky Way, which makes them harder to study.

Another interesting and important thing about WLM is that its gas is similar to the gas that made up galaxies in the early universe. It’s fairly unenriched, chemically speaking. (That is, it’s poor in elements heavier than hydrogen and helium.)

This is because the galaxy has lost many of these elements through something we call galactic winds. Although WLM has been forming stars recentlythroughout cosmic time, reallyand those stars have been synthesizing new elements, some of the material gets expelled from the galaxy when the massive stars explode. Supernovae can be powerful and energetic enough to push material out of small, low-mass galaxies like WLM.

This makes WLM super interesting in that you can use it to study how stars form and evolve in small galaxies like those in the ancient universe.

You arranged to show this image at a planetarium. How did you feel when you saw the image projected on the dome?

It was just inspiring. It really was incredible. I will never look at these images the same again. Seeing this on the dome, it was like looking up at our own night skyat the Milky Wayfrom a dark site. I could imagine that we were standing on a planet in the WLM galaxy and looking up at its night sky.

We can see a myriad of individual stars of different colors, sizes, temperatures, ages, and stages of evolution; interesting clouds of nebular gas within the galaxy; foreground stars with Webb’s diffraction spikes; and background galaxies with neat features like tidal tails. It’s really a gorgeous image.

And, of course, the view is far deeper and better than our eyes could possibly see. Even if you were looking out from a planet in the middle of this galaxy, and even if you could see infrared light, you would need bionic eyes to be able to see what Webb sees.

What are you trying to find out by studying WLM?

The main science focus is to reconstruct the star formation history of this galaxy. Low-mass stars can live for billions of years, which means that some of the stars that we see in WLM today formed in the early universe. By determining the properties of these low-mass stars (like their ages), we can gain insight into what was happening in the very distant past. It’s very complementary to what we learn about the early formation of galaxies by looking at high-redshift systems, where we see the galaxies as they existed when they first formed.

The Early Release Science programs were designed to highlight Webb’s capabilities and help astronomers prepare for future observations. How are you supporting other astronomers with this work?

In a few ways. We’re checking the calibration of the NIRCam instrument itself. We’re checking our stellar evolution models. And we’re developing software to measure star brightnesses.

We already studied this exact same field very carefully with Hubble. Now we’re looking at the near-infrared light with Webb, and we’re using WLM as a sort of standard for comparison (like you would use in a lab) to help us make sure we understand the Webb observations. We want to make sure we’re measuring the stars’ brightnesses really, really accurately and precisely. We also want to make sure that we understand our stellar evolution models in the near-infrared.

Our team is also charged with developing a public software tool to measure the brightness of all the resolved stars in the NIRCam images. This is a non-proprietary tool that everyone will be able to use. We are developing and testing the software, and optimizing the parameters used for measurements. This is a bedrock tool for astronomers around the world. If you want to do anything with resolved stars that are crowded together on the sky, you need a tool like this.

About the Author

Kristen McQuinn is an assistant professor in the Department of Physics and Astronomy at Rutgers University, and co-investigator on Director’s Discretionary Early Release Science program 1334.

Related Links