Happy 2,000,000,000,000th, ICESat-2! NASA’s Earth-observing laser in orbit passed a milestone on March 9 at 12:51 p.m. EDT — 16:51:00.268 UTC, to be precise — as its laser instrument fired for the 2 trillionth time and measured clouds off the coast of East Antarctica.

ICESat-2’s instrument, the Advanced Topographic Laser Altimeter System (ATLAS), uses rapid pulses of green laser light and an incredibly precise clock system to track the height of Earth’s surface from space. Its first measurements from orbit profiled the Antarctic ice sheet in September 2018.
Since then, it’s fired 10,000 times a second to provide height profiles of the planet’s changing glaciers, sea ice, water reservoirs, forests and more — even detecting the coastal seafloor in places.
The laser is in excellent shape, even after six years and a couple trillion shots, said Anthony Martino, ATLAS instrument scientist at NASA’s Goddard Space Flight Center in Greenbelt, Maryland. At this rate, it could last well into the 2030s, he said — and there’s a second laser aboard that the mission could switch to, if needed.

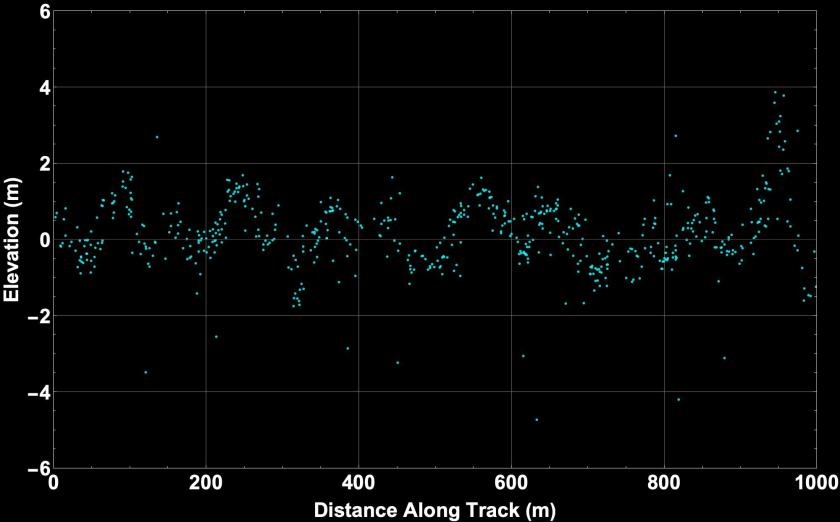
While the primary mission of ICESat-2 is to measure ice, ATLAS operates around the clock and the 2 trillionth shot captured a common sight: clouds. About 79 seconds earlier, it passed over the clear skies of the Antarctic ice sheet as it flows down Vanderford Glacier and into the Southern Ocean.
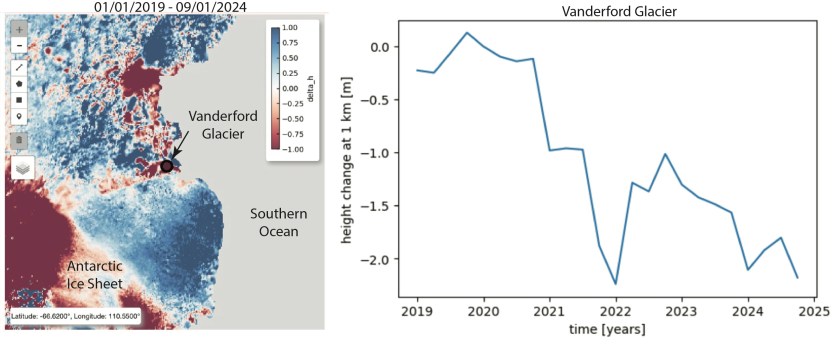
Vanderford Glacier is East Antarctica’s fastest retreating glacier, as warmer ocean water seeps in to melt it from below, according to a recent study. And it’s a prime example of what scientists can use ICESat-2 data for, said Denis Felikson, ICESat-2 deputy project scientist at NASA Goddard.

Tracking a specific site on Vanderford throughout ICESat-2’s record, for example, shows how the ice surface dropped about six feet between 2019 and 2022, rose a few feet the next year, but then dropped back down in 2024. Zoom out, and researchers can track elevation across the glacier and its surroundings.
“With data from 2 trillion laser shots, and more to come, we have this consistent global record of all of Earth’s ice from space, at glacier scales but also in really fine detail,” Felikson said. “Both of these scales are critical for us to understand how Earth is changing over time.”

By Kate Ramsayer, NASA’s Goddard Space Flight Center
