Today’s blog is from Dr. Henry Throop, a planetary scientist with the Planetary Science Institute in Mumbai, India. He received his PhD in 2000 from the University of Colorado, Boulder. His areas of research include the outer solar system, the rings of Jupiter and Saturn, and planet formation in the Orion Nebula. He has been working with the New Horizons mission since 2002.
New Horizons traveled for 9.5 years to get to Pluto. But most of the spacecraft’s key Pluto system observations were taken within a single 24-hour period. How did we make sure that we get the best observations possible — to do the best science in those 24 hours? Well, it took a lot of planning.
When astronomers are using telescopes on the ground, observing is sometimes unplanned, and conditions vary as the night moves along. Perhaps the images from an object are particularly interesting, so we take more. Or the weather is changing, or an instrument is not working right, and we move to a new target or new instrument, improvising along the way.
But for the Pluto encounter, there was no possibility of this. With only a single day to gather the once-in-a-lifetime datasets about this new world and its moons, we wanted to squeeze in all of the observations we could. Single images, mosaics, wide scans, spectra, radio occultations and more—all had to balance out to maximize the overall science. The observations were packed so densely that we would have no time to effectively improvise in real-time. And, more importantly, with a 9-hour round-trip light time between New Horizons and the ground, it would simply not be possible to take some images, send them down, and then decide to take more observations from the most interesting area.
Instead, the entire encounter had to be sequenced in advance. Putting the observation plan together took several years of meticulous planning, and the final observing program was to be uploaded to the spacecraft about 10 days before encounter. About a week before flyby, that observing plan started executing—firing off a sequence of turns, snaps and scans that would execute the science program.
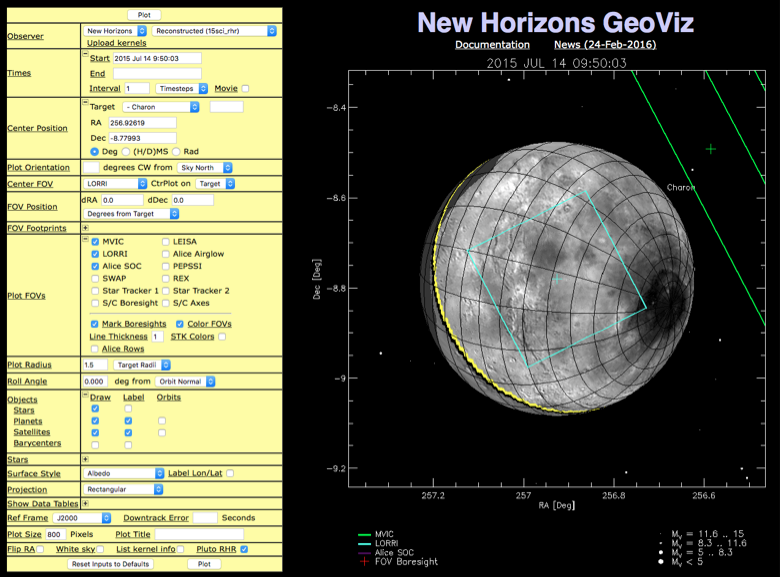
So how does the science team choose where to point? You might say, “Just look at everything!” But during the central 24 hours, our view of Pluto would be constantly changing: different distance, different face, different solar angle, and so forth. We needed some way to simulate what the view from the spacecraft would look like, and determine where we should aim our instruments. How much of Pluto could we see? What surface locations (longitude, latitude) would we be crossing over? What stars would be in the background? Which hemisphere of Pluto would be visible and at what resolution?
This is where one of my roles in the mission comes in. I am the developer and maintainer of GeoViz, which is the software tool the science team uses for planning observations. You can think of GeoViz as essentially a sophisticated and very accurate planetarium program – a ‘Geometry Visualizer’ – that shows the sky and planets as they appear on a given date. It gives you the view not as if you were standing on Earth, but as if you were on the spacecraft. Want to know exactly when Charon will pass behind Pluto? Just ask GeoViz to plot it. Need to know how many LORRI images will fit on a mosaic across Pluto at T – 3 hours? GeoViz will show you. Want to get a list of the bright stars that our Alice instrument will scan during a calibration observation, and make a movie of the scan? GeoViz will work this out as well. It is a web-based program to simulate observations, showing the geometry of the solar system, and how it fits in with the spacecraft’s various instrument fields.
My background is as an astronomer, not a programmer. But I and many astronomers spend much of our time as programmers: writing code to automate data analysis, perform simulations, or run instruments or mosaic images together. I started GeoViz as a way to automate figures I was producing for New Horizons’ Jupiter flyby in 2007. Since then I’ve been developing it into the powerful, general-purpose planning tool that it is now.

GeoViz consists of about 40,000 lines of code. Most of it is written in a language called IDL (Interactive Data Language), which has historically been widely used in the astronomical community. (Python is coming on strong, however, and I’d probably write it in Python if I were to start it from scratch.) It uses PHP and Javascript / jQuery for handling the web side of things, and IDL for the back end. The numerical calculations – position of the planets, velocity of the spacecraft, and instrument rotation angles – rely heavily on a library of geometry and orbit routines known as SPICE, developed at NASA’s Jet Propulsion Lab (JPL). SPICE is a really critical part of the code, because it does computations that would be very difficult to implement reliably on their own. Many different parts of the New Horizons team use SPICE – for tour planning, archiving, science analysis, plus the visualization that GeoViz does – and using the common SPICE library assures that we all get the same results. Likewise, if the SPICE libraries are updated (for a new trajectory, for instance), then all of the groups can update their results at the same time.
What were the biggest challenges? The first was to keep it simple to use, while still adding the new features that the science team requires. GeoViz is widely used because it works well, and it has a clear user interface. There are hundreds of different options internally, but the interface design is kept clean enough so that it’s not overwhelming.
The second challenge was to keep it running. GeoViz doesn’t communicate with the spacecraft directly, and is not ‘mission-critical.’ But during the encounter the science team was using it heavily, and we didn’t want it to go down, nor did we want a newly added ‘feature’ to turn out to have unforeseen side effects. We addressed that by keeping two versions of it: a ‘stable’ version that was only rarely updated, and a ‘development’ version with the latest features.

When I started working on New Horizons at SwRI, I was living in Boulder, Colorado, where much of the rest of the team was located. But my wife works as a diplomat, and her job takes her around the world. After being in Boulder for several years, we moved to Mexico, and then South Africa, and now we are living in India. Most of my work on the mission can be done remotely: with Pluto about 3 billion miles (5 billion kilometers) away, the fact that I may be on the other side of the Earth is a relatively small difference. For the flyby itself, I came back to the U.S. and spent two months working closely with my colleagues on the team. After ten years of working on the project – much of it remotely – I wasn’t going to experience the flyby over a speakerphone!
There were a lot of long nights at APL preceding the encounter and a few tense days as we closed in, followed by one of the most exciting moments of my life: listening with the world to Mission Operations Manager Alice Bowman, as she calmly polled her team of engineers before announcing the spacecraft’s successful passage through the Pluto system.
Now that I’m back abroad now, living in India gives me a great chance to talk about New Horizons, NASA, and Pluto to audiences around the world. I’ve given nearly a hundred public talks and lectures about the mission to audiences in Africa, Latin America and Asia. Some of the most rewarding talks were at rural schools in South Africa.
The science team members remain heavy users of GeoViz. It continues to be used post-flyby, not to plan observations, but now to help analyze them. (“Where was the spacecraft pointed for this image? Is that bright object Pluto’s moon Nix or a star?”) Working with the team has been one of the most rewarding experiences of my life – it’s amazing to think that all this planning paid off in getting us to Pluto. We really did it!

