Stephen Broccardo: A ‘STAR’ in PACE Data Collection

Stephen Broccardo, research scientist at NASA’s Ames Research Center in California’s Silicon Valley, is the principal investigator for the Sea-going Sky-Scanning Sun-tracking Atmospheric Research Radiometer (SeaSTAR). The ship-based instrument is one of many in a campaign set out to gather data around the world to check the information that NASA’s PACE (Plankton, Aerosol, Cloud, ocean Ecosystem) satellite is collecting in orbit. Broccardo will use SeaSTAR for the first time in an upcoming PACE validation campaign. 

How are you going to be gathering your data?

I have spent about five years now building a new instrument, which I’ve called SeaSTAR. As far as I know, it’s going to be the only one of its type. It’s a custom-built Sun and sky photometer and polarimeter instrument that measures and quantifies the quantity and optical properties of atmospheric aerosols.

How does SeaSTAR compare to the instruments on PACE?

The PACE satellite is trying to quantify aerosols from space looking down. I’m trying to do it from the surface looking up. I do that in two ways. One way is just directly tracking the Sun, and the instrument measures the sunlight coming down through the atmosphere and how much was absorbed on its way through the atmosphere at various wavelengths. From that you could tell quite a lot about the aerosols in the atmosphere. The second way is a polarized mode where SeaSTAR is not tracking the Sun. Instead, it’s looking at the sky at a series of angles off the Sun and measuring the light coming in at various wavelengths and polarizations. From there, we should be able to infer not just the amount of aerosols in a column of atmosphere, but also some of their properties.

What are you most looking forward to during the validation campaign?

This will be the first deployment of SeaSTAR, which is pretty exciting. It’s been many years in the making.  I’m looking forward to seeing the first data and being able to contribute that to the PACE project.

What is one catch-all statement you would use to describe the importance of your work?

When a satellite observes the ocean from space, most of the signals it receives are not from the ocean because the ocean is dark. Instead, it’s mostly from the atmosphere. So, in order to quantify what’s in the ocean, you need to somehow subtract out the atmosphere’s signal. My job is making sure that any assumptions made in algorithms are correct. By assuring the correct equation, we get a more accurate estimate of the amount of aerosols in a column of atmosphere and some of their properties.

Editor’s Note: This SeaSTAR instrument is different than the 1997 SeaSTAR spacecraft that carried the SeaWIFS instrument.

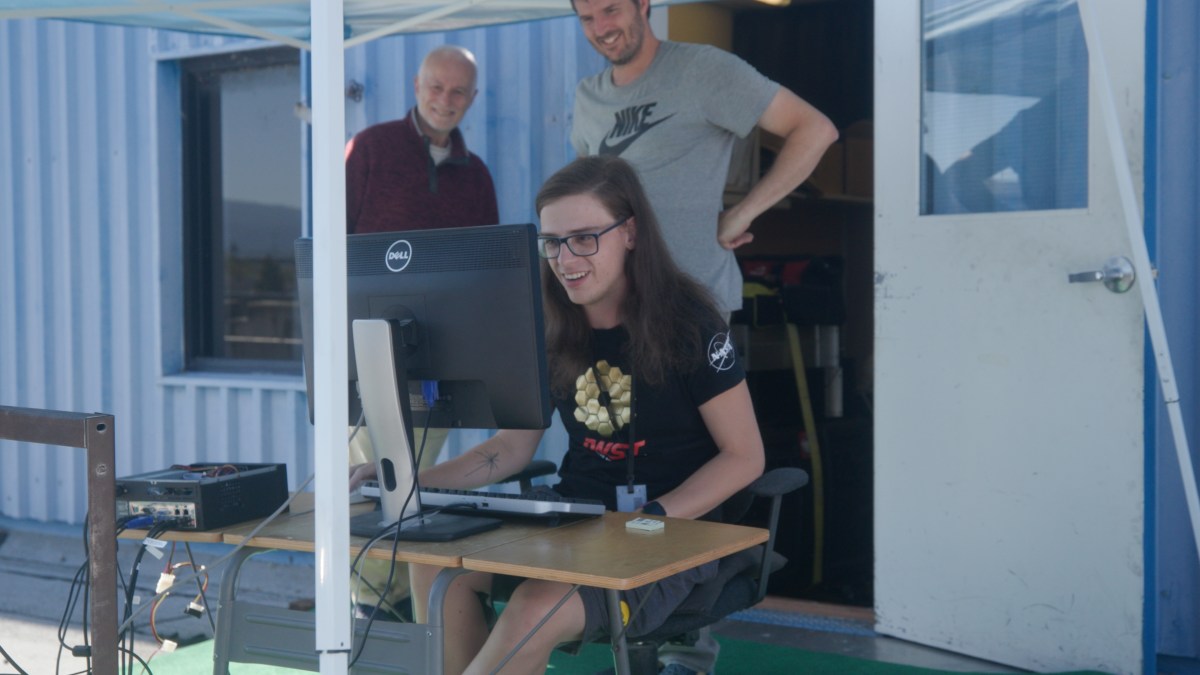
Header image caption: Stephen Broccardo looks over the shoulder of Steven Tammes, a grad student from the University of Iowa, while another onlooker peers at the computer screen too. Credit: Aaron McKinnon/NASA

By Erica McNamee, science writer at NASA’s Goddard Space Flight Center

Brice Grunert: The Great Campaign of the Great Lakes

Brice Grunert, assistant professor at Cleveland State University in Ohio, is a member of NASA’s PACE (Plankton, Aerosol, Cloud, ocean Ecosystem) validation science team. The team, called PACE Radiometry and IOPs for Novel Great Lakes Science (PRINGLS) is one of many groups participating in a campaign set out to gather data around the world to validate the accuracy of information from the PACE satellite up in orbit. He and his team recently took to the Great Lakes for one of many segments of the campaign to study light optical properties in the lake water.   

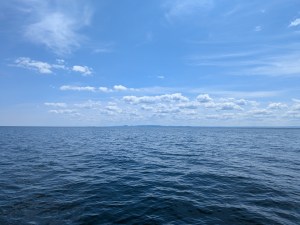
The image is split by the horizon down the middle. The bottom part of the image is of the dark blue waters of the lake. There are slight ripples on the water, but no waves. The top portion of the image shows bright blue skies with some wispy clouds, primarily closer to the horizon.
Oligotrophic waters of Lake Superior’s Keweenaw Bay, with Michigan’s Huron Mountains in the background. Credit: Brice Grunert/CSU Ohio

Where did you go for your field campaign? Why did you choose that location? 

We’re focusing on the western and central portions of Lake Erie and Lake Superior, as well as coastal Lake Michigan and the Green Bay area. The reasoning for why we’re selecting these sites is that there are really nice biogeochemical and optical gradients, or opportunities to see the transition regions. Green Bay is the best example – it receives a lot of river water input on its southern end from the Fox River, which accounts for about a third of the total phosphorus inputs to Lake Michigan. So, you have this narrow, constrained bay that receives an enormous amount of nutrients, which then joins the nutrient-poor Lake Michigan. This results in a gradient of nutrient-rich waters in the southern end, with low plant nutrients waters in the northern end, and these filaments of harmful algal blooms. You get just a ton of variability over the course of a single day of sampling – and that’s consistent with all the environments that we’re sampling within the Great Lakes. 

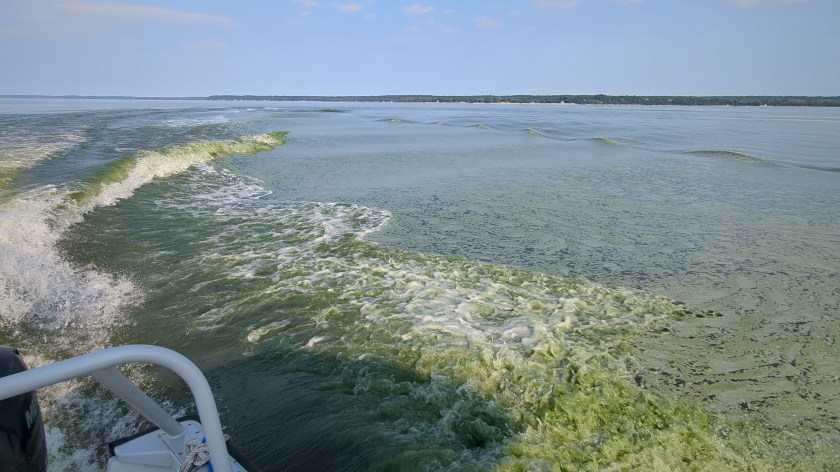
The horizon of the image is about three-quarters of the way up the picture. The bottom portion of the picture shows green waters of the lake, some portions with white peaks from waves created from the boat, which can be slightly seen on the left side of the image. The top portion of the picture shows the gray-blue colored sky.
A cyanobacteria surface scum in Green Bay, Lake Michigan in July 2024, disturbed by the research vessel. Credit: Brice Grunert/CSU Ohio

How are you gathering your data? How do they relate to PACE’s instruments? 

We’re using an above-water radiometer, which is a remote sensing instrument that measures reflectance. It is essentially measuring the same thing that PACE’s Ocean Color Instrument sensor measures – the light leaving the water surface. We also have a hyperspectral backscattering instrument, which measures the light reflected within an aquatic system. We combine information from the backscattering instrument with what we learn from water samples, which we use to measure absorption due to colored dissolved organic matter and particulate matter – for example, phytoplankton – to provide the inherent optical properties. Inherent optical properties are the fundamental pieces of an ecosystem that are going to contribute to the color of the water that the satellite is observing. 

What are some of the rewards and challenges of field campaigns? 

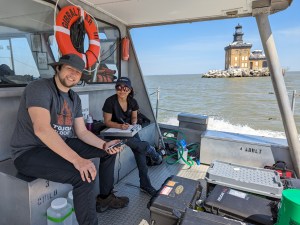
A woman and a man are sitting on a bench on a boat on the left side of the image. The man is sitting closer to the camera and is wearing a hat, a gray t-shirt, and black pants. The woman is wearing a hat, a black t-shirt, and pants. There is equipment and boxes in front of them, and an orange, circular life preserver hanging behind them. In the background are the brown-blue waters of the lake, as well as a brown building sitting on an island on the lake.
Trevor Holm, a Master of Science student, and Anshula Dhiman, a PhD student, recording station information at a western Lake Erie sampling site. Credit: Brice Grunert/CSU Ohio

You get to go to all these new locations and see how the system functions. It’s one thing to see it from satellite perspectives, but another thing to actually be out on the water and see that chlorophyll concentration that a satellite is seeing, which will look different across these unique environments. Being able to go out there and immerse yourself within that system, see the surroundings, and interact with new people is a huge reward for us.

The challenge is that you really never know what’s going to happen. For example, one time in April, the wave and wind forecasts looked good, and we got out there to find waves that were way too big to do any type of sampling. So, it’s sort of just having that mindset of accepting and being flexible with whatever comes your way.  

What is one catch-all statement you would use to describe the importance of your work? 

There really is a need for satellite observations to give us that spatial coverage and then that temporal piece that is often missing from your traditional kind of in-situ sampling campaigns. But then at the same time, the reason why we go out on these boats is because satellites have their own limitations.  

We’re trying to push the envelope of what a satellite is able to tell us about Earth systems, by leveraging the strengths of an in-situ field campaign. The goal is to try to get the two – the field campaign and the satellite – as close together as possible and have the satellites see things as well as we can see them from a ship. That’s really a goal so that we can better understand our Earth systems. 

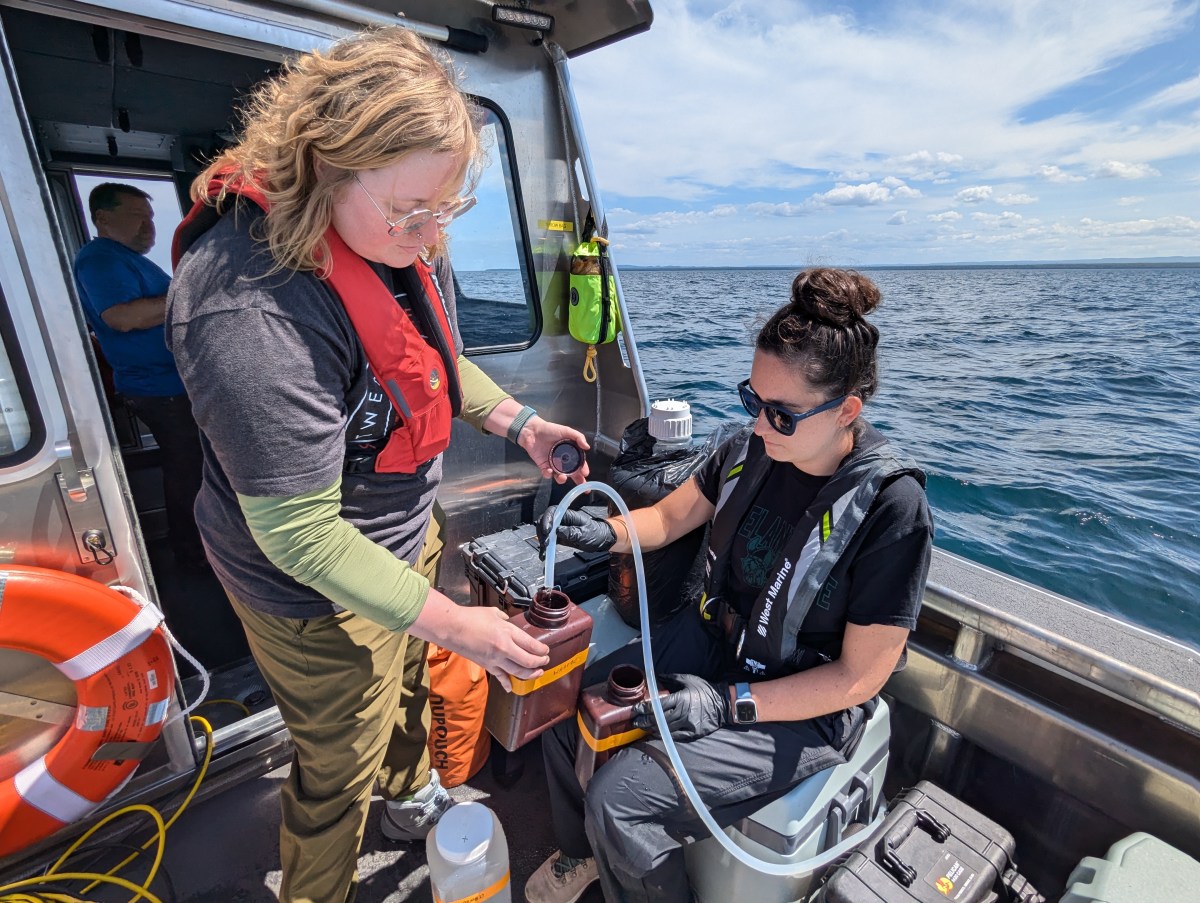
Header image caption: Kendra Herweck, a research technician, and Emily Hyland, a Master of Science student, collecting water samples in Lake Superior’s Keweenaw Bay. Credit: Brice Grunert/CSU Ohio 

By Erica McNamee, Science writer at NASA’s Goddard Space Flight Center
Joaquim Goes: Gathering Data in the Bay of Bengal

Joaquim Goes, a professor of remote sensing research at Lamont Doherty Earth Observatory at Columbia University Climate School, is a member of the PACE (Plankton, Aerosol, Cloud, ocean Ecosystem) Northern Indian Ocean Validation group. The group is one of many in a campaign set out to gather data around the world to validate the information that the PACE satellite is collecting up in orbit. In June, Goes, along with team members from NASA’s Goddard Space Flight Center in Greenbelt, Maryland; Space Applications Center (SAC); ISRO (Indian Space Research Organization); and the Indian National Center Ocean Information Systems, embarked on a research vessel to the Bay of Bengal. They gathered data on phytoplankton communities and ocean color pigments. 

Why did you choose that location for your research campaign? 

The Bay of Bengal is connected to the Indian Ocean, but it’s strongly influenced by freshwater, which makes it a little different than many other bays and seas. We wanted to go somewhere that could show us the effects of this freshwater influence, and plus there isn’t a lot of historical data from that region. It presented us with the opportunity to investigate riverine influence on phytoplankton community structure, biogeochemistry, and ocean optical properties.  

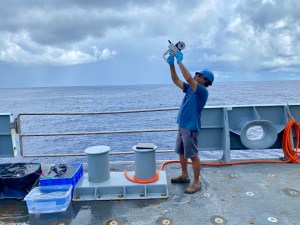
A man stands on board a ship facing the left side of the image. He is wearing a blue hard hat, a blue tshirt, gray shorts, and is holding a scientific instrument above his head, pointing it towards the sky. On the boat are tables and buckets next to the man. Just behind him are the railings of the side of the ship. The background of the image shows the flat blue water of the ocean, the horizon, which is about two thirds of the way up the image, and a gray-blue sky covered in clouds.
Joaquim Goes making sky radiance measurements with a hand-held radiometer during the Bay of Bengal Cruise. Credit: Dr. Anima Tirkey/Space Applications Centre, ISRO

How did you gather your data? 

We had several bio-optical instruments on board the research ship, some of which operated continuously as the ship moved along a pre-determined cruise track while others were deployed when the ship stopped, usually at mid-day when PACE and Oceansat-3  were passing over our study area.  

Some of the optical instruments measured the color of water using above water instruments, while others were deployed in the water allowing us to make ocean color measurements at different depths. The color of the water is the result of the interaction of sunlight with seawater and its constituents which include phytoplankton, minerals and other non-algal particles and colored dissolved organic matter. For example, if there are more phytoplankton in the water their photosynthetic pigments strongly absorb blue and green light, while scattering back green light, making the water green. The types of pigments phytoplankton contain vary, and the color they render the water can be used to deduce different phytoplankton types. 

Instruments like the FlowCam helped us image the kinds of phytoplankton in the water, while others allowed us to study their ability to photosynthesize and fix atmospheric carbon dioxide. We also filtered water samples so that we could measure the types of phytoplankton pigments as well as the absorption of light by phytoplankton and non-phytoplankton particles and colored dissolved organic matter.  

How are you planning on using PACE data? 

We are really interested in looking at outbreaks of harmful algal blooms, which are becoming a water quality issue in the Northern Indian Ocean. These blooms are so widespread that they cannot be adequately sampled by ships alone. To address this, we need data to develop algorithms that will help us identify these blooms from space. PACE data and other satellite products can be implemented into early warning systems for harmful algal blooms which are causing havoc worldwide.  

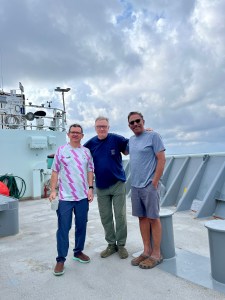
Three men stand on a boat, the man in the middle has his arms around the backs of the other two, all three facing the camera and smiling for the picture. The man on the left is wearing glasses, a white short sleeved shirt with a pink and pale green stripe pattern and blue jeans. The man in the middle is wearing glasses, a blue shirt and green pants. The man on the right is wearing sunglasses, a light blue shirt, and gray shorts. Behind them on the ship are railings to the edge of the ship as well as several pieces of machinery and equipment. The background of the image shows a blue-gray sky covered in clouds.
Joaquin Chaves and Scott Freeman from NASA’s Goddard Space Flight Center with Joaquim Goes on board the Research Vessel Thompson during the Bay of Bengal Cruise. Credit: Dr. Anima Tirkey/SAC, ISRO

What do you enjoy most about field work? 

You get to meet new people. The feeling of comradeship and building networks is so exciting to me. I’m at a point in my career where I feel that it’s important for young people, especially from developing countries, to learn how to use the latest instrumentation and connect with others to support their research endeavors. On this campaign we had a diverse group of ocean and atmospheric scientists from NASA, the University of Washington, Notre Dame, and UMass Dartmouth, as well as two institutions from India, with many young people involved. We worked very closely with them to perfect some of the data collection methods and analyses protocols. Overall, the opportunity to meet new people and explore new places is what makes field work so enjoyable.  

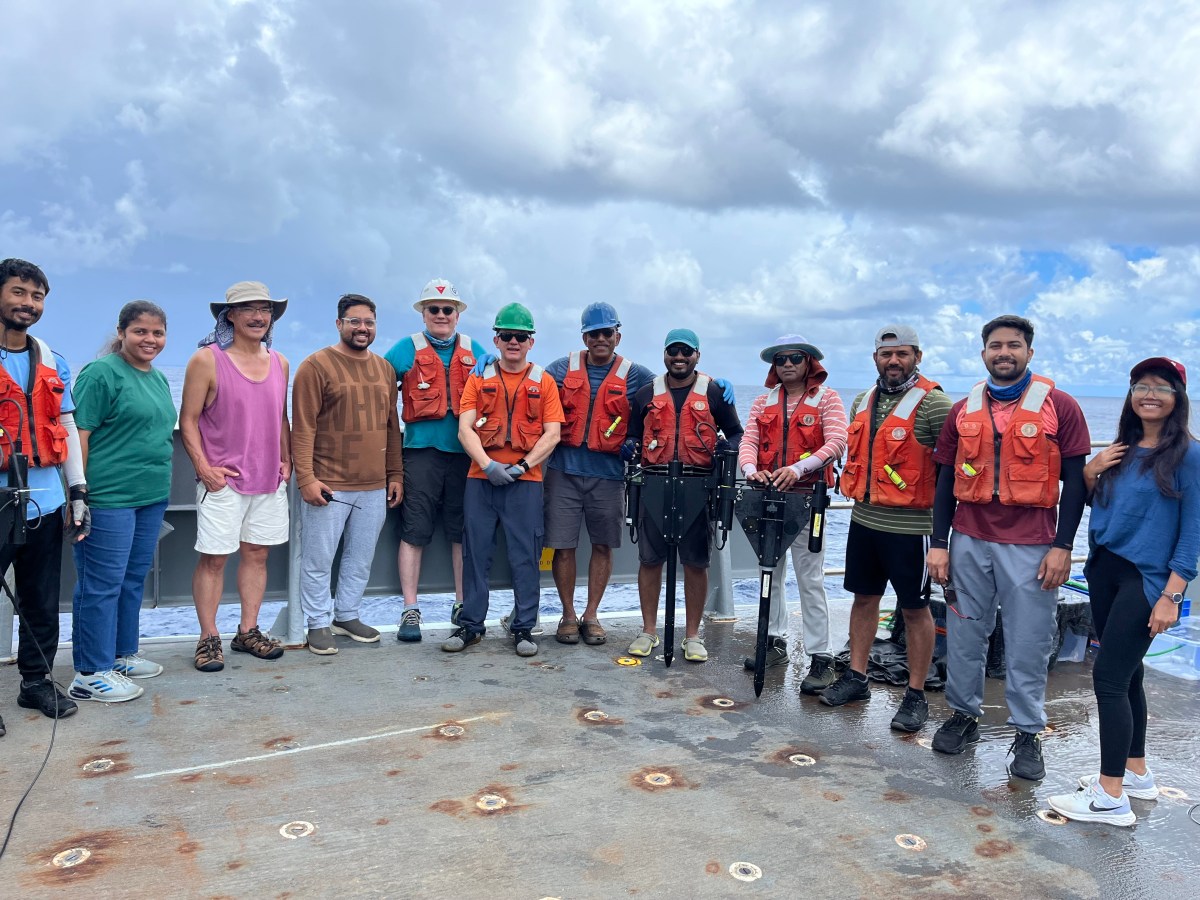
Header image caption: NASA PACE and ISRO Oceansat-3 calibration and validation teams from Space Applications Center, ISRO, Indian National Center for Ocean Information Services, NASA Goddard Space Flight Center and Lamont Doherty Earth Observatory, Columbia University along with Chief Scientist Dr. Craig Lee. Courtesy of Joaquim Goes 

By Erica McNamee, Science writer at NASA’s Goddard Space Flight Center
Fernanda Henderikx-Freitas: Scanning the Hawaiian Seas

Fernanda Henderikx-Freitas, assistant professor at University of Hawaii, is the lead principal investigator of the PACE validation team called the Hawaii Ocean Time-series program for validation of the PACE Mission in oligotrophic waters (HOT-PACE). The group is one of many in a campaign set out to gather data around the world to check the accuracy of information from NASA’s PACE (Plankton, Aerosol, Cloud, ocean Ecosystem) satellite up in orbit. She and her team recently took to the seas for the first segment of a three-year campaign to study the phytoplankton in the ocean surrounding Hawaii.

Where did you go for your field campaign and why did you choose that location?

We went to Station ALOHA, which is about 62.1 miles (100 kilometers) north of Oahu. It is a site that has been visited nearly monthly since 1988 as part of a long-term sampling program called the Hawaiian Ocean Time-series (HOT). We piggybacked on one of their monthly cruises, which last 4-7 days. We’re hoping to continue gathering data there for the next three years. Since there’s been oceanographic data collected at Station ALOHA for over 35 years now, we understand a lot of what the ocean properties should look like, which makes it a perfect location for a satellite validation site where data accuracy is so important.

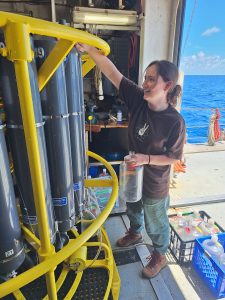
A woman stands in the image facing toward the left. She is wearing a dark brown shirt and teal colored pants. Her right arm is lifted up toward a piece of machinery that is made of several cylindrical tubes and is surrounded by bright yellow piping.
MSc student Paige Dillen on HOT351 collecting water samples from the CTD rosette for the HOT-PACE validation project. Credit: Fernanda Henderikx-Freitas

How are you gathering your data?

We are focusing on the very basic information about how light interacts with water, which we need to validate PACE’s data. Whenever we see the clear sky overhead and we know the PACE satellite is close by, we’re going to be out there collecting water. We run seawater through special filters that get immediately frozen at minus 112 Fahrenheit (minus 80 degrees Celsius) for later analysis in the lab back on land where we determinate pigment composition and absorption properties by particles and dissolved materials in the water.

We also have a series of instruments that measure the total absorption and scattering properties of particles in the water at high resolution using a pump system where water is diverted from a depth of about 23 feet (7 meters) into the ship laboratories.

Finally, we have instruments that we throw in the water that look at the light profile in the water column, as well as another instrument that we point at the sky to look at optical properties of the atmospheric path between us and the satellite.

How do the instruments that you use compare to what PACE uses up in orbit?

PACE is a hyperspectral satellite, and on the ship we have hyperspectral sensors that look at both the absorption and scattering properties of seawater. These properties are key for informing satellite models that try to convert the raw reflectance signal that the satellite receives to meaningful quantities that we are interested in. For example, quantities of organic and inorganic carbon concentrations or phytoplankton-specific concentrations. Throughout our first cruise, which lasted five days, we had these instruments on the entire time, so that maximizes the chance of us getting a match up with the satellite.

We also have a hyperspectral radiometer that we use to profile the water column once a day while on the cruise — this radiometer has as many wavelengths as PACE has, and provides the closest type of data to the data measured by the satellite, which makes it incredibly important and useful in validation and calibration efforts.

How are you planning on using PACE data in your own research?

We are very interested in better understanding the relationships between bulk optical properties of the water and phytoplankton community structure, a research area that we think PACE is very well poised to help advance. Paige Dillen is a graduate student on our team who will go on every cruise to collect validation data for PACE and will also base her whole project on PACE. She’ll be looking at the relationships between pigment composition and phytoplankton absorption, which could help develop and improve satellite algorithms in the future.

What do you enjoy about field work?

I love seeing the night sky out here. You just look up and you see the Milky Way and meteor showers because you’re so remote. You can’t get it anywhere else. Seeing all the wonderful microscopic creatures is also amazing — we have a series of microscopes and imaging tools onboard that really help us feel connected with the water we are sampling. There is something very special about being able to collect your own data, it makes you feel like you’re completely involved in your research.

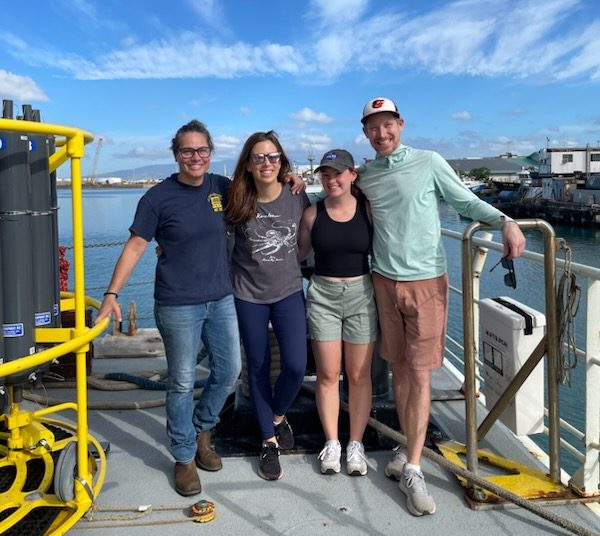
Header image caption: HOT-PACE team on HOT 351, July 2024, onboard the R/V Kilo Moana: From left to right: Angelicque White, Fernanda Henderikx-Freitas, Paige Dillen, Tully Rohrer. “We are so excited to have a role in providing these essential datasets!” said Henderikx-Freitas. Credit: Brandon Brenes. 

By Erica McNamee, Science writer at NASA’s Goddard Space Flight Center