The breeze across the California desert kicks up some dust and sand. As a NASA research plane rolls down the runway and prepares for takeoff, its wings vibrate with the gust of wind. It’s a flight day for one of NASA’s most expansive and complex field campaigns.
The goal: to check the data collected from orbit by NASA’s PACE (Plankton, Aerosol, Cloud, ocean Ecosystem) mission. To do that, members of the PACE-PAX (PACE Postlaunch Airborne eXperiment) field campaign deployed two aircraft and a research ship from multiple locations in California over the duration of September 2024.
“PACE is making next-generation observations of Earth’s oceans, atmospheric aerosols, and clouds, and PACE-PAX is testing that those new observations are accurate so that we can be at peace with our data,” said Kirk Knobelspiesse, mission scientist for PACE-PAX and an atmospheric scientist at NASA’s Goddard Space Flight Center in Greenbelt, Maryland.
Here is a look at a day in the life of an airborne field campaign from one of the PACE-PAX locations: NASA’s Armstrong Flight Research Center in Edwards, California.
Preflight
As the forecasting lead for PACE-PAX at NASA’s Ames Research Center in California’s Silicon Valley, Rei Ueyama’s work starts several days before the flight. She is looking for clouds and aerosols that the campaign instruments can measure to compare with satellite data. She is also studying the wind forecasts to make sure the conditions are safe for flight for NASA’s ER-2 aircraft.
“Forecasting support for airborne campaigns is as essential for the success of the campaigns as the instruments that make the measurements,” Ueyama said. “Meteorology will dictate where the aircraft flies, what science it addresses and, for some sensitive aircraft like the ER-2, whether the aircraft flies at all.”
The results of the weather forecast help Samuel LeBlanc, science flight planner for PACE-PAX at NASA Ames, create the flight plans for both the ER-2 and a second aircraft. The routes are intricate and can change up until the last minute, as LeBlanc considers weather, cloud and aerosol targets, and the locations of the other aircraft, research ships, and the PACE satellite.
LeBlanc also worked to coordinate with EarthCARE (Earth Cloud, Aerosol, and Radiation Explorer), a joint European Space Agency and Japan Aerospace Exploration Agency satellite that also had overpasses during the campaign. PACE and EarthCARE both examine the role that clouds and aerosols play in Earth’s climate and offer another way to calibrate and corroborate with each other.
On the days leading up to a flight, Ueyama and LeBlanc present this information to the campaign leads across California. On a potential ER-2 flight day, they provide any updated information at the first video call of the day. In this case, at 6 a.m.

Given the limited timespan for the campaign, the unpredictability of the weather, and the multitudes of key measurements needed, tensions can run high during these meetings. The questions don’t always have a right answer. Will the winds be too high during the planned landing time? Do we prioritize flight time versus overpass? Is it best to postpone and wait for better conditions? Or would that mean we end up with unused flight hours at the end of the campaign? Everyone in the room and online voices their opinions. Despite the limited time, the team uses every spare second they have to weigh the possibilities. Knobelspiesse will make the final call on whether planning for the flight will continue.
On this day, he and the pilot give the ER-2 flight the all clear, turning the decision into a flight plan during the pre-flight briefing.
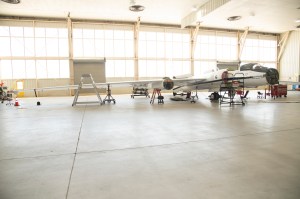
In the short time leading up to take-off, campaign leads finalize coordination plans, while scientists, engineers, and technicians begin their own checklist of tasks to prepare for the flight. Each instrument on board has its own team that manually checks the performance on the ground to make sure the instrument is working as expected.
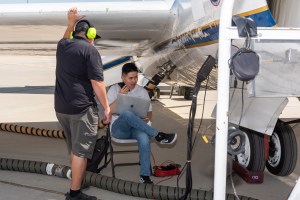
Once the instruments are connected to power and secured inside the ER-2, the team leads have given the OK on the flight, and the pilot is ready to go, it’s near flight time. Just before takeoff, everyone checks in to a group message for a final check list of “go” and “no-go” calls. Each instrument gives their signal, and the ER-2 crew and pilot provide updates.
“When everyone is firing together and working well, the synergy in the group is incredible,” said Nicki Reid, ER-2 operations engineering lead at NASA Armstrong. “We’re all united in a common goal to collect the data that will inform science and policy for years, if not decades, to come.”

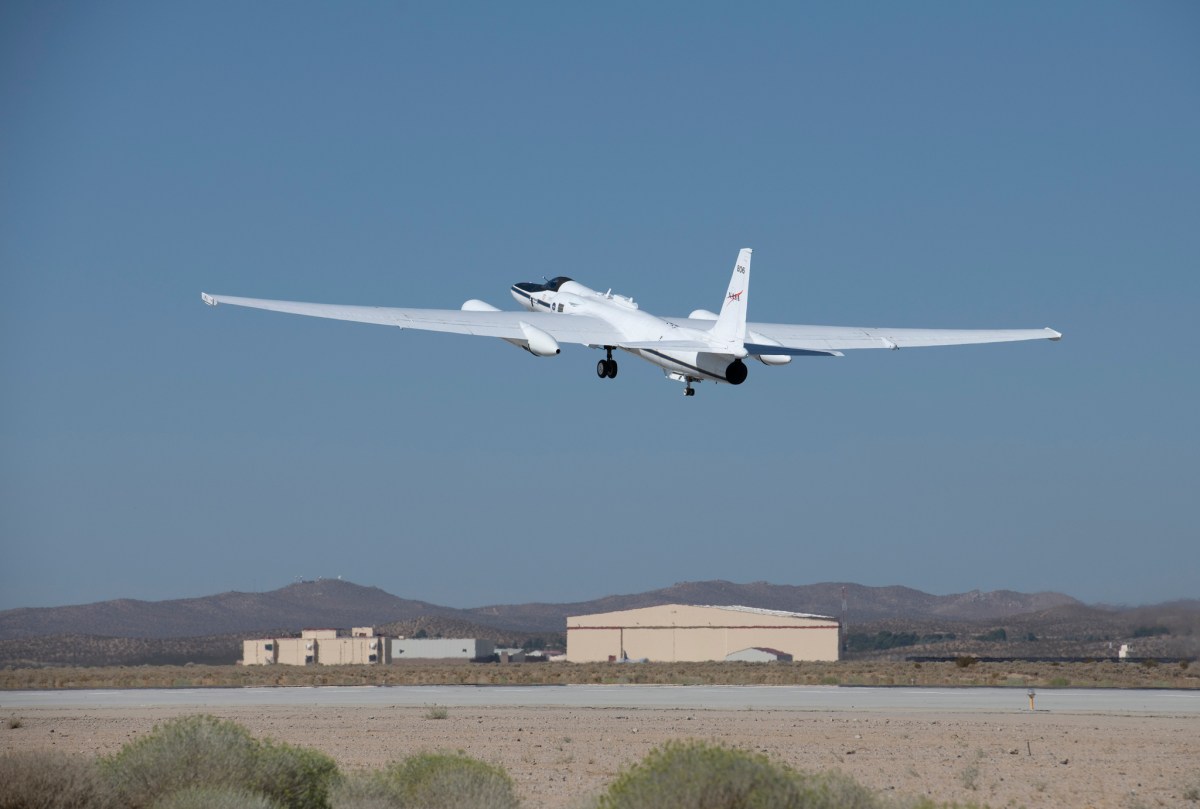
Even with the breeze, the temperatures have now risen to over 100 degrees Fahrenheit. With waves of heat rising off the cleared runway, the ER-2 speeds up and takes flight into the blue sky to begin collecting data.
During and Post Flight
After a packed morning, it quiets down at NASA Armstrong while the plane is in the air because the scientists have limited control over their instruments. They can check to make sure instruments are performing properly and collecting data. In some cases, they can make necessary changes remotely; in others, the pilot must be contacted, for example to reboot an instrument’s computer. So many team members begin their preparations for upcoming flights during the quiet hours.
Hours later, after the flight finishes, the team reconvenes to debrief. They discuss how the flight went, if there are any errors that appeared from the instruments, and if there are changes that need to be made for the next flight.
To close out the day, scientists begin downloading data and making adjustments to the instruments. Flight plans are drafted, and weather information is gathered for the coming days. And then it all starts over once again.
Post Campaign
PACE-PAX concluded at the end of September, but the work is not over.
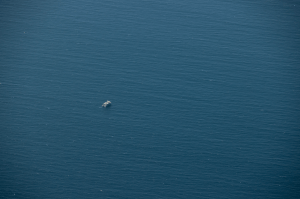
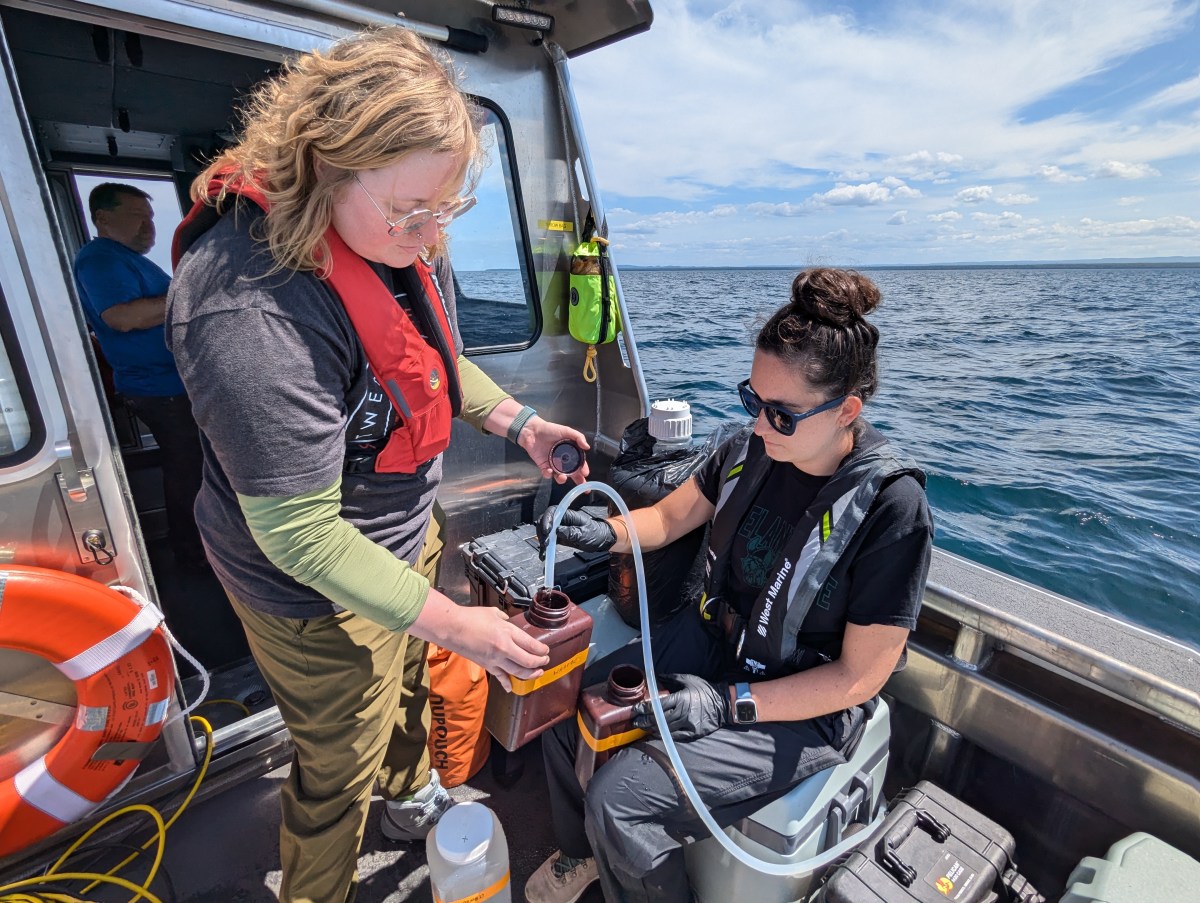
During the campaign, scientists gathered data from 81 ER-2 flight hours, 60 Twin Otter flight hours, and 15 days of research vessel trips. They coordinated six days of targeted observations during EarthCARE overpasses and 16 days during PACE overpasses. Scientists now have the monumental task of analyzing all of the air and ship data and measurements and comparing them to what PACE saw. Data will be available to the public starting in March 2025.
“The choreography I witnessed from the PACE-PAX team was inspired,” said Jeremy Werdell, project scientist for the PACE mission at NASA Goddard. “Pulling off an exercise of this scope and range is no easy task, but the crew navigated it beautifully, with the result being a dataset that will absolutely change the way we view our home planet.”
Header image caption: The ER-2 aircraft takes off from NASA’s Armstrong Flight Research Center for the PACE-PAX campaign. Credit: NASA
By Erica McNamee, science writer at NASA’s Goddard Space Flight Center in Greenbelt, Maryland