The PI’s Perspective: On Final Approach to Ultima

set of images taken by the Long Range Reconnaissance Imager (LORRI) aboard New Horizons, Ultima Thule emerges from behind stars and grows brighter as the spacecraft approaches it.
In this set of images taken by the Long Range Reconnaissance Imager (LORRI) aboard New Horizons, Ultima Thule emerges from behind stars and grows brighter as the spacecraft approaches it. Image credit: NASA/Johns Hopkins Applied Physics Laboratory/Southwest Research Laboratory/Henry Throop

The New Horizons spacecraft is healthy and on final approach to explore Ultima Thule in the Kuiper Belt. On New Year’s Eve and New Year’s Day, New Horizons will swoop three times closer to “Ultima” than we flew past Pluto!

On Saturday, Dec. 15, the New Horizons hazard watch team concluded its work, having found no moons or rings in the path of New Horizons on its planned closest approach to Ultima. With that information and a unanimous finding by our mission stakeholders team, I informed NASA that we are “go” to fly by Ultima on the trajectory that yields the best science. As a result, New Horizons will approach to within 3,500 kilometers (about 2,200 miles) of Ultima early on New Year’s Day. There is no longer any chance we will divert to a farther flyby distance with consequently lower-resolution images.

Just yesterday, New Horizons conducted another small trajectory correction engine burn to help us home in on Ultima. That 0.26 meter/second burn lasted only 27 seconds and was executed perfectly by the spacecraft, cancelling about 300 kilometers (180 miles) of estimated targeting error and speeding up our arrival time by about five seconds. We will continue to track and target the spacecraft toward our expected arrival location and time. If needed, we can transmit files to New Horizons as late as the day before arrival to correct for any offsets from our flyby design, but we cannot burn the engines any longer. This is because New Horizons will soon enter Encounter Mode, which does not allow for engine burns.

Encounter Mode (or EM) is designed to ensure the flyby science even if the spacecraft malfunctions. Normally, if New Horizons develops problems in flight – which is very rare – the bird halts its flight plan and calls Earth for instructions. But if that were to happen during flyby closest approach, we’d likely miss getting the goods on Ultima before our mission control on Earth could intercede. After all, the round-trip communications time from Ultima to Earth and back is now over 12 hours.

Encounter Mode is the solution to this dilemma. Once the spacecraft is in EM beginning on Dec. 26, it will use onboard software to correct problems and then resume its activities without instructions from Earth. We used Encounter Mode at Pluto, but fortunately, no problems came up during that period. At Ultima we want the same level of flyby protection.

But before we can enter Encounter Mode, we must first transmit the entire sequence of thousands of carefully choreographed spacecraft and instrument commands to New Horizons’ main computer. That radio transmission will take place Dec. 20, and will be verified by a technique known as “checksums” on Dec. 21. The load will engage on Christmas Day, Dec. 25.

We are flying by Ultima to see a Kuiper Belt object up close for the first time. Ultima is special for two reasons. First, based on its orbit type, we know that Ultima was formed way out where New Horizons is, 4 billion miles away. That means Ultima (officially named 2014 MU69) was formed in the middle of the Kuiper Belt, where temperatures are close to absolute zero.

Second, because of where it was formed and the fact that Ultima is not large enough to have a geologic engine like Pluto and larger planets, we expect that Ultima is the most well-preserved sample of a planetary building block ever explored. In effect, Ultima should be a valuable window into the early stages of planet formation and what the solar system was like over 4.5 billion years ago.

What will Ultima reveal? No one knows. To me, that is what’s most exciting—this is pure exploration and fundamental science!

And when will we see what Ultima is all about? Close approach images, composition spectra and other kinds of data will already start to flow from New Horizons on flyby day—Jan. 1! We expect to have an image with almost 10,000 pixels on Ultima by that night, ready for release on Jan. 2. By that first week of January we expect to have even better images and a good idea of whether Ultima has satellites, rings or an atmosphere.

Early next year, megapixel images will be sent, and if they contain the target – shooting at this resolution while speeding by at over 32,000 miles per hour is a stretch goal – they will reveal Ultima’s geology in exquisite detail.

This beautiful Ultima Thule flyby poster was created by artist-astronomer Tyler Nordgen.
This beautiful Ultima Thule flyby poster was created by artist-astronomer
Tyler Nordgen.

The Ultima Thule flyby is going to be fast, it’s going to be challenging, and it’s going to yield new knowledge. Being the most distant exploration of anything in history, it’s also going to be historic.

Fifty years before this flyby, at Christmas time 1968, I sat on my grandparents’ bed as a boy and watched Apollo 8 take off on the first human expedition to visit another world—our moon. That mission was also fast, it was challenging, and it yielded new knowledge. It was historic too. I will never forget it, nor the many talented people who made it possible and the three brave astronauts who flew aboard it.

The Apollo 8 mission happened 50 years ago this holiday season. Image credits: NASA.

Over all those years between Apollo 8’s December exploration and ours, NASA has made history by exploring farther and farther, oftentimes making what is very hard look very easy. Occasionally, missions stumbled. But most performed spectacularly, and as a result we have made Carl Sagan’s prediction that in just a generation or two the planets would be transformed from points of light to real and explored worlds. Equally important, NASA has shared the results of this exploration with people everywhere on this planet we call Earth, humankind’s cradle.

We on the New Horizons team are in awe of what Apollo 8 accomplished so long ago. With all the other missions of human and robotic exploration that came after, it opened up a solar system and a future that may soon see humans living on multiple worlds and robots exploring in new ways. The tradition of exploration is deep in homo sapiens; it sets us apart from other life here on Earth. Perhaps it’s something we may find in common with other spacefaring civilizations, if they exist.

Well, that’s my report for now. The flyby of Ultima Thule is literally now just days away. Onward now New Horizons, in the spirit of exploration, onward to 2019, and Ultima Thule!

And as always, keep exploring — just as we do!

-Alan Stern

There are many ways to follow New Horizons news and commentary on social media, such as these listed below. You can find others by searching the web.

p.s. You only have until midnight (EST) this Friday – Dec. 21 – to enter your name and a message to be radioed to Ultima Thule and New Horizons on flyby day at http://pluto.jhuapl.edu/Send-Greetings/


You only have until midnight (EST) this Friday – Dec. 21 – to enter your name and a message to be radioed to Ultima Thule and New Horizons on flyby day at http://pluto.jhuapl.edu/Send-Greetings/

 

New Horizons: Getting to Know a KBO

Today’s post is written by Simon Porter, a New Horizons postdoctoral researcher at the Southwest Research Institute in Boulder, Colorado. Simon’s work focuses on the small satellites of Pluto.

Hi, I’m Simon Porter, a postdoctoral researcher on NASA’s New Horizons mission. In this blog post, I’m going to talk about our observations of the Kuiper Belt object (KBO) called (15810) 1994 JR1, or simply ”JR1,” with the New Horizons spacecraft.

New Horizons flew past Pluto nearly a year ago and has been sailing through the Kuiper Belt ever since. In November 2015 and April 2016, we used the telescopic Long Range Reconnaissance Imager (LORRI) on board New Horizons to take pictures of JR1 as we flew past it. This was our first “distant flyby” of a KBO (about 66 million miles, about as close as Venus is to the sun), and the first-ever distant observation of a KBO from the Kuiper Belt. We were able to get a huge amount of science out of these images, and they may be a preview of things to come as we observe many more KBOs this way, if an extended mission is approved.

We first observed JR1 at the start of November 2015, taking four sets of 10 images, spaced one hour apart. It was even farther away at that time (172 million miles), and because of an error in targeting, it ended up on the side of picture frames instead of in the middle. However, JR1 was visible in all 40 images, dancing slowly across the field of view. In addition, we pointed the Hubble Space Telescope at JR1 in early November, so that it saw JR1 at almost the same times as New Horizons, accounting for the five hours that it took JR1’s light to reach Hubble. This was the longest-baseline parallax observation ever made – another record for New Horizons! –and allowed us to really improve our knowledge of JR1’s orbit.

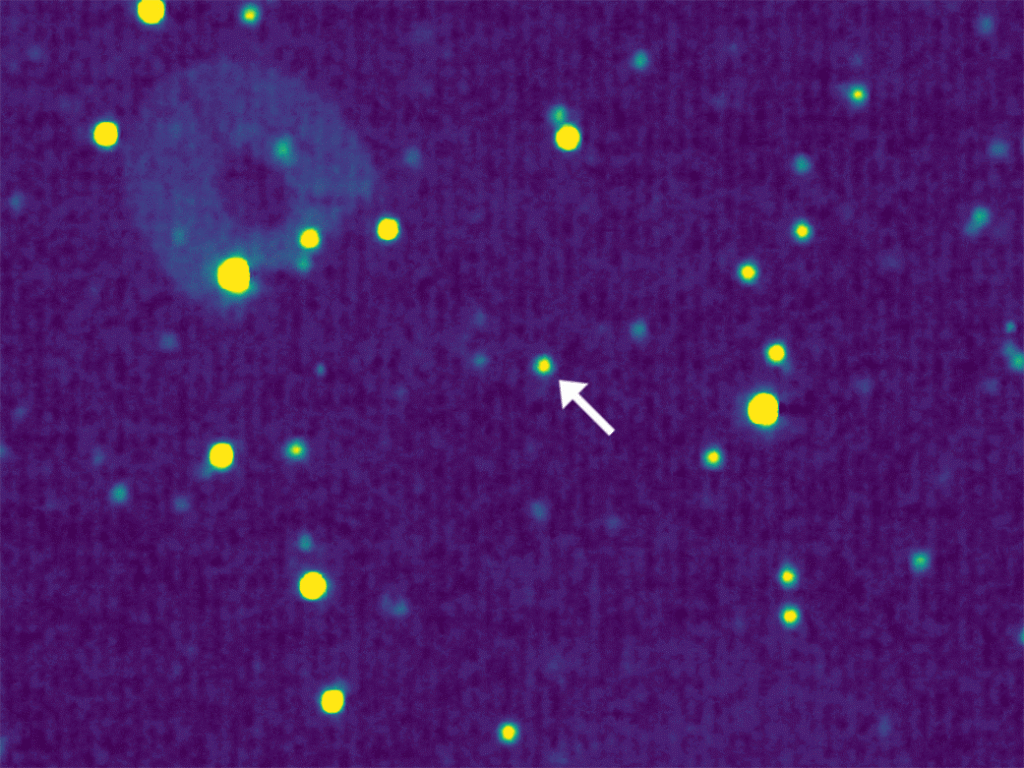
The four observations of 1994 JR1 that New Horizons made in November 2015. The KBO is the dot in the center, and the stars are moving past in the background. Credits: NASA/JHU APL/SwRI
The four observations of 1994 JR1 that New Horizons made in November 2015. The KBO is the dot in the center, and the stars are moving past in the background. Credits: NASA/JHUAPL/SwRI

With this new orbit in hand, we pointed the spacecraft to image JR1 again this past April 2016. This would be the closest that New Horizons got to JR1, and we commanded the spacecraft to take lots more pictures than we had in November. We started with two “deep” sets of 24 images each, which could be added together to pick out any moons around JR1. We had already looked at JR1 with Hubble and saw no moons, so it was no surprise to find none in the New Horizons images, but it was worth a check. The ghostly circular pupil image and the little dots that are moving around in the image (and that aren’t JR1) are scattered light from a nearby bright star. LORRI isn’t that big of a telescope – just a little bit smaller than an 8-inch Schmidt-Cassegrain an amateur astronomer would use – so it’s easy for scattered light to bounce around inside the telescope and cause artifacts like these.

New Horizons’ “deep” observations of JR1, from April 2016. Credits: NASA/JHUAPL/SwRI

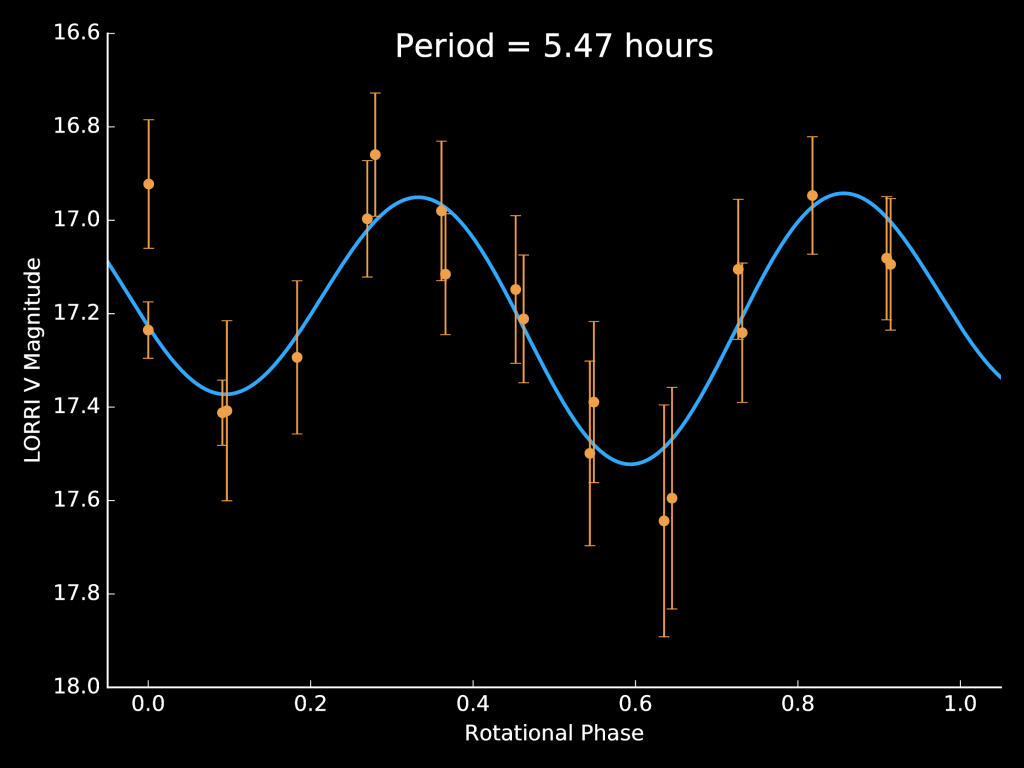
The next sets of observations were to see how the brightness of JR1 changed over time. The first was a sequence of nine sets of three images, spaced half an hour apart, while the second was similar, but an hour apart. We got the half-hour sequence down first and were thrilled to see that it looked like a sine wave! If you are looking an elongated object (say, a tennis shoe) on the side and then turn it to look at the front, the apparent size of the object, from your view, will go down. Turn it back to the side and the apparent size goes up again. Now imagine the shoe is a thousand miles away and someone is turning the shoe for you. You wouldn’t see the shape of the shoe change (because it’s just a point of light), but the brightness of the shoe would change because it can reflect more light to you when you see the side than when you see the front. Making measurements like that is called making a lightcurve. When we do that, we see the brightness of asteroids, KBOs and moons change and we can infer what their shape must be, without actually ever having seen them up close.

The second, longer set of images confirmed this variation and allowed us to determine the rotational period of JR1 was 5.47 hours—something that had ever before been measured. That’s pretty fast for a KBO this size, most of which spin at half this speed. Unlike asteroids, the sun is too far from KBOs to spin them up with solar radiation, so KBO spins mostly record the collisions that they have had with other KBOs. Since JR1 is spinning so fast, it probably had a pretty big glancing impact at some time in its distant past.

The lightcurve of JR1. Credits: NASA/JHUAPL/SwRI

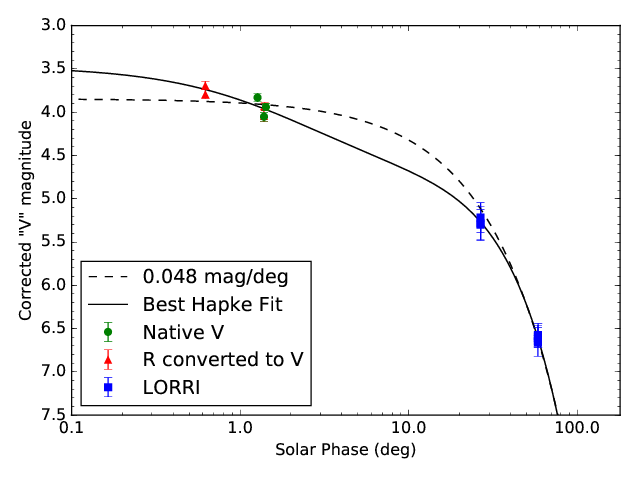
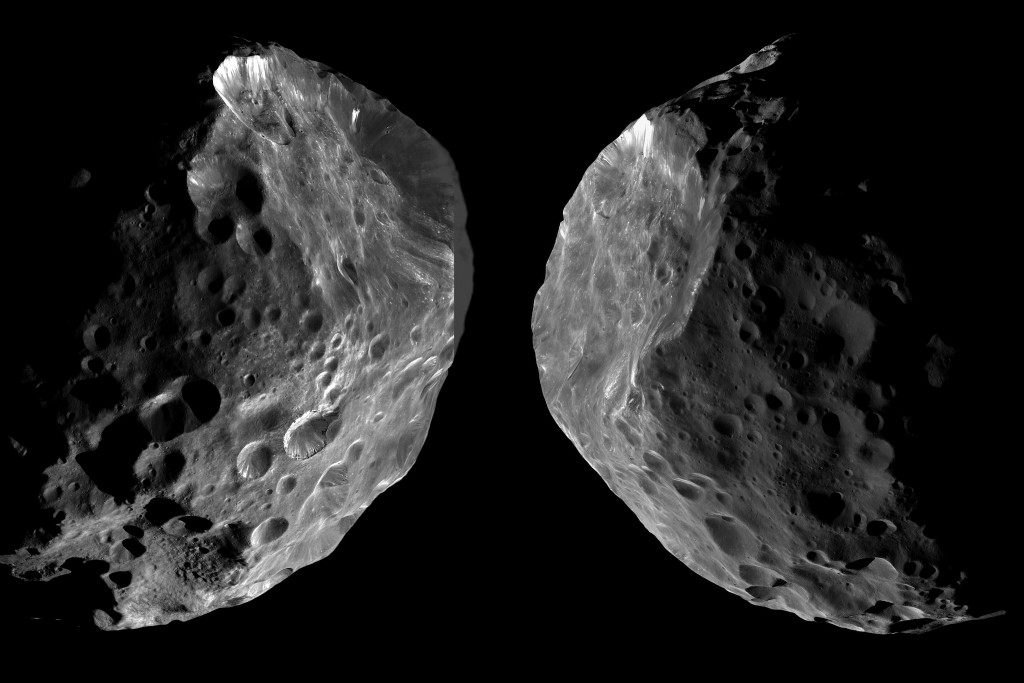
Lightcurves and deep images could be taken with Earth-based telescopes, but what no telescope other than LORRI could do is see a KBO from the side. From the KBO’s perspective, Earth is always a few degrees away from the sun, which means that from Earth we always see KBOs at high noon, with no shadows. From a spacecraft in the Kuiper Belt (like New Horizons), we can look at different times of JR1’s day. The November observations of JR1 were either late morning or early afternoon (we don’t know, because we don’t know if JR1’s pole points up or down). The April observations were at either early morning or in the late evening on JR1. Both of these times should have had shadows on the surface, especially the April observation. Sure enough, when we put all the brightnesses together in a time series, we found that there was enough dimming from shadows that the surface must be at least as rugged as Saturn’s rough-surfaced moon Phoebe. This makes sense, as Phoebe is thought by some to be a captured KBO, and is therefore probably our best guess for what (15810) 1994 JR1 looks like.

The brightness of JR1 from Earth (red and green) and New Horizons (blue). Credits: Porter et al 2015, under review


Saturn’s moon Phoebe may be similar to JR1. Credits: NASA/JPL-Caltech/SSI

Finally, our April observations were the closest-ever of a KBO (other than Pluto), and we used that fact to refine the orbit of JR1. From Earth, we can predict the motion of a KBO as seen from Earth very well, but can’t as well predict how far away it is. Because the New Horizons observations were taken at a very different angle to how the Earth sees JR1, we were able to drop the uncertainty of how far JR1 is from the sun (and thus Earth) from around 60,000 miles (100,000 kilometers) to around 600 miles (just under 1,000 kilometers). That’s a huge improvement in JR1’s orbit, and should enable other astronomers to predict when JR1 will go in front of stars, a measurement we call an “occultation” (from the Latin word for “hidden”). Observing an occultation of JR1 would allow a measurement of both its size and shape.

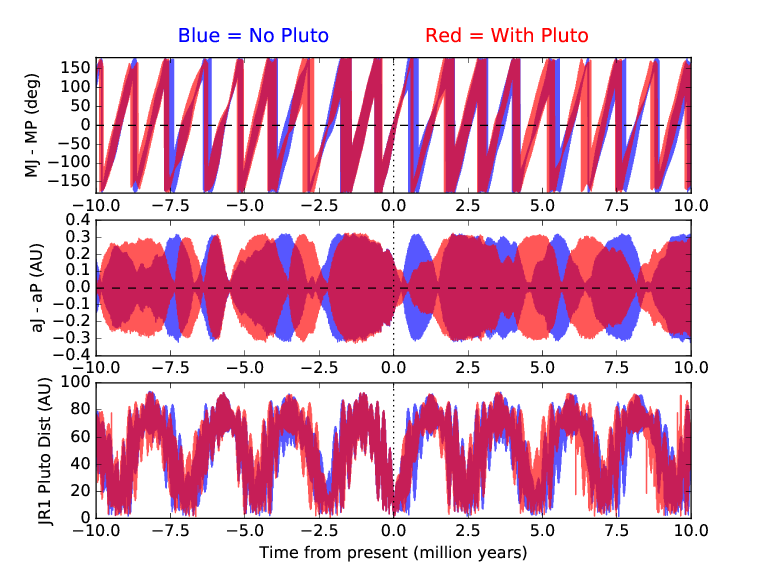
Having this high-precision orbit in hand also allowed us to make a computer simulation of what JR1’s orbit will do in the future, and did in the past. JR1 is a “plutino” (pseudo-Italian for “little Pluto”) because, like Pluto, it goes around the sun three times for every two times that Neptune goes around the sun. In fact, JR1 is only 2.7 astronomical units (AU) away from Pluto – an AU being the average distance between the sun and Earth, about 93 million miles (or 149 million kilometers) – which is pretty close on outer system scales (it’s 35.5 AU from the sun).  However, the orbits of Pluto and JR1 are different enough that this close encounter is cosmically fleeting, only lasting a few hundred thousand years, and not coming together again for another 2.4 million years. Pluto does have a gravitational effect on the orbit of JR1, but it’s mainly to add a bit of chaos into JR1’s orbit, causing it to be unpredictable over timescales longer than about ten million years (again pretty short, cosmically speaking).

The orbit of JR1 compared to Pluto’s orbit with Pluto perturbing JR1 (red) and without (blue). Credits: Porter et al, 2015, under review

The primary mission of New Horizons will end this year, when it is finished downloading all the data from the Pluto system. NASA is currently deciding whether or not to approve an extended mission for New Horizons to do a close (within 6,000 miles or 10,000 kilometers) flyby of a KBO even smaller than JR1. If approved, this would also enable New Horizons to observe dozen more KBOs in a similar way to JR1.

Behind the Lens at New Horizons’ Pluto Flyby

Today’s blog is from Henry Throop, a New Horizons science team member and senior research scientist with the Planetary Science Institute in Mumbai, India.

In a previous blog post, I wrote about software the New Horizons team used to image Pluto. Here, I’m going to talk about my work photographing the team itself.

We knew that New Horizons would be a historic mission scientifically. But we also knew it was important to document the human side of the encounter—the successes as well as frustrations. Just as we remember Neil Armstrong’s words and the shaky video from the surface of the moon, we knew that our team members’ activities would also form their own historical record.

APL, home of New Horizons mission operations in Laurel, Maryland, arranged for me and five other members of the science team to carry cameras as we worked. We were allowed access to the science working areas and public and press zones (though not mission operations, where flight controllers actually command the spacecraft).

While I’ve spent years photographing around the world, there was nothing more exciting than to point my camera at my friends and colleagues on this epic journey to the frontier of the solar system. Below are some of my favorite images.

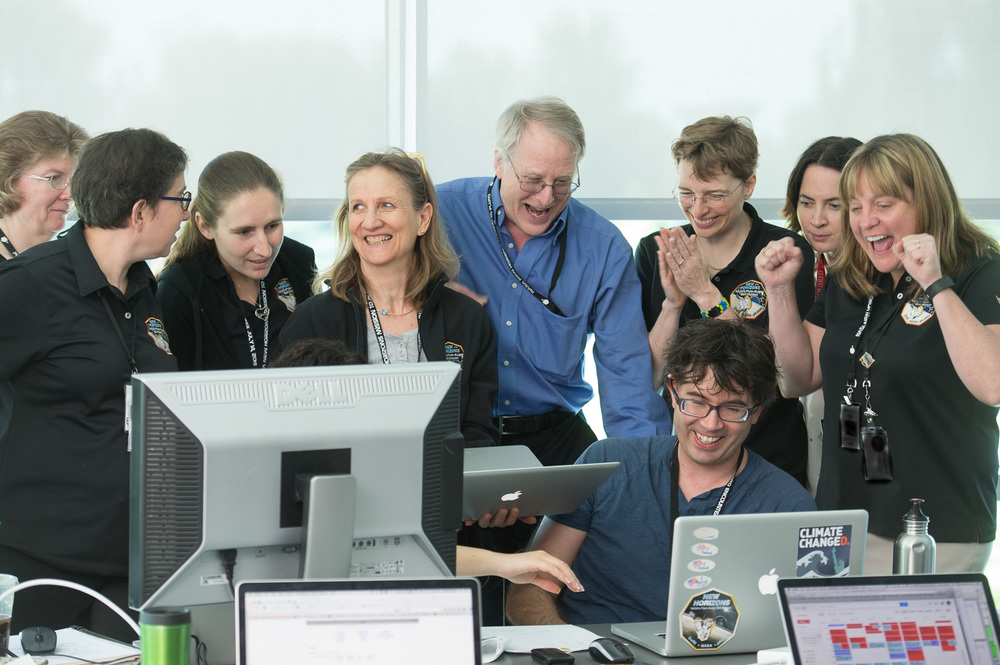
Members of the Composition team compare their three independent analyses of the spectrum, which showed the very first detection of water ice.
Credits: NASA/JHUAPL/SwRI/Henry Throop

Although New Horizons had been in flight for over nine years, it was only two weeks before the Pluto encounter that we first detected Pluto with LEISA, the spacecraft’s near-infrared spectrometer. In the image above, members of the Composition team compare their three independent analyses of the spectrum, which showed the very first detection of water ice. Why three different models of the same thing? Just like an airplane has multiple altimeters, we wanted to be sure that we weren’t deceived by errors in any one model.

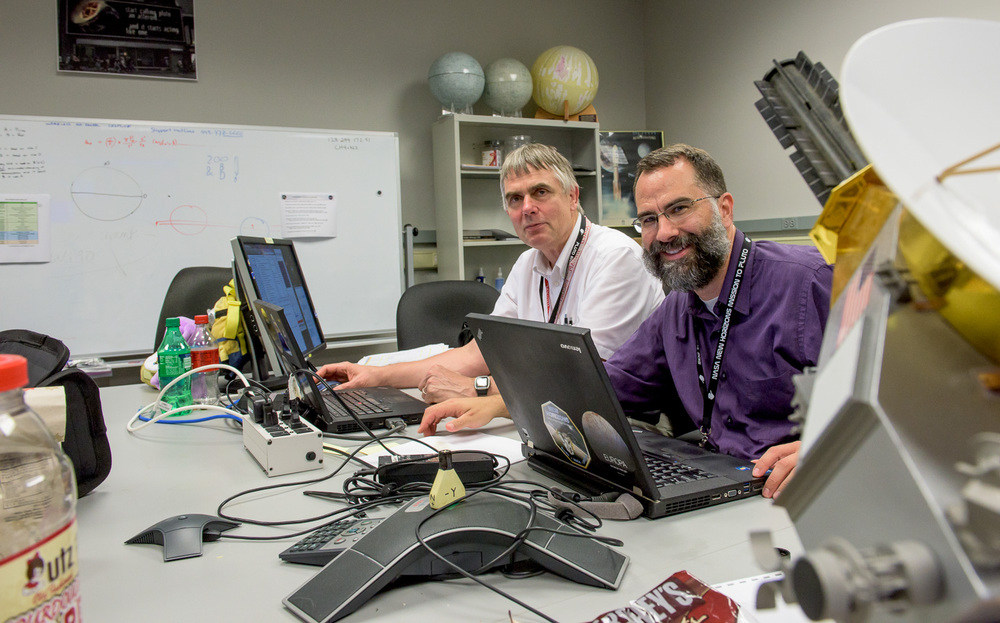
In the Payload Engineering room, shown above, Maarten Versteeg and Tommy Greathouse work with data from the Alice ultraviolet spectrometer
Credits: NASA/JHUAPL/SwRI/Henry Throop

In the Payload Engineering room, shown above, Maarten Versteeg and Tommy Greathouse work with data from the Alice ultraviolet spectrometer. This was taken 36 hours before Pluto close approach, and the instrument had sent back its very first spectrum of Pluto. Up until now, this instrument had been too far from Pluto to detect it.

In addition to the snacks keeping the team going, there are two New Horizons models here. At right is the detailed scale replica. But the more frequently used one is the small yellow model on the speakerphone, marked with the rotational axes we use to point it. A typical observation might be “Point +X toward Pluto, roll -Y to north, and then do a 30-degree scan around -Z.” We used models like this frequently when planning observations.

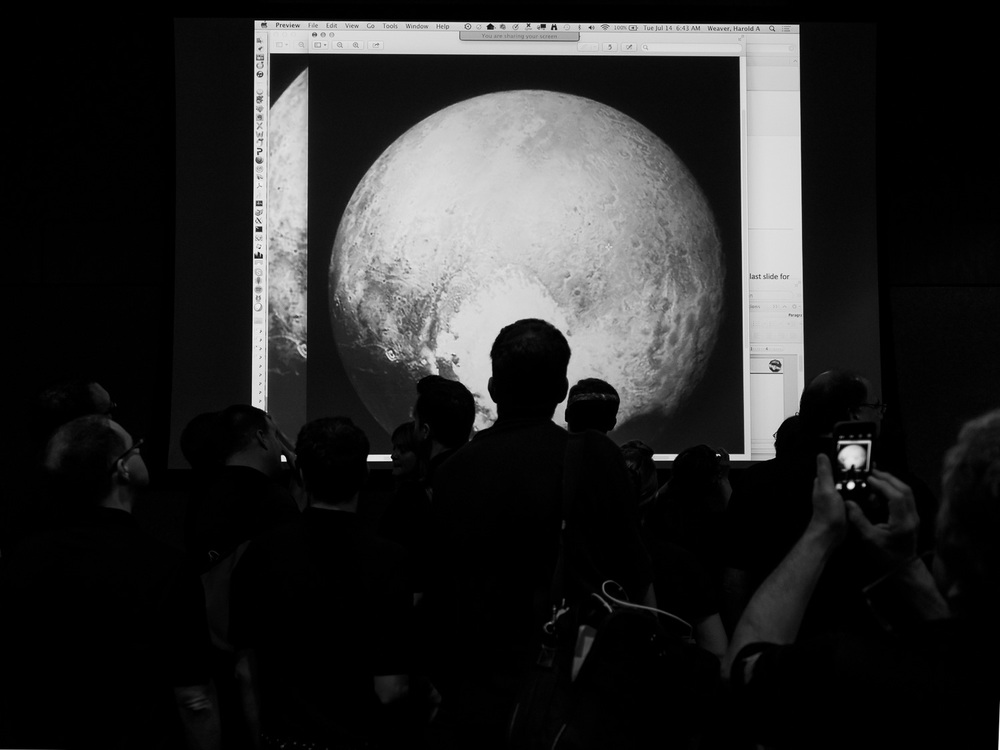
New Horizons team woke up earlier than normal to get our eyes on the highest-resolution global images that had been taken about 14 hours earlier
Credits: NASA/JHUAPL/SwRI/Henry Throop

On the morning of closest approach to Pluto on July 14, 2015, the New Horizons team woke up earlier than normal so we could get our eyes on the highest-resolution “global” images that had been taken about 14 hours earlier. Two members of the team worked overnight to process them in time for our team meeting at 5 a.m.

In the above photo, members of the science team see the young and un-cratered “heart” of the informally named Sputnik Planum close-up for the first time.

“phone home” signal was to be received around 8:52 p.m. EDT and was the emotional highlight of the encounter.
Credits: NASA/JHUAPL/SwRI/Henry Throop

On the day of encounter, New Horizons was busy observing Pluto, except for one short break to transmit a status update to the nervous team on Earth. This “phone home” signal was to be received around 8:52 p.m. EDT and was the emotional highlight of the encounter.

Setting up a few shots of the signal’s arrival, I was focused on my colleagues (in the black shirts above the railing), and I didn’t pay much attention to the man in the suit below them. But that is NASA’s Senior Public Affairs Officer Dwayne Brown, and it was his reaction that really made this shot!

Charon was discovered in 1978 by Jim Christy. Christy suggested the name “Charon” – but he pronounces it with a soft “Sh” instead of a hard “K,” in reference to his wife, Charlene.
Credits: NASA/JHUAPL/SwRI/Henry Throop

A day after flyby, we received new images of Pluto’s largest moon, Charon. Charon was discovered in 1978 by Jim Christy. Christy suggested the name “Charon” – but he pronounces it with a soft “Sh” instead of a hard “K,” in reference to his wife, Charlene.

Jim and Charlene were at the front of the APL auditorium as the images were revealed. While Jim watched quietly, Charlene was taking photos of it all – she told me she was e-mailing them to her family as fast as she could.

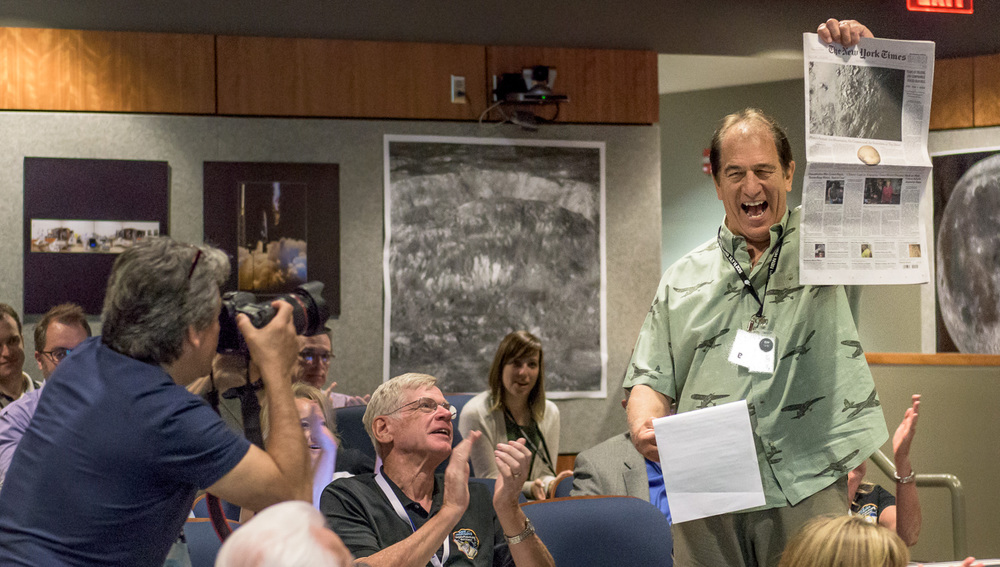
David Aguilar reacts to our front-page New York Times coverage on July 16, 2015.
Credits: NASA/JHUAPL/SwRI/Henry Throop

Our daily 8 a.m. science results meetings would often include an update on media coverage from David Aguilar, who led the team of writers assisting the science and public affairs teams with news and image releases. Here he reacts to our front-page New York Times coverage on July 16, 2015.

Over the course of seven weeks, I took close to 10,000 photos. I’m grateful to APL and the mission for allowing us to document our extraordinary time exploring Pluto—both from afar, and here on Earth.

Henry Throop
Henry Throop
Credit: Michael Soluri


A Picture of Pluto is Worth a Thousand Words

Today’s blog is from Veronica Bray, a planetary scientist at the Lunar and Planetary Laboratory in Tucson. She specializes in comparing the surfaces of planetary bodies across the solar system, especially through the study of impact craters.

A spacecraft flies to Pluto, amazing images of this alien disk are sent back to Earth for us to enjoy, and suddenly scientists are telling us about what Pluto is made of—that it has different layers in its crust, that one part of the Pluto crust is weaker or stronger, or older or younger than another. How can that information be gained from photos?

Well, in part the answer is that many other kinds of data—like compositional and atmospheric spectra – were also obtained, but this blog post gives one example of how the New Horizons team is using the spectacular images to investigate the surface of Pluto. As my specialty is impact cratering, you know what I’ll be talking about.

When a comet or other object collides with Pluto, the speed of the impact is typically faster than a bullet. As a result, such collisions create an explosion that excavates a large hole in the surfacean impact crater. Depending on the size, speed and density of the impactor, as well as the near-surface properties of Pluto, the resultant craters can look very different from one another. As part of my work with the New Horizons team, I have been using the study of impact craters as a tool for investigating the physical properties of the Plutonian crust. I do this first by measuring the dimensions of different craters on Pluto from the Digital Terrain Models (DTMs), created from New Horizons images by my awesome team members! The figure below shows a topographic profile of the informally-named Elliot crater, whose namesake is the late Pluto researcher Jim Elliot of MIT.

Topographic profile, taken from a preliminary digital terrain model, with crater dimension marked
A) New Horizons image of Elliot crater, a ~ 56-mile (90-kilometer) crater in the informally-named Cthulhu region. The yellow line marks the path along which a topographic profile was drawn, from X to X’.
B) Topographic profile, taken from a preliminary digital terrain model, with crater dimension marked. D = crater rim-to-rim diameter, d=crater depth from rim tip to floor, Dp = width of central peak, Hp = height of central peak. The average crater wall slope, S, is calculated as d/W. Credits: Created by Veronica Bray using a profile from New Horizons’ Paul Schenk and New Horizons imagery from NASA/JHUAPL/SwRI

From this profile I can measure all the important dimensions, including:

Depth (d) and Diameter (D).   When measuring a newly formed crater, a lower depth/diameter ratio can point to a weaker or warmer target surface. The depth/diameter value (and the other crater dimensions listed below) is also affected by the gravity of the target body and the age of the crater, as craters tend to shallow with time. So, depth/diameter can also be used to gauge the relative age of the different craters on Pluto.

  1. The central peak height (Hp) and width (Dp). These can tell us about how much uplift of material from depth has occurred at the impact site. When I compare this ratio to the uplifts seen in other craters across the solar system, I can tell whether the Pluto near sub-surface is weaker or stronger than on other bodies. I can also compare central peak craters across Pluto: two craters of the same size with different central peaks might be telling me that the one with the larger peak was formed by a higher velocity impact, or that the Pluto surface is weaker or warmer in that location.
  2. The height of crater rims (measured from the surrounding terrain level). This offers indirect evidence of the extent of crater wall collapse. When comparing two craters of the same diameter, a lower rim height suggests that more collapse has occurred and might point towards the upper levels of the Pluto crust in that area being weaker than for areas with greater rim heights.
  3. The average slope angle (d/W). Although the walls of craters can be complicated, including scarps, terraces and scree slopes segments (all of which can provide their own information on the material strength and target structure), we can also gain knowledge from a more simple measurement: the average slope angle, as it is a proxy for the ‘effective’ coefficient of friction during the process of impact crater formation.
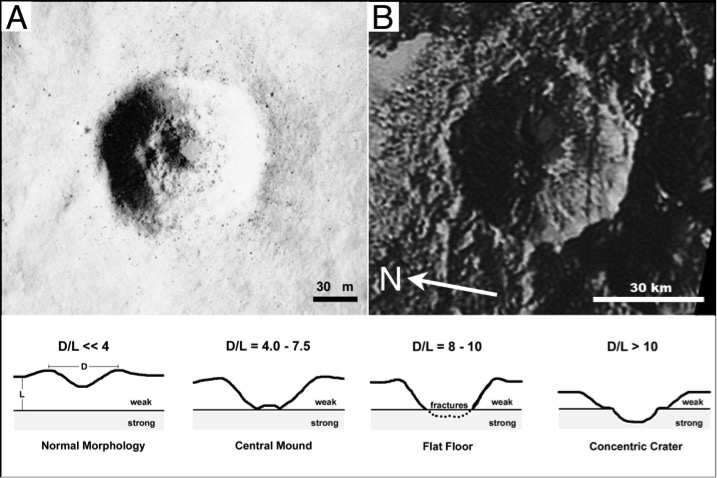
  4. Crater Diameter of ‘benched craters’ can be used to estimate the thickness of layers – as seen in the figure below – within the Pluto crust. This is an especially exciting crater dimension to study as it gives a specific value – the upper layer thickness. We can then start to hypothesize on why this layering is there. Is it deposition from the atmosphere, snowing down on the surface? Is it bombardment from the solar wind breaking down the upper layer of the crust to make a regolith, like we see on the moon?
New Horizons image of a possible nested crater on Pluto
A) Image of a mile (1.2 kilometer) simple crater on Earth’s moon. The wide bench on its interior wall has been used to infer that the moon’s surface in this area consists of a weak layer about miles (100 meters) thick, overlying a more resistant rock unit. Credit: Apollo Panoramic Photograph AS15-9287 B) New Horizons image of a possible nested crater on Pluto. This image has been reoriented so that the shadows within the crater are similar to the lunar example. North arrow indicates direction to the Pluto north pole. Lower row: Sketches of different crater morphologies produced when the ratio of crater diameter and the thickness of the upper weak layer changes. (From Melosh, 1996; after Quaide and Oberbeck, 1968). Credits: Created by Veronica Bray using an Apollo Panoramic photograph, a New Horizons image and diagrams from NASA/JHUAPL/SwRI

I’m currently measuring crater dimensions on Pluto and other icy bodies so that I can compare them to one another and also to existing measurements of craters on rocky bodies such as Earth’s moon. Once I have these measurements and the topographic profiles in hand, I can also use them to compare to my computer modelling results in which I simulate the impact process in various targets (different materials, different sets of layers, whatever I want). There are thousands of craters on Pluto waiting for me to measure them. I’d better get started!

If you would like to read more about how to use impact crater measurements to study the surfaces of moons and planets, I suggest the following references:

Bray, V. J., G. S. Collins, J. V. Morgan and P. M. Schenk (2008). The Effect of Target Properties on Crater Morphology: Comparison of Central Peak Craters on the Moon and Ganymede, Meteoritics and Planetary Science, Vol. 43, No. 12, pp. 1979-1992. PDF Here

Quaide, W. L. and Oberbeck, V. R. 1968. Thickness determinations of the lunar surface layer from lunar impact craters. J. Geophys. Res. 73:5247-5270. PDF Here.

Osinski, G. R. and Pierazzo, E. (2012). Impact cratering: Processes and Products. ISBN: 978-1-4051-9829-5, 330 pages, Published December 2012, Wiley-Blackwell.

Melosh, H. J. 1989 Impact cratering: a geologic process. 245 pages, Oxford University Press.

Veronica Bray
Veronica Bray
Credit: Ken Sterns

Probing the Mysterious Glacial Flow on Pluto’s Frozen ‘Heart’

“Since its discovery, Pluto has proven consistently troublesome to the theorist.”
– Sir Patrick Moore, The Observer’s Book of Astronomy (1971)

Written 45 years ago, these words are more appropriate today than Moore could have ever imagined. Greetings, I’m Dr. Orkan Umurhan, a scientist on New Horizons’ Geology and Geophysics Investigation (GGI) Team.

Pluto’s surface geology alone – from the bladed terrain of Tartarus Dorsa to the mysterious dark mound of Morgoth Macula (just to mention a few informally named features with perplexing geologies) – continues to stump all of us on the New Horizons Geology and Geophysics Investigation (GGI) team.

Over the last month, I’ve been examining numerous theoretical and modeling questions to attempt to explain the processes at work within Pluto’s frozen plains, known as Sputnik Planum (SP). In a separate, yet parallel vein, I’m also studying the nature of glacial flows onto SP from the highlands bordering its eastern shoreline. In this blog, I will talk about the glacial flow problem.

First, let’s look at some pictures of glacial flow on Pluto’s frozen plains.

A nearly top-down view of Pluto’s icy plains
A nearly top-down view of Pluto’s icy plains, showing dark lanes reminiscent of glacial moraines. Credits: NASA/JHUAPL/SwRI
Flow patterns from the lower right of the image, extending to the center of Pluto’s informally-named Sputnik Planum.
This low incidence angle indicates flow patterns from the lower right of the image, extending to the center of Pluto’s informally-named Sputnik Planum. Credits: NASA/JHUAPL/SwRI

These are two views of the same part of the eastern side of SP—one is a nearly overhead snapshot, while the other one is a very low-incidence angle image, dramatically displaying the relief of the landscape. In the overhead image you can see dark streaks emanating from the right leading onto the open plane tracing a lobate pattern – kind of like hot wax moving down an inclined plane. The dark materials are reminiscent of glacial moraines seen on Earth, but because this is Pluto, we have no idea what this dark material is, and whether or not the patterns we see are indeed moraines in the traditional terrestrial sense.

However, we do know what our colleagues on the New Horizons Composition team tell us: they have pretty solidly (ahem!) determined that the surface material on and in the near vicinity of SP is mainly made up of nitrogen, carbon monoxide, and methane ices, although their relative proportions are not yet determined.

In my initial considerations, I assume the flowing material is made of mostly nitrogen with some carbon monoxide, both of which have similar molecular bond structures. Based on what little lab work has been done on their properties under cold temperatures characteristic of Pluto’s surface (-390 degrees Fahrenheit or 38 Kelvin), these volatiles ought to flow more slowly than silly putty, but much faster than glacial water ice on Earth.

The response timescales appropriate for these volatiles with the scale and relief of the highlands seen around Sputnik Planum leads us to the geophysical insight that these high relief structures (icy mountains) are probably not made up of any of these pure volatile ices, because they would have flattened out a long time ago. Instead, we speculate that the highlands are more likely made of a very strong structurally rigid water ice “bedrock” covered by a very thin coating of nitrogen and/or carbon monoxide ice.

This is where I come in: I fold all of this laboratory information about the volatile ices, as well as various geophysical insights into a numerical simulation platform I built a year ago that models glacial flow. This tool is used to examine various scientific hypotheses from me and other members of the geology team.

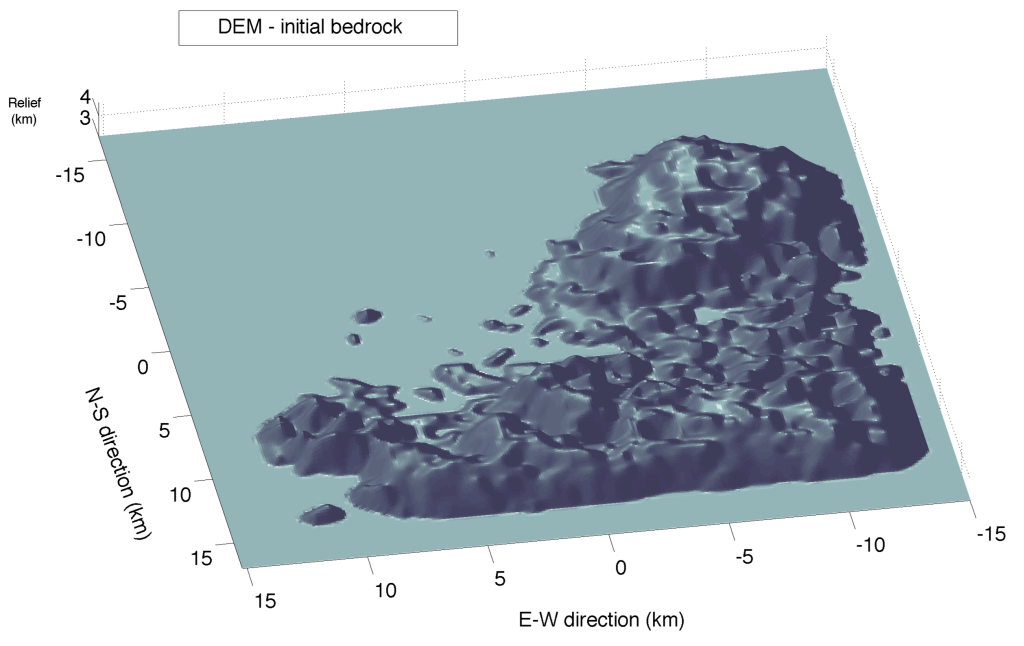
Digital Elevation Model (DEM)
Credits: Paul Schenk, Ross Beyer and Orkan Umurhan

For example, one task is to examine possible scenarios explaining how the observed lobate pattern (think hot wax) comes about, and whether or not a nitrogen glacial model can explain what we see. To accomplish this, I start with a Digital Elevation Model (DEM) seen above, using stereo imaging of Pluto’s surface with vertical relief on the order of .6 miles (1 kilometer). I use this model as my bedrock surface—then I add nitrogen ice and study the response.

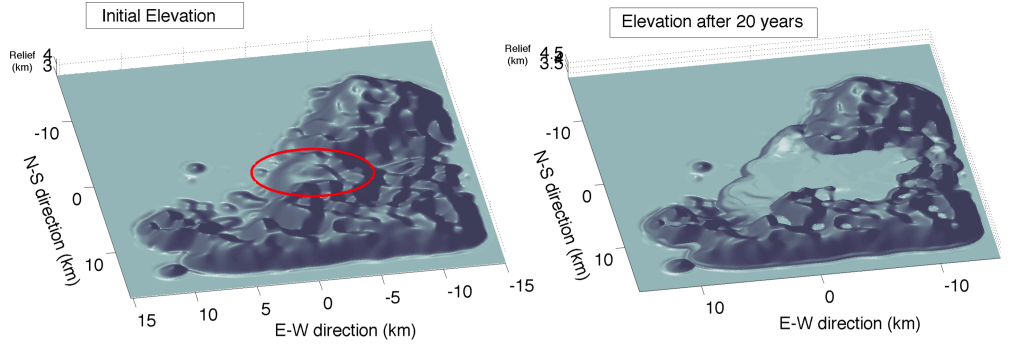
Stereo imaging of Pluto’s surface with vertical relief on the order of .6 miles
Credits: Orkan Umurhan

To show you an example of the kind of response the model can exhibit, consider the figure above, where I take this surface bedrock and add glacial nitrogen ice, indicated by the red ellipse on the left figure. To this model I also add a feature representing the uniform accumulation of deposited nitrogen ice, in the amount of about one yard (one meter) per year. The outflow state is shown in the right panel. In this artificial example, I have put in nearly 400 yards (400 meters) of ice inside the circled red region. The final flow state – including nice frontal lobes – gets there in about 20 Earth years. This is fast! You can also see accumulation of nitrogen ice inside of craters; this is because the steady deposition of ice also runs down steep-sided slopes and collects inside.

In understanding complex Pluto, progress is slow, but we are making progress. Stick around for the next installment of my blog, in about a month, when I will have more cool results!

Orkan Umurhan
Orkan Umurhan

Pluto through a Stained Glass Window: a Movie from the Edge of Our Solar System

Today’s post is written by Alex Parker, a research scientist at the Southwest Research Institute in Boulder, Colorado, working on NASA’s New Horizons mission.

As New Horizons flew by Pluto, it recorded spectacular images of the icy world’s surface using the LORRI and MVIC cameras. It recorded the plasma and dust environments with the PEPSSI, SWAP, and SDC instruments. But one instrument, designed to measure the composition of Pluto and Charon’s surfaces, did something you might not expect: it recorded the first movies from the edge of our solar system.

Recorded with a 256 x 256 pixel camera at under two frames per second, they are not exactly HDTV. However, they are movies. And they are in color. Sort of.

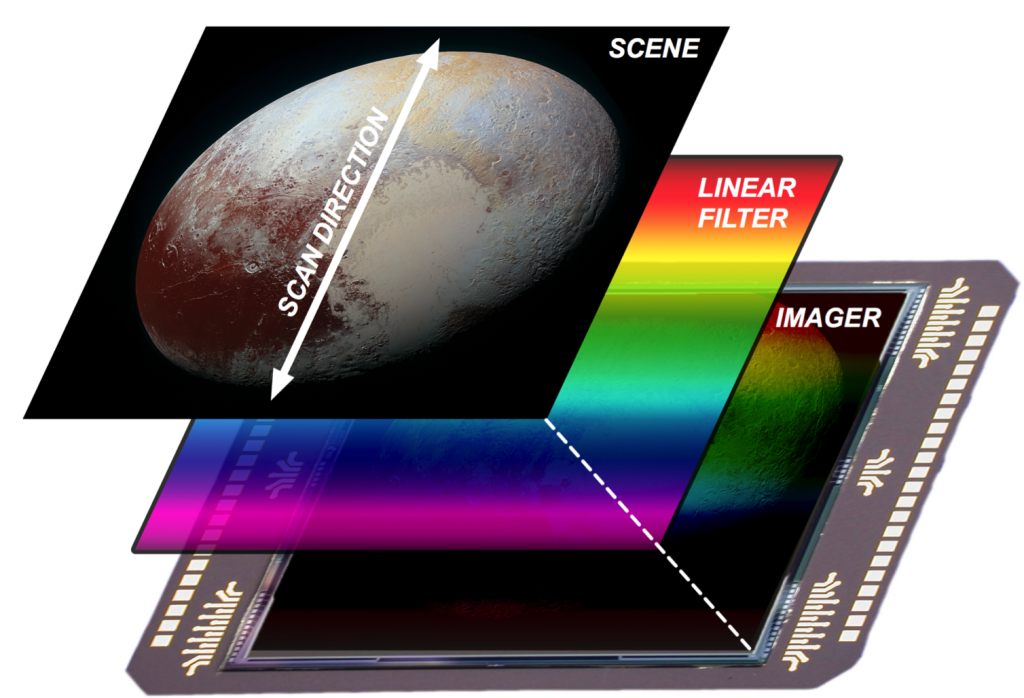
The instrument is LEISA, New Horizons’ infrared imaging spectrometer. It is an extremely clever instrument; it takes 2-D images just like a normal camera, but it takes them through a linearly-varying filter. One side of the camera can only see light of one specific wavelength of infrared light (light that has longer wavelengths than can be seen by our eyes), and each row of pixels can see a subtly different wavelength.

This linear filter allows light with wavelengths as short as 1.25 microns (a micron is one millionth of a meter; human eyes can perceive light with wavelengths as short as 0.39 microns to long as 0.7 microns) to fall on one side of the image sensor, and smoothly changes to allow light with wavelengths as long as 2.5 microns to fall on the far side of image sensor. This wavelength range was selected because many ices and other materials that exist on the surface of Pluto that have spectral features in this wavelength range that can uniquely identify them, like a fingerprint. We use this instrument to map the distribution of these ices and other materials across Pluto and its moons. A second linear filter to one side of the imager is designed to provide a finer measurement of the spectrum in a region of particular interest between wavelengths of 2.1 to 2.25 microns.

A simplified schematic of the how the LEISA instrument works
Figure 1: A simplified schematic of the how the LEISA instrument works. As the scene (in this case, Pluto) moves by along the scan direction, the imager records many frames of video in sequence, imaging each part of Pluto though each segment of the linear filter and building up a spectral map of the entire object. Credits: NASA/JHUAPL/SwRI/Alex Parker

The effect is much like looking through a stained glass window designed for infrared eyes. By scanning this image sensor with its linear filter across a scene and quickly recording many images during the scan (like a movie), LEISA builds up a two-dimensional map of the scene in front of the camera with a measurement of the infrared spectrum (the brightness versus wavelength) at every location in the image. It makes this complex measurement with exactly zero moving parts — highly reliable for deep-space operations.

The side-effect of collecting this scientifically-important data set, capable of measuring the composition of every location on the surface of Pluto and Charon that is imaged, is that LEISA collected low frame rate infrared color movies of Pluto and Charon as seen by New Horizons during its flyby.

Pluto Through Stained Glass: A Movie from the Edge of the Solar System. This colorful movie drifting across Pluto by was recorded by New Horizons’ LEISA infrared imaging spectrometer during the July 14 closest approach. The movie has been sped up approximately 17 times from its raw frame rate, and the infrared colors that LEISA sees have been translated into visual colors. Credits: NASA/JHUAPL/SwRI/Alex Parker

The animation shown here is one such movie collected by New Horizons during its flyby of Pluto. Each pixel is colored to show the relative wavelength of light that each pixel was allowed to see by LEISA’s linear filter. However, since LEISA sees in infrared light, the colors LEISA can see have been re-mapped for this video onto the human visual spectrum — the rainbow. The video has been sped up from its raw frame rate to show the motion smoothly.

In this animation, Pluto drifts by outside the spacecraft as New Horizons scans LEISA across the surface. As Pluto slides beneath the camera, you can see it nod back and forth from the top of the frame to the bottom — these changes in direction are due to New Horizons thrusters firing during the recording of the movie.

This is what you would have actually seen if you were on board the New Horizons spacecraft on July 14, looking out at Pluto through a stained glass window with infrared eyes.

The composition of Pluto makes itself apparent in the animation. Dark bands top-to-bottom correspond to absorption by specific chemicals on the surface of Pluto; many of the bands visible in this view are due to absorption from solid methane ice. However, as some terrains slide by, you can see that they do not become dark under those bands like other terrains; in these areas, the chemical responsible for that absorption is absent.

The discovery of water ice on Pluto was made using the data in this movie. The discovery of ammonia ice within the informally-named Organa crater was made using data from a similar movie of Charon. The New Horizons composition team is busy analyzing these and other movies taken by the LEISA instrument in order to further understand what the surface of Pluto and Charon are made of and how they might be changing with time.

But please — just take a moment and imagine you were on board our little robotic emissary to the farthest worlds ever explored, watching Pluto come into view through a colorful window on the side of the spacecraft. Sure, it might not be in HD, but I promise that you’ve never seen anything like this before!

Alex Parker
Alex Parker

Where Math Meets Pluto

Greetings and Salutations!   I’m Dr. Orkan Umurhan, a scientist on New Horizons’ Geology and Geophysics Investigation (GGI) Team.  This is my first blog entry about my experiences on this most excellent mission. Over the upcoming months and years I intend to share the scientific questions I work on pertaining to New Horizons, and I hope that you will find them as fascinating as I do.

But first, a little about myself:  Although I’m on the GGI Team, I actually have a background in astrophysics with particular emphasis on astrophysical flows. I’ve done a lot of work on turbulence in protoplanetary disk environments, the very places where planets are known to form and grow. I have a lot of experience with extracting physical insights from complex flows. I really see myself more as a mathematical physicist. Some of my colleagues jokingly refer to me as the team’s “applied math mercenary,” a description that is not too far from the truth.

Just over two years ago, I was invited to join the New Horizons science team—probably being the last person to board the mission. While being both thrilled and honored to be involved, I wondered about how a scientist like me, who then knew very little about geology (rocks are hard!), could contribute in a scientifically meaningful way to the mission. The answer I received from both Alan Stern (our fearless captain and leader) and Jeff Moore (GGI Team lead, aka “Our GGI Platoon Leader”) is a testament to the uniqueness of this mission, its openness, and the cutting edge manner in which we conduct scientific inquiry.

They explained that the Pluto-Charon system is a place where we expect to see things we’ve never seen before, involving the behavior of ices and (possibly) fluids at temperatures and pressures that have not been adequately examined in the laboratory—nor have they been observed in any natural terrestrial system. Because this was going to be a fresh encounter with Nature, Alan and Jeff explained to me that they were determined to assemble as diverse a scientific team as possible, having a very wide spectrum of viewpoints and expertise on hand to interpret and debate the puzzling and weird things likely to be encountered.

As you probably know, Pluto has turned out to be a spectacular, awesome, active low temperature physics laboratory, full of conundrums and outright weirdness that has kept us all busy, fulltime.

In hindsight, one wonders why we were so surprised. For instance, the triple point (the location on the temperature-pressure phase diagram in which a material can coexist as solid, liquid and gas) of both carbon monoxide and molecular nitrogen is in the vicinity of 63 Kelvin (- 346 Fahrenheit), a temperature that is achievable on Pluto, given its distance from the sun.  We know from the Earth that when a system is near its triple point (as in the case of water), interesting phases can manifest, such as flowing water, glaciers and vapor. This is one of the reasons why the Earth and its surface morphology is such a cool place—no pun intended.

Pluto’s Pattern of Pits
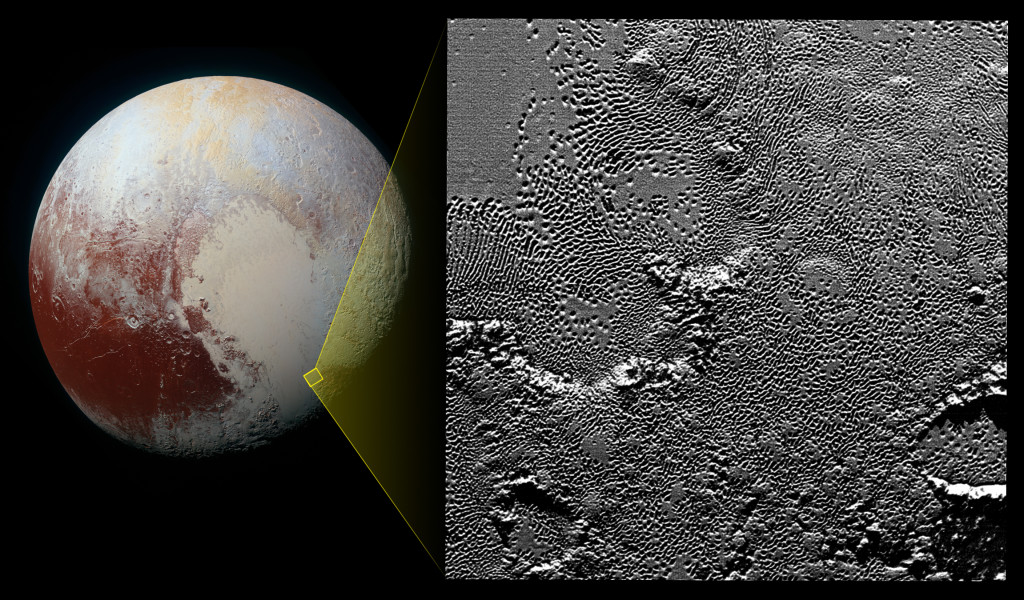
On July 14 the telescopic camera on NASA’s New Horizons spacecraft took the highest resolution images ever obtained of the intricate pattern of “pits” across a section of Pluto’s prominent heart-shaped region, informally named Tombaugh Regio. The image is part of a sequence taken by New Horizons’ Long Range Reconnaissance Imager (LORRI) as the spacecraft passed within 9,550 miles (15,400 kilometers) of Pluto’s surface, just 13 minutes before the time of closest approach.
Credits: NASA/JHUAPL/SwRI

When we look at Pluto we see the informally-named Sputnik Planum (SP), which is probably a giant nitrogen ice sea, with a lot of methane and carbon monoxide to share the space. It has the texture of toothpaste and has flow timescales on the order of dozens of years.  We see in the surrounding mountain ranges evidence of glacier ice flowing into the basin of SP. The ice within the plains appears to be undergoing so-called “solid-state convection,” the overturning of the ice layer because it’s warmer below than above, which causes it to buoyantly rise to the surface. We see perplexing textures that look like pits and worms on various parts of SP, a phenomenon possibly due to the strong sublimation of nitrogen or possibly even methane. We see globules of glacier ice that look like coagulated jelly in various locations near the glacier flows.

Together with the other geologists and geophysicists in GGI, I work on aspects of all these odd-looking features and facets. I participate in debates over physical interpretation of the things we see but, more importantly, I bring my experience with flow modeling and dynamical evolution and apply them directly to setting up numerical mathematical models in order to evaluate the myriad of hypotheses we conjure up.

I’ll go into detail about some upcoming results in my next blog entry in early 2016, so stay tuned!

Orkan Umurhan
Orkan Umurhan

Plunging through the Solar System’s Dust Disk

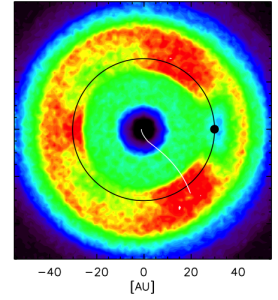
Figure 1. A model of the solar system’s dust disk, formed by grains generated at the Kuiper Belt. Credit: Han et al., 2011

Today’s post is written by Jamey Szalay, a New Horizons graduate student at the University of Colorado Boulder. Jamey just completed his PhD at CU and has accepted a postdoc at SwRI to work on NASA’s next New Frontiers mission, JUNO, which arrives at Jupiter on July 4, 2016.

For the last five and a half years, I’ve worked on the Student Dust Counter (SDC) instrument onboard New Horizons. SDC was the first student designed, built, and operated scientific instrument to travel aboard an interplanetary NASA mission. Working on SDC has been an incredibly rewarding experience.

SDC works a bit differently than the rest of the instruments aboard New Horizons. While the principal investigator, Professor Mihaly Horanyi of the University of Colorado, is ultimately responsible for the project, SDC is a student-run instrument. As such, the day-to-day operations are actually handled by graduate students. During the design and build phase of the instrument, the SDC team consisted of about 20-30 undergrad and grad students. Once our team delivered SDC to the spacecraft and launched, the team size was significantly reduced, down to one lead graduate student and one grad student trainee. I inherited the position from Andrew Poppe, the lead before me, and have now passed the torch on to Marcus Piquette, the current SDC instrument lead.

Our job has been to maintain the health and safety of the instrument, to be responsible for operating it year in and year out, and perform the scientific analysis once the data is returned to the ground. Even as students, we also represented SDC at all the New Horizons team meetings and we were expected to present at the level of a professional scientist. What an invaluable experience it has been!

Not only has SDC pioneered a new kind of student involvement in a NASA mission, we’ve also been able to do some truly groundbreaking science. It turns out the solar system has a dust disk that extends out from near the sun all the way to the Kuiper Belt, and possibly beyond. Past Jupiter, this dust disk is comprised of material primarily shed from Kuiper Belt objects. Were an observer to be very far from our solar system, he or she wouldn’t see all the planets orbiting our sun—they would be too faint. Instead, an observer would see our solar system’s dust disk. Figure 1 shows a model of what our own solar system’s disk may look like.

As of late 2010, when it passed a distance of 18 AU (1.7 billion miles or 2.7 billion kilometers), SDC became the farthest reaching dust impact detector in history! SDC is bolted on the ‘windshield’ of New Horizons, so to speak, such that dust particles smash into it as the spacecraft transits the solar system. As SDC plunges through our dust disk, we’ve been able to measure and characterize the dust density distribution from Earth to Pluto, and beyond. With this information, not only can we better understand our solar system, but also help unravel the mysteries of countless other solar systems throughout the observable universe.

I’m very fortunate to have been involved with New Horizons in such a meaningful way by working on the Student Dust Counter team. Leading a student instrument for five years has truly been a unique experience, allowing me to understand the inner workings of a NASA deep space mission from the inside out. We’re thrilled to have reached Pluto and can’t wait to journey into the heart of the Kuiper Belt to learn what’s out there.

Jamey Szalay
Jamey Szalay
Credit: Kyle Cassidy