Pluto through a Stained Glass Window: a Movie from the Edge of Our Solar System

Today’s post is written by Alex Parker, a research scientist at the Southwest Research Institute in Boulder, Colorado, working on NASA’s New Horizons mission.

As New Horizons flew by Pluto, it recorded spectacular images of the icy world’s surface using the LORRI and MVIC cameras. It recorded the plasma and dust environments with the PEPSSI, SWAP, and SDC instruments. But one instrument, designed to measure the composition of Pluto and Charon’s surfaces, did something you might not expect: it recorded the first movies from the edge of our solar system.

Recorded with a 256 x 256 pixel camera at under two frames per second, they are not exactly HDTV. However, they are movies. And they are in color. Sort of.

The instrument is LEISA, New Horizons’ infrared imaging spectrometer. It is an extremely clever instrument; it takes 2-D images just like a normal camera, but it takes them through a linearly-varying filter. One side of the camera can only see light of one specific wavelength of infrared light (light that has longer wavelengths than can be seen by our eyes), and each row of pixels can see a subtly different wavelength.

This linear filter allows light with wavelengths as short as 1.25 microns (a micron is one millionth of a meter; human eyes can perceive light with wavelengths as short as 0.39 microns to long as 0.7 microns) to fall on one side of the image sensor, and smoothly changes to allow light with wavelengths as long as 2.5 microns to fall on the far side of image sensor. This wavelength range was selected because many ices and other materials that exist on the surface of Pluto that have spectral features in this wavelength range that can uniquely identify them, like a fingerprint. We use this instrument to map the distribution of these ices and other materials across Pluto and its moons. A second linear filter to one side of the imager is designed to provide a finer measurement of the spectrum in a region of particular interest between wavelengths of 2.1 to 2.25 microns.
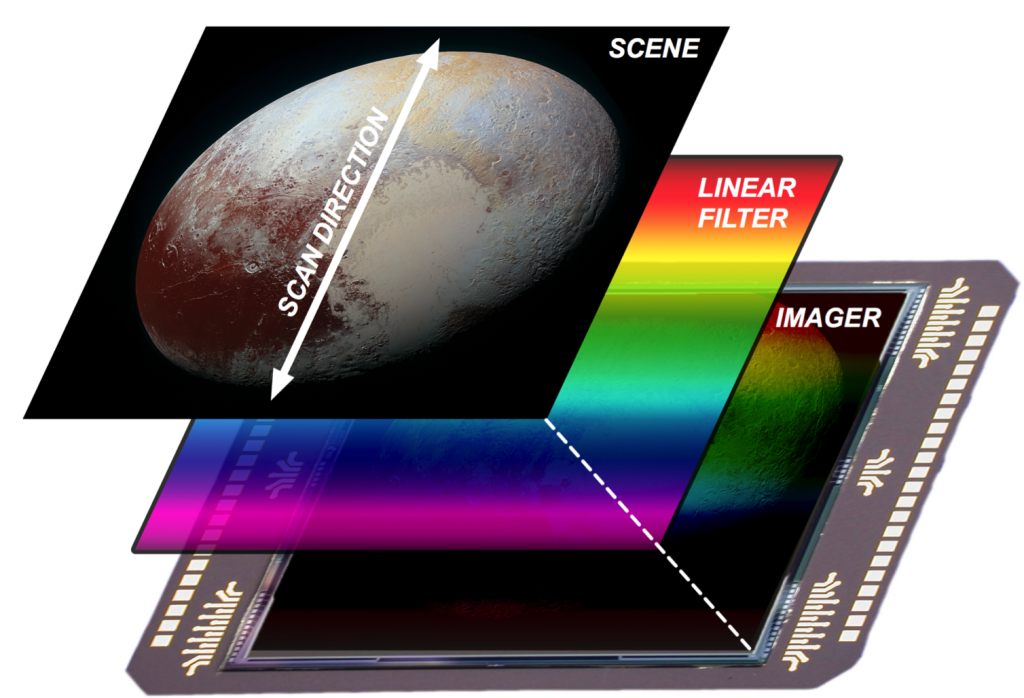
A simplified schematic of the how the LEISA instrument works
Figure 1: A simplified schematic of the how the LEISA instrument works. As the scene (in this case, Pluto) moves by along the scan direction, the imager records many frames of video in sequence, imaging each part of Pluto though each segment of the linear filter and building up a spectral map of the entire object. Credits: NASA/JHUAPL/SwRI/Alex Parker

The effect is much like looking through a stained glass window designed for infrared eyes. By scanning this image sensor with its linear filter across a scene and quickly recording many images during the scan (like a movie), LEISA builds up a two-dimensional map of the scene in front of the camera with a measurement of the infrared spectrum (the brightness versus wavelength) at every location in the image. It makes this complex measurement with exactly zero moving parts — highly reliable for deep-space operations.

The side-effect of collecting this scientifically-important data set, capable of measuring the composition of every location on the surface of Pluto and Charon that is imaged, is that LEISA collected low frame rate infrared color movies of Pluto and Charon as seen by New Horizons during its flyby.

Pluto Through Stained Glass: A Movie from the Edge of the Solar System. This colorful movie drifting across Pluto by was recorded by New Horizons’ LEISA infrared imaging spectrometer during the July 14 closest approach. The movie has been sped up approximately 17 times from its raw frame rate, and the infrared colors that LEISA sees have been translated into visual colors. Credits: NASA/JHUAPL/SwRI/Alex Parker

The animation shown here is one such movie collected by New Horizons during its flyby of Pluto. Each pixel is colored to show the relative wavelength of light that each pixel was allowed to see by LEISA’s linear filter. However, since LEISA sees in infrared light, the colors LEISA can see have been re-mapped for this video onto the human visual spectrum — the rainbow. The video has been sped up from its raw frame rate to show the motion smoothly.

In this animation, Pluto drifts by outside the spacecraft as New Horizons scans LEISA across the surface. As Pluto slides beneath the camera, you can see it nod back and forth from the top of the frame to the bottom — these changes in direction are due to New Horizons thrusters firing during the recording of the movie.

This is what you would have actually seen if you were on board the New Horizons spacecraft on July 14, looking out at Pluto through a stained glass window with infrared eyes.

The composition of Pluto makes itself apparent in the animation. Dark bands top-to-bottom correspond to absorption by specific chemicals on the surface of Pluto; many of the bands visible in this view are due to absorption from solid methane ice. However, as some terrains slide by, you can see that they do not become dark under those bands like other terrains; in these areas, the chemical responsible for that absorption is absent.

The discovery of water ice on Pluto was made using the data in this movie. The discovery of ammonia ice within the informally-named Organa crater was made using data from a similar movie of Charon. The New Horizons composition team is busy analyzing these and other movies taken by the LEISA instrument in order to further understand what the surface of Pluto and Charon are made of and how they might be changing with time.

But please — just take a moment and imagine you were on board our little robotic emissary to the farthest worlds ever explored, watching Pluto come into view through a colorful window on the side of the spacecraft. Sure, it might not be in HD, but I promise that you’ve never seen anything like this before!
Alex Parker
Alex Parker

Where Math Meets Pluto

Greetings and Salutations!   I’m Dr. Orkan Umurhan, a scientist on New Horizons’ Geology and Geophysics Investigation (GGI) Team.  This is my first blog entry about my experiences on this most excellent mission. Over the upcoming months and years I intend to share the scientific questions I work on pertaining to New Horizons, and I hope that you will find them as fascinating as I do.

But first, a little about myself:  Although I’m on the GGI Team, I actually have a background in astrophysics with particular emphasis on astrophysical flows. I’ve done a lot of work on turbulence in protoplanetary disk environments, the very places where planets are known to form and grow. I have a lot of experience with extracting physical insights from complex flows. I really see myself more as a mathematical physicist. Some of my colleagues jokingly refer to me as the team’s “applied math mercenary,” a description that is not too far from the truth.

Just over two years ago, I was invited to join the New Horizons science team—probably being the last person to board the mission. While being both thrilled and honored to be involved, I wondered about how a scientist like me, who then knew very little about geology (rocks are hard!), could contribute in a scientifically meaningful way to the mission. The answer I received from both Alan Stern (our fearless captain and leader) and Jeff Moore (GGI Team lead, aka “Our GGI Platoon Leader”) is a testament to the uniqueness of this mission, its openness, and the cutting edge manner in which we conduct scientific inquiry.

They explained that the Pluto-Charon system is a place where we expect to see things we’ve never seen before, involving the behavior of ices and (possibly) fluids at temperatures and pressures that have not been adequately examined in the laboratory—nor have they been observed in any natural terrestrial system. Because this was going to be a fresh encounter with Nature, Alan and Jeff explained to me that they were determined to assemble as diverse a scientific team as possible, having a very wide spectrum of viewpoints and expertise on hand to interpret and debate the puzzling and weird things likely to be encountered.

As you probably know, Pluto has turned out to be a spectacular, awesome, active low temperature physics laboratory, full of conundrums and outright weirdness that has kept us all busy, fulltime.

In hindsight, one wonders why we were so surprised. For instance, the triple point (the location on the temperature-pressure phase diagram in which a material can coexist as solid, liquid and gas) of both carbon monoxide and molecular nitrogen is in the vicinity of 63 Kelvin (- 346 Fahrenheit), a temperature that is achievable on Pluto, given its distance from the sun.  We know from the Earth that when a system is near its triple point (as in the case of water), interesting phases can manifest, such as flowing water, glaciers and vapor. This is one of the reasons why the Earth and its surface morphology is such a cool place—no pun intended.

Pluto’s Pattern of Pits
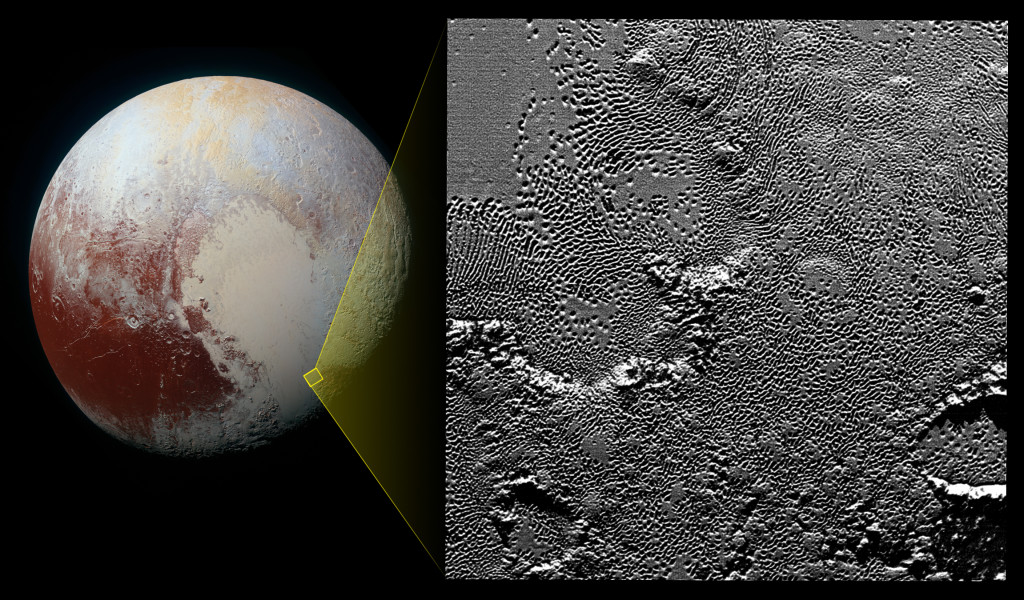
On July 14 the telescopic camera on NASA’s New Horizons spacecraft took the highest resolution images ever obtained of the intricate pattern of “pits” across a section of Pluto’s prominent heart-shaped region, informally named Tombaugh Regio. The image is part of a sequence taken by New Horizons’ Long Range Reconnaissance Imager (LORRI) as the spacecraft passed within 9,550 miles (15,400 kilometers) of Pluto’s surface, just 13 minutes before the time of closest approach.
Credits: NASA/JHUAPL/SwRI

When we look at Pluto we see the informally-named Sputnik Planum (SP), which is probably a giant nitrogen ice sea, with a lot of methane and carbon monoxide to share the space. It has the texture of toothpaste and has flow timescales on the order of dozens of years.  We see in the surrounding mountain ranges evidence of glacier ice flowing into the basin of SP. The ice within the plains appears to be undergoing so-called “solid-state convection,” the overturning of the ice layer because it’s warmer below than above, which causes it to buoyantly rise to the surface. We see perplexing textures that look like pits and worms on various parts of SP, a phenomenon possibly due to the strong sublimation of nitrogen or possibly even methane. We see globules of glacier ice that look like coagulated jelly in various locations near the glacier flows.

Together with the other geologists and geophysicists in GGI, I work on aspects of all these odd-looking features and facets. I participate in debates over physical interpretation of the things we see but, more importantly, I bring my experience with flow modeling and dynamical evolution and apply them directly to setting up numerical mathematical models in order to evaluate the myriad of hypotheses we conjure up.

I’ll go into detail about some upcoming results in my next blog entry in early 2016, so stay tuned!

Orkan Umurhan
Orkan Umurhan

Plunging through the Solar System’s Dust Disk

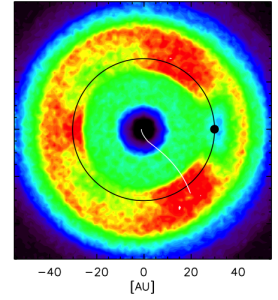
Figure 1. A model of the solar system’s dust disk, formed by grains generated at the Kuiper Belt. Credit: Han et al., 2011

Today’s post is written by Jamey Szalay, a New Horizons graduate student at the University of Colorado Boulder. Jamey just completed his PhD at CU and has accepted a postdoc at SwRI to work on NASA’s next New Frontiers mission, JUNO, which arrives at Jupiter on July 4, 2016.

For the last five and a half years, I’ve worked on the Student Dust Counter (SDC) instrument onboard New Horizons. SDC was the first student designed, built, and operated scientific instrument to travel aboard an interplanetary NASA mission. Working on SDC has been an incredibly rewarding experience.

SDC works a bit differently than the rest of the instruments aboard New Horizons. While the principal investigator, Professor Mihaly Horanyi of the University of Colorado, is ultimately responsible for the project, SDC is a student-run instrument. As such, the day-to-day operations are actually handled by graduate students. During the design and build phase of the instrument, the SDC team consisted of about 20-30 undergrad and grad students. Once our team delivered SDC to the spacecraft and launched, the team size was significantly reduced, down to one lead graduate student and one grad student trainee. I inherited the position from Andrew Poppe, the lead before me, and have now passed the torch on to Marcus Piquette, the current SDC instrument lead.

Our job has been to maintain the health and safety of the instrument, to be responsible for operating it year in and year out, and perform the scientific analysis once the data is returned to the ground. Even as students, we also represented SDC at all the New Horizons team meetings and we were expected to present at the level of a professional scientist. What an invaluable experience it has been!

Not only has SDC pioneered a new kind of student involvement in a NASA mission, we’ve also been able to do some truly groundbreaking science. It turns out the solar system has a dust disk that extends out from near the sun all the way to the Kuiper Belt, and possibly beyond. Past Jupiter, this dust disk is comprised of material primarily shed from Kuiper Belt objects. Were an observer to be very far from our solar system, he or she wouldn’t see all the planets orbiting our sun—they would be too faint. Instead, an observer would see our solar system’s dust disk. Figure 1 shows a model of what our own solar system’s disk may look like.

As of late 2010, when it passed a distance of 18 AU (1.7 billion miles or 2.7 billion kilometers), SDC became the farthest reaching dust impact detector in history! SDC is bolted on the ‘windshield’ of New Horizons, so to speak, such that dust particles smash into it as the spacecraft transits the solar system. As SDC plunges through our dust disk, we’ve been able to measure and characterize the dust density distribution from Earth to Pluto, and beyond. With this information, not only can we better understand our solar system, but also help unravel the mysteries of countless other solar systems throughout the observable universe.

I’m very fortunate to have been involved with New Horizons in such a meaningful way by working on the Student Dust Counter team. Leading a student instrument for five years has truly been a unique experience, allowing me to understand the inner workings of a NASA deep space mission from the inside out. We’re thrilled to have reached Pluto and can’t wait to journey into the heart of the Kuiper Belt to learn what’s out there.

Jamey Szalay
Jamey Szalay
Credit: Kyle Cassidy

Rotational Movies of Pluto and Charon: It’s Show Time!

Today’s blog post is written by Constantine Tsang, a senior research scientist at the Southwest Research Institute (SwRI) in Boulder, Colorado. Con was a member of the New Horizons’ Geology, Geophysics Investigations (GGI) and Composition teams during the Pluto flyby, creating approach and photometric stereo movies of Pluto’s terrain.

It’s amazing that we’ve come such a long way in our exploration of the Pluto system, and it’s only been five months since the close flyby of New Horizons. From the exceptionally young ice-covered plain informally named Tombaugh Regio on Pluto to the deep canyons cut into Charon, the terrains we’re seeing are just amazing. Everyone, from the mission scientists to the general public, seems to be having a field day coming up with pet theories and comparisons with other places in our solar system to explain the alien Pluto system worlds we’re seeing.

New Horizons Team
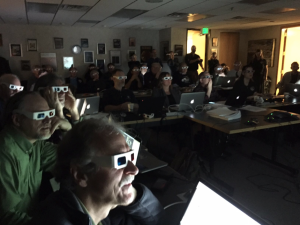
The New Horizons Science Team Meeting in Boulder, Colorado, in November 2015. Mission scientists enjoyed the fruits of their labor by viewing stereographic projections of geology 3-D terrain maps of Pluto and Charon. Credit: Constantine Tsang

Approaching the Pluto System

To put this into context, I’d like to take us back a few weeks just prior to the July 14 flyby, before we got the exquisitely detailed images we routinely downlink now. During that phase, we were getting longer range, low-resolution views of Pluto and Charon, and my job was to create approach movies showing New Horizons rushing up to meet the pair in space.

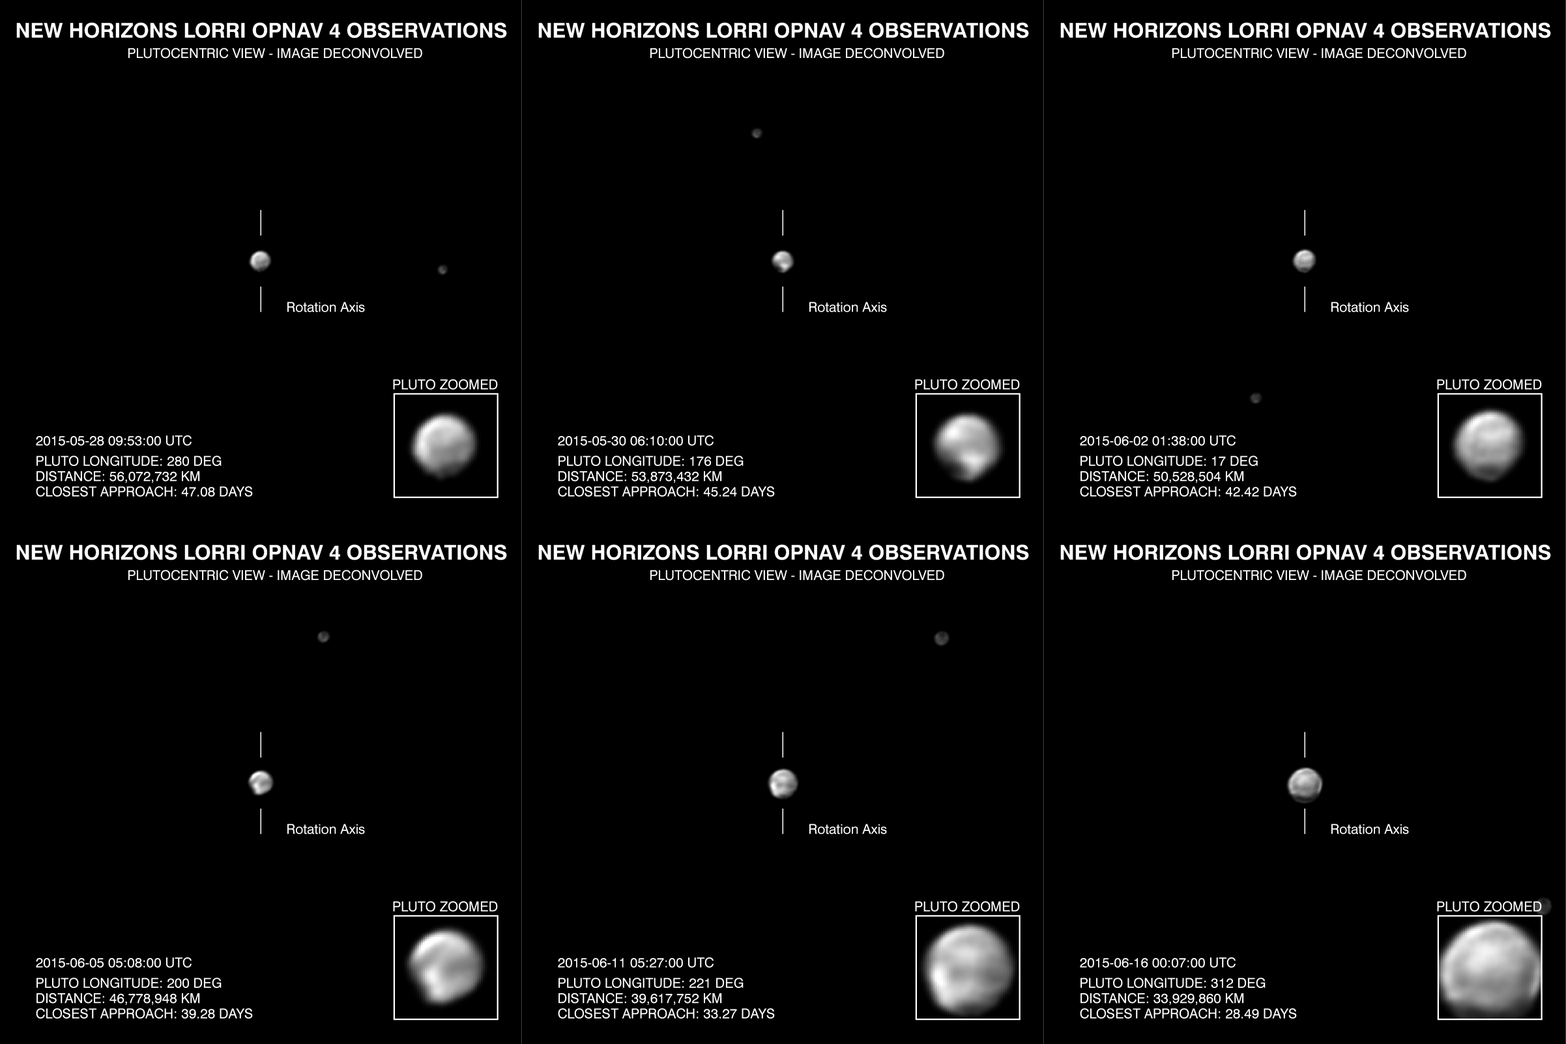
In workrooms at the Johns Hopkins Applied Physics Lab (JHUAPL) in Laurel, Maryland, I and many of the science team members had arrived for the flyby, and were working seven days a week to keep on top of the data flowing in. The majority of the science data being received at this time were in the form of panchromatic (black and white) images from the telescopic LORRI imager on New Horizons. These Optical Navigation images, or “OpNavs,” came in different flavors, in part based on their exposure times. These images are used to refine the approach trajectory of New Horizons and to search for hazards on approach. Sequencing these images together had the added benefit of allowing us to make movies of Charon and Pluto rotating on their axes and orbiting one another at closer and closer range.

The Pluto System in the Barycentric Reference Frame

The procedure I used to make these movies was not trivial, mind you. Each movie imager, or “frame,” from LORRI was, in fact, a stack of four separate images, taken at slightly different times. This allowed us to “sub-sample” Pluto’s (and eventually Charon’s) disk to get the best possible spatial resolution out of the LORRI telescope. This work was mainly done by science team member and image processing expert Tod Lauer at the National Astronomical Optical Observatories.

Because we wanted to get the best resolution out of the data, Tod and I enhanced the images using a technique called image deconvolution, which sharpens them. The practical problem with this was we didn’t sometimes know what features were real on Pluto and Charon (because we’ve never been there before!), and what were potentially introduced as artifacts by the deconvolution process. So we deconvolved the images separately, using multiple techniques, and then compared our results to see what features at the edge of resolution were common to differing image processing techniques—we knew we could trust those. Needless to say, I was gratified to see such features pop out from the LORRI images consistently.

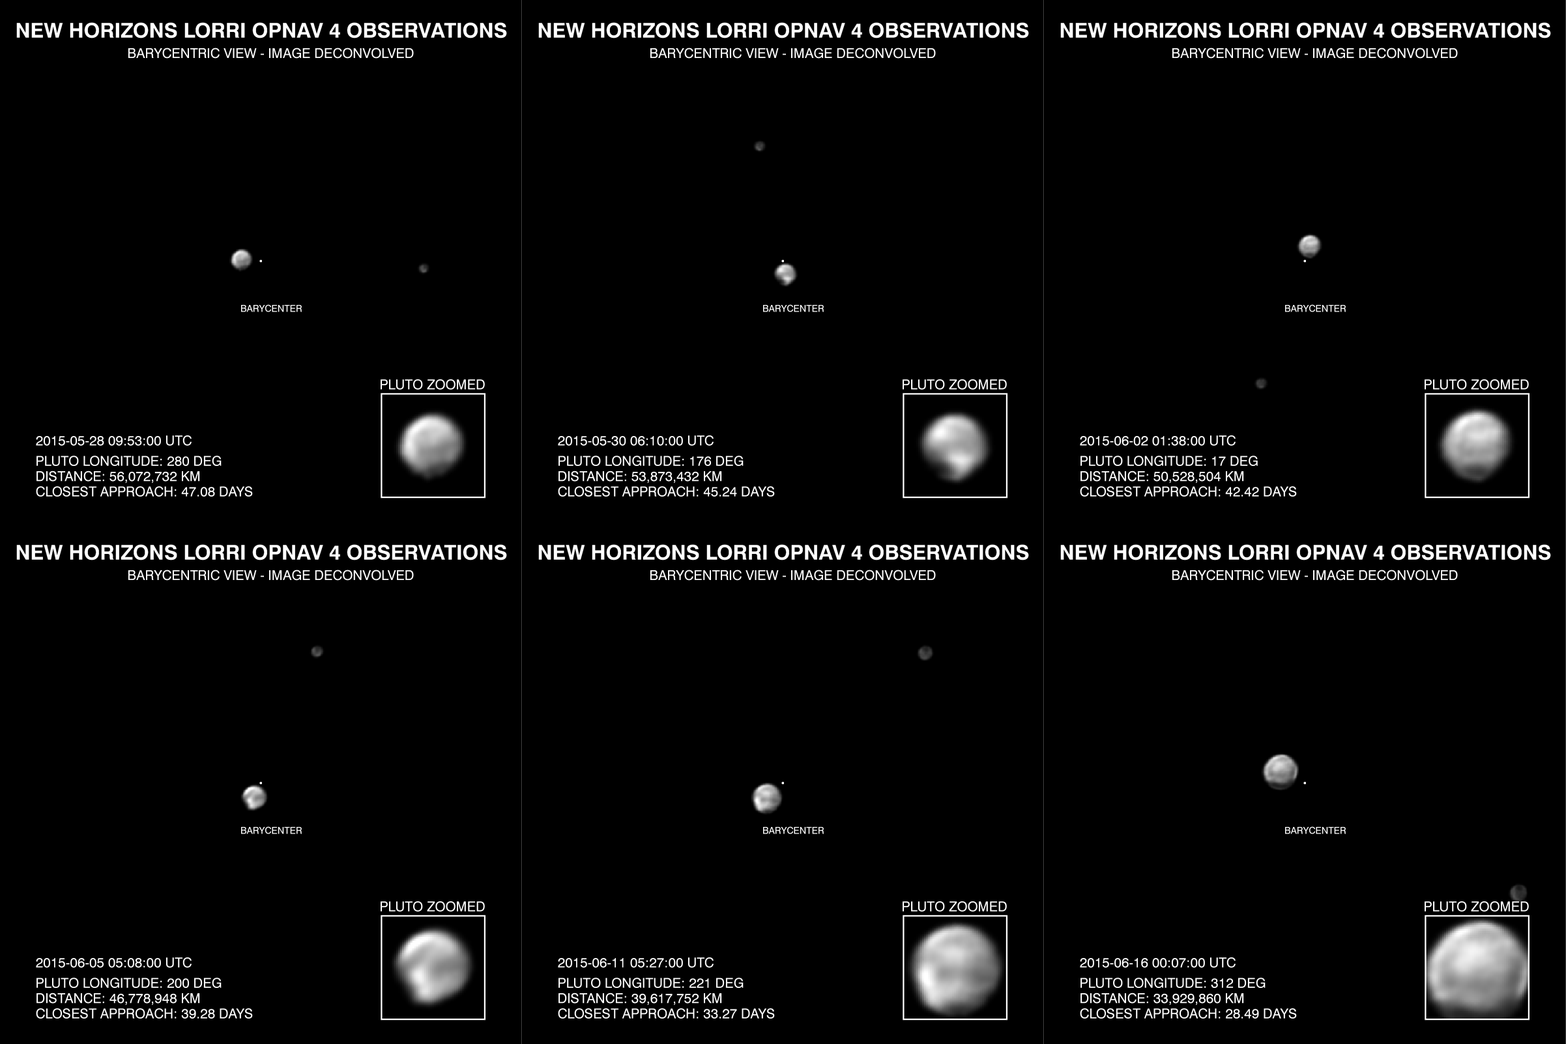
Because Pluto was in a slightly different place in each frame, I then co-registered and centered Pluto to create a single movie Plutocentric frame that gave the approach movies the appearance of a motionless Pluto at the center of each movie. Every few days, another set of images was taken and I repeated the procedure. But I wasn’t quite done. To remove the barycentric “wobble” caused by Pluto and Charon tugging on each other, I then took each of the frames and co-registered them against a background star that appeared in the field of view of all the frames. Every 6.4 days, Charon would make a full rotation around Pluto, and I could compile a new rotation movie of Charon going around Pluto (see Figure 1). In these movies the features on Pluto would rotate, getting bigger in the field of view with each image, and we could finally begin to see the surface details that are so obvious now (see Figure 2).

On each movie frame, I also printed in ancillary data such as distance to Pluto and time to closest approach. I was humbled to be part of the process of giving the world its first look at the Pluto system up close.

As time went on, and we got data from the MVIC color camera aboard New Horizons, I could also overlay the color information on the monochromatic images to colorize the movie.

Approach Movie
Figure 2: An approach movie I made comprised of LORRI images of a number of Charon rotations about Pluto, in the Plutocentric reference frame. The regions informally named Cthulhu Regio (dark region at the “bottom” of the Pluto image) and Tombaugh Regio (bright feature next to Cthulhu) could already be made out weeks before closest approach. Aside from one or two MVIC color frames, these images and movies were all we had before the July 14 flyby. Credit: NASA/JHUAPL/SwRI
Approach movie
Figure 2: Same as figure 1, but presented in the barycentric reference frame. Credit: NASA/JHUAPL/SwRI

Perspective

You may wonder why this process is at all relevant now, given the incredible high resolution images we got later. Well, here are a couple of reasons. First, the approach movies contain data on parts of Pluto and Charon that were not imaged at closest approach. These images will be used to get as much information out as possible about the Pluto system, its global geography, its surface properties, and potential temporal variations as we approached. Second, the barycentric movies are a great visualization of the two-body binary system and provide an invaluable teaching tool for educators and the general public. Finally, I think it just looks cool! It puts into perspective how we on New Horizons and NASA are always exploring, and how far we have come to explore the Pluto system.

Constantine Tsang
Constantine Tsang
Credit: Rayna Tedford

Pluto, Closer to Home

Today’s post is from Veronica Bray, a planetary scientist at the Lunar and Planetary Laboratory in Tucson. She specializes in comparing the surfaces of planetary bodies across the solar system.

I love looking at New Horizons’ images of Pluto! But I spend most of my time looking elsewhere. Why? Because comparing Pluto with other planetary bodies helps me to understand what processes could be operating on Pluto’s surface and beneath its icy crust. Although a full understanding of planetary processes is a more complicated matter, the initial steps that I take as a comparative planetologist are simple: compare what the features look like on the different bodies.

Pluto’s surface is comprised of water ice and other exotic types of ice (e.g. methane, carbon monoxide, nitrogen). This makes comparison to the icy moons of the outer solar system a logical place for me to look for analogous landforms. However, as the close-up images of Pluto came back from New Horizons, I was reminded of places closer to home. This blog post presents two examples of features on Pluto that remind me of landforms on Earth and Mars.

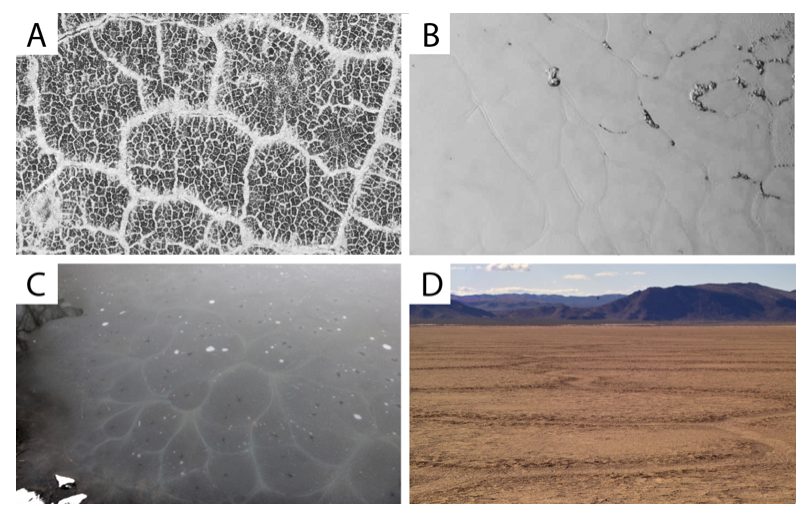
Polygons: Polygons on a planetary surface typically have five or more sides and can form in several different ways. When the New Horizons team first saw the polygons of the icy plain on Pluto that we informally call Sputnik Planum (Figure 1B), a number of questions arose: Were these patterns due to the heating up and cooling of the surface, leading to expansion and contraction cracking like the polygons seen on Mars (Figure 1A)? Was sub-surface convection of warmer ices creating a cracked surface above the convection ‘cells’ as can be seen in the surface ice of frozen lakes on Earth (Figure 1C)? Or were they similar to ‘dessication’ mud cracks (Figure 1D) formed by the drying out of the surface material? We each had our own theory and the team buzzed with discussion about what might be going on. We showed one another pictures taken by spacecraft in other places it the solar system; we even shared photos that we ourselves had taken from business trips and fieldwork! All so that we could take the next step in understanding these features: to compare the morphology.

The polygons on Pluto’s Sputnik Planum have edges that are smoother and more curved than the linear sides of the mud cracks or Martian freeze-thaw polygons. Instead, the polygons of Sputnik Planum most closely resemble those formed by sub-surface convection (although on a MUCH larger scale than the example used in Figure 1C.) Our current understanding of the polygons of Sputnik Planum is that they mark the top of convection cells within a slowly churning mass of nitrogen and carbon monoxide ices. So, although I was initially reminded of processes on the Earth and Mars, this process on Pluto is far more exotic and has never been seen anywhere else in the solar system!

Examples of polygons on the Earth, Mars and Pluto.
Figure 1: Examples of polygons on the Earth, Mars and Pluto. A) Freeze-thaw polygons in the periglacial terrain of Mars. In this image from NASA’s High Resolution Imaging Science Experiment, frost is highlighting the cracks at the edges of each polygon. Looking closely we can see smaller polygons within the larger polygons. The image is approximately 12 miles (20 kilometers) across. Credit: NASA B) New Horizons’ image of a ~ 120 mile (200 kilometer) wide section of ‘Sputnik Planum’ on Pluto. Credit: NASA/JHUAPL/SwRI C) Fracture polygons on a frozen lake on Earth. The image is approximately 13 feet (4 meters) across. Credit: Paul Schenk D) Mud crack polygons on Earth. This image shows large polygons (~ 33 feet or 10 meters across), and the smaller mud cracks within them, created as a muddy surface dries out. See it for yourself at Red Lake Playa in Death Valley. Credit: Jason Barnes

Impact Craters:

I can usually count on impact craters to be present to assist me with comparing planetary surfaces. All but a few surfaces in the solar system are scarred by hypervelocity impacts that penetrate down into the crust. I compare the shapes of impact craters on Pluto and other bodies to investigate the crustal and sub-surface properties.

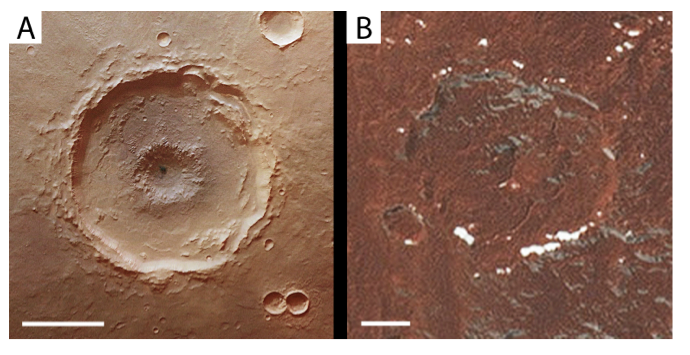
Figure 2 shows examples of ‘central pit’ craters – large complex craters with a pit at or near their center. The diameter of the pit compared to the diameter of the crater for the Pluto example (Figure 2B) is similar to the Martian example (Figure 2A), which might suggest a similar formation mechanism. Although various types of pits or pitted-peaks can be found in craters across the solar system, this type of central pit crater has a particularly large pit relative to the crater size and is only found on ice-rich bodies. Their formation has consequently been linked to the presence of water ice in the crust. It is not surprising then that we found this central pit on Pluto in the informally-named Cthulu Regio, in an area of noted water-ice content. But of course, the story is never that simple. The presence of sub-surface layering has also been suggested as a reason for the formation of central pits.

I am currently measuring and comparing the central pit craters across the solar system to determine why and how central pits form, and consequently, whether their presence on a planetary surface can be used as a prospecting tool for water ice or target layering. The new observation of a central pit crater on Pluto from New Horizons provides another important data point to add to my quest to understand how these craters form.

: Examples of central floor pit craters on Mars and Pluto.
Figure 2: Examples of central floor pit craters on A) Mars and B) Pluto. Scale bars are approximately 12 miles (20 kilometers) across. The Mars image is from ESA’s High Resolution Stereo Camera and features a crater in the Thaumasia Planum region. Credit: ESA. The Pluto example shows an as yet unnamed crater in the dark terrain of Cthulu Regio. Credit: NASA/JHUAPL/SwRI
Veronica Bray
Veronica Bray
Credit: Ken Sterns

Radio Signals from Earth Probe Pluto’s Atmosphere

Today’s post is from William Woods, a doctoral candidate in Electrical Engineering at Stanford University. He investigates radioscience and remote sensing, with a focus on signal processing for the radioscience experiment (REX) onboard New Horizons. He studies both engineering and science under Dr. Ivan Linscott and Dr. Howard Zebker at Stanford.

Pluto's atmosphereI study remote sensing and signal processing for the radioscience experiment (REX) onboard New Horizons. REX performs three experiments at the Pluto system. The first is radio occultation, in which NASA’s Deep Space Network (DSN) and REX form a radar system that probes the atmosphere of the occulting body. REX performs radio occultation on both Pluto and Charon that yields estimates of atmospheric temperature and pressure as a function of altitude. REX also performs thermal scans of Pluto and Charon. Thermal scans passively measure blackbody radiation emitted by the target in order to estimate surface temperature. Finally, REX data estimates mass of the entire Pluto system by measuring curvature in New Horizons trajectory due to local gravity conditions.

The spreading of energy as it travels through the atmosphere to REX severely limits spatial resolution of raw radio occultation data. Without extensive post-processing this resolution can be thousands of times worse than the experiment’s design specifications. I develop linear and non-linear techniques that focus energy in REX occultation data down to a resolution near the fundamental limit of the instrument itself.

nh-blog-fig1-radio-occultation-signal

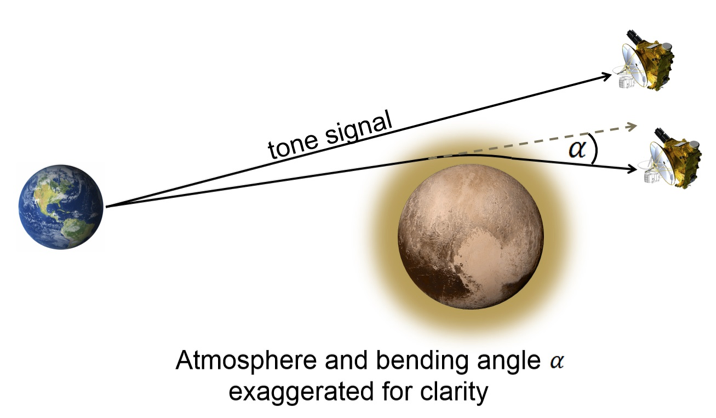
Figure 1 above shows the geometry of New Horizons’ radio occultation of Pluto. Historic occultation techniques exchange the locations of transmitter and receiver, but experiment fundamentals remain the same. Earth DSN transmits a monochromatic plane-wave of 7.2 GHz to New Horizons as it flies behind Pluto. The signal passes through Pluto’s atmosphere and refracts, resulting in a small change of direction, exaggerated for clarity in Figure 1. The direction change manifests as a Doppler shift in frequency, therefore REX measures a signal rate slightly different from the original 7.2 GHz. The direction change, or bending angle, is proportional to dielectric constant in the atmosphere. Given prior knowledge of Pluto’s atmospheric composition, we use dielectric constant to calculate temperature and pressure in the atmosphere as a function of altitude.

Energy in the plane wave spreads as it passes Pluto

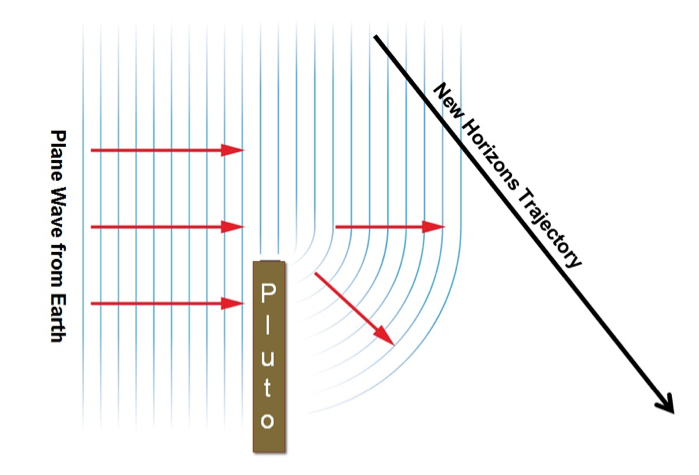
Energy in the plane wave also spreads as it passes Pluto’s limb, shown above in Figure 2. This energy spreading, called diffraction, causes each single data point measured at REX to be a weighted sum of energy from many points in Pluto’s atmosphere. Without focusing the energy back into its original point locations in the atmosphere we can only achieve spatial resolution on the order of a few kilometers. But once focused during post-processing the REX radio occultation at Pluto measures atmospheric temperature and pressure at absolute accuracies of 3 K and 0.1 Pa, respectively, with spatial resolution of a few meters. Preliminary results from REX data processing show surface pressure on Pluto of approximately 10 uBars.

My final contribution to New Horizons is a short video that explains the significance of the mission to the broader public. I attempt to put the science and engineering of New Horizons into the human context of Dr. Ivan Linscott, my PhD advisor at Stanford University. Enjoy.

Ten years ago, NASA launched the first ever mission to Pluto. On July 14, 2015 New Horizons reached its destination. And what we found may change our understanding of life on Earth. Credit: Red Dwarf LLC www.reddwarfcreative.com

Will Woods
Will Woods, Stanford University. Credit: Kyle Cassidy


In the Shadows of Pluto and Charon

Today’s post is written by Josh Kammer, a New Horizons postdoctoral researcher at the Southwest Research Institute (SwRI) in Boulder, Colorado. Josh came to SwRI directly after his PhD in planetary science from Caltech; his undergrad work in chemistry was at Texas A&M. Josh’s work on New Horizons focuses on analysis of ultraviolet spectra acquired by the Alice instrument.

occultations of Pluto and Charon
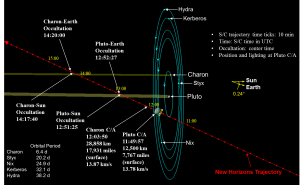
The geometry of the occultations of Pluto and Charon, as observed by New Horizons. Credit: NASA/JHUAPL/SwRI

As someone who primarily studies atmospheres, I think the most exciting observations made by New Horizons this past summer were the solar occultations by Pluto and Charon. Achieving the required alignment of spacecraft, planet and the sun during an occultation was a difficult challenge – especially when there was a significant amount of uncertainty in the exact position of Pluto at the moment of New Horizons’ flyby. However, the mission planners and our navigation team were able to take this uncertainty into account, and not only managed to thread the eye of the needle by flying New Horizons through Pluto’s shadow, but through a portion of Charon’s shadow as well!

Chasing After Shadows

So why is this so exciting from an atmospheric science point of view? Well, scientists had previously used stellar occultations by Pluto and Charon as seen from Earth to probe for possible atmospheres. In those cases, they looked at more distant stars as they passed behind Pluto and Charon. From the dips in starlight, they found plenty of evidence for an atmosphere around Pluto, but nothing to indicate an atmosphere around Charon.

There are limitations to ground-based observations of stellar occultations, however – the Earth’s own atmosphere absorbs starlight as well, especially at many scientifically valuable wavelengths. Also, the brightest star in the sky, the sun, can’t be used for such observations from Earth, since the observer needs to be on the other side of Pluto to find the sun’s shadow. New Horizons was, therefore, the first spacecraft in history to be able to observe such a solar occultation in the Pluto system – and its proximity meant that it had the highest sensitivity by far to detect the individual constituents of Pluto’s atmosphere, and to probe even closer to find a possible atmosphere around Charon. Being outside the atmosphere of Earth also meant that the whole solar spectrum was available for study, including a key region of the ultraviolet where many molecules interact with sunlight.

Scanning for ‘Fingerprints’ in the UV

spectrum showing the absorption features of several atmospheric molecules in the far-ultraviolet
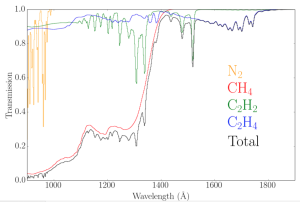
Example spectrum showing the absorption features of several atmospheric molecules in the far-ultraviolet. For a given line of sight abundance, each component contributes differently to the overall transmission of sunlight in the UV. Credit: SwRI/Josh Kammer

So how do we detect different components of atmospheres using occultations? Depending on composition, atmospheres will absorb sunlight more strongly or weakly at different wavelengths. Each individual component of the atmosphere has its own ‘fingerprint’ that varies with wavelength – and one of the most revealing parts of the solar spectrum is in ultraviolet (UV) wavelengths, where even very thin atmospheres absorb strongly. Mission scientists designed the Alice UV spectrograph onboard New Horizons to detect the ‘fingerprints’ of a wide range of possible molecules that we expected to find on Pluto, including nitrogen (the most prevalent molecule in our own atmosphere), as well as hydrocarbons like methane.

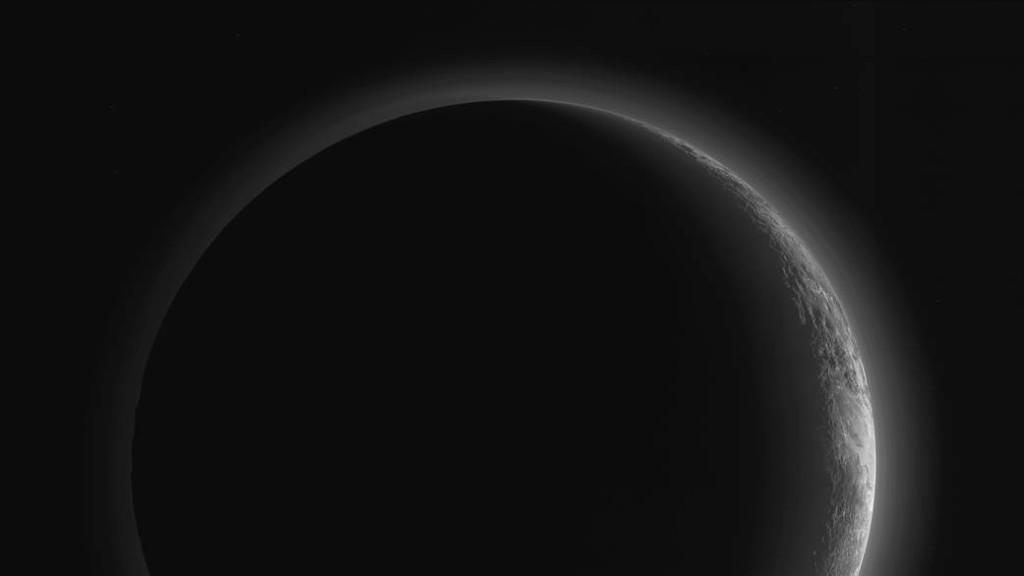
These particular molecules are interesting for many reasons. For one, Pluto is so cold at its distance from the sun that these components of its atmosphere can freeze onto the surface and form nitrogen and methane ice. These same molecules can also react in the atmosphere to form heavier hydrocarbons, nitriles, and even hazes, which can clearly be seen in some spectacular images of Pluto already sent back by New Horizons.

Analyzing the Data

Alice Occulations
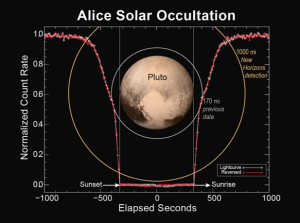
This figure shows how the Alice instrument count rate changed over time during the sunset and sunrise observations. The count rate is largest when the line of sight to the sun is outside of the atmosphere at the start and end times. Molecular nitrogen starts absorbing sunlight in the upper reaches of Pluto’s atmosphere, decreasing as the spacecraft approaches the planet’s shadow. As the occultation progresses, atmospheric methane and hydrocarbons can also absorb the sunlight and further decrease the count rate. When the spacecraft is totally in Pluto’s shadow the count rate goes to zero. As the spacecraft emerges from Pluto’s shadow into sunrise, the process is reversed. By plotting the observed count rate in the reverse time direction, it is seen that the atmospheres on opposite sides of Pluto are nearly identical. Credit: NASA/JHUAPL/SwRI

Immediately following the flyby, initial results from Alice and New Horizons included count rates of the combined amount of sunlight in the UV, which was consistent with our expectations of a nitrogen atmosphere with other hydrocarbons present like methane. These absorption profiles revealed for the first time just how far the atmosphere of Pluto extends, and also showed that it is very symmetric during both sunrise and sunset on Pluto. There was also tantalizing evidence for some kind of haze that could be seen over 100 miles (160 kilometers) above the surface.

It wasn’t until just last month that New Horizons sent back the spectra to Earth with information about the transmission of sunlight as a function of wavelength in the UV. This exciting new data allows us to analyze the individual chemical components of Pluto’s atmosphere even further, determining how composition changes with altitude. We are also using similar data for Charon to probe even deeper for a possible atmosphere there, too – these results and a lot more are coming soon, so stay tuned!

Josh Kammer
Josh Kammer, Credit: Michael Wong

A Planet for All Seasons

Today’s post is written by one of the early career members of the New Horizons Science Team. Alissa Earle is a graduate student in Planetary Science at the Massachusetts Institute of Technology. Her work focuses on the long-term seasonal variations that may be affecting what we see on Pluto’s surface.

Pluto’s diverse surface, typified by the smooth bright plains of Sputnik Planum being adjacent to the dark terrains of Cthulhu, defies any easy explanation for how it got that way. In my work, I am trying to explore how “seasons” on Pluto might be part of the explanation.

There are two reasons for Pluto having seasons. The first is for the same reason that Earth has seasons. The second is unique to objects with elongated orbits, like Pluto.

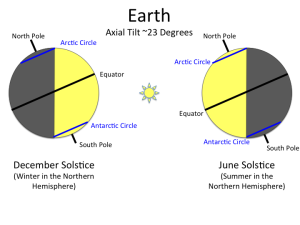
Both Earth and Pluto have seasons because their spin axes are “tipped over.” Earth has a rather modest tilt, only about a 23-degree slant compared with being straight up-and-down in its orbit. The consequence of this tilt is that over the course of one year, the North and South Poles take turns being tipped toward the sun. Earth’s North Pole is tipped more toward the sun in June, and six months later with the Earth being on the opposite side of the sun, Earth’s South Pole is tipped more toward the sun in December. This gives us alternate seasons of summer and winter, even though the Earth is in a nearly perfect circular orbit.

Earth diagram
Earth’s seasons are caused by its axis being tilted about 23 degrees. Credits: MIT/Alissa Earle

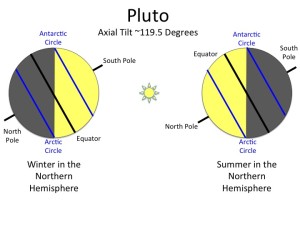
While Earth’s 23-degree axis tilt is mild, Pluto’s axis tilt is extreme: 119.5 degrees! What this means is that Pluto’s north pole is nearly upside down compared with Earth. What’s more, the extreme tilt gives very extreme seasons. On Earth, the midnight sun in summer and arctic darkness in winter are limited to the highest latitudes on Earth (the Arctic Circle at 67 degrees north and Antarctic Circle at 67 degrees south). On Pluto, the midnight sun and long arctic darkness affect nearly the entire planet. The equivalent for Earth would mean all of North America and Europe would experience months of midnight summer sun and then months of darkness in winter. Because Pluto takes 248 Earth years to go around the sun, these long seasons last more than a century.

But wait, there’s more. The second factor driving Pluto’s seasons is that its orbit is not circular. Instead, it is very stretched out into an ellipse. (To imagine an ellipse, think of the silhouette of an egg tipped over on its side.) Earth’s orbit is also elliptical, but to a much smaller degree than Pluto’s.

Pluto diagram
Since Pluto has a much higher axial tilt of roughly 119.5 degrees, it has much larger arctic and antarctic circles, each stretching from roughly 29.5 degrees latitude to their respective poles. This means that at the peak of Pluto’s summer the area receiving the most direct sunlight is actually in the arctic circle. Credits: MIT/Alissa Earle

During its orbit, Pluto passes as close to the sun as about 30 times the distance between the Earth and the sun (bringing it even closer to the sun than Neptune) and travels as far away as about 50 times the Earth-sun distance. This means during some seasons on Pluto, the effect is even more dramatic: for example, “hotter summers” for whichever part of Pluto is tilted toward the sun at the closest point in its orbit. This effect is not unique to Pluto, although Pluto is one of the most extreme cases of it. For example, Mars experiences a less dramatic version of this effect because it has an orbital tilt a little greater than 25 degrees and moves between 1.4 and 1.7 Earth-sun distances over the course of its orbit. Keep in mind, that on Pluto, “hotter” is a relative term. A summertime high might only be “in the 70’s” as measured in Kelvins—about 330 degrees below zero Fahrenheit (minus 200 degrees Celsius).

It’s refreshing to see at least one example that makes our Boston winters seem mild.

Alissa Earle
Author: Alissa Earle Credits: MIT/Richard Binzel

The Impact of Craters

Hello! It’s Kelsi Singer again from the New Horizons science team to talk about one of my favorite planetary geologic features –impact craters. They may just look like holes in the ground, but amazingly, craters can give us all sorts of useful clues to a planet’s history.

Pluto
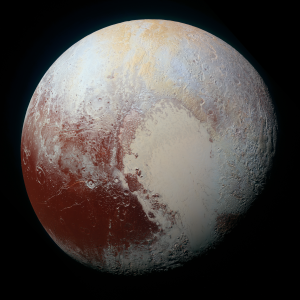
This portrait of Pluto is in enhanced color, to illustrate differences in the composition and texture of Pluto’s surface. Credit: NASA/JHUAPL/SwRI

There are many ways scientists investigate a planet they’re seeing for the first time, and this is one example. With a flyby mission you can’t probe the ice on the surface or analyze samples, so you have other methods to determine a planet’s makeup and age – and gain insight into how it evolved into the world it is today. Analyzing craters can help us understand the age of a planet’s surface.

A surface with more craters indicates that it’s older, geologically, than a less-cratered surface. Pluto displays many good examples of this concept. Any guesses as to which parts of Pluto mission scientists think are younger?

If you went with the informally named Sputnik Planum – the left half of Pluto’s “heart” feature – as a young geologic unit, then you are on the right track. So far we have not identified any obvious craters on Sputnik Planum. We can also try to put an actual date on a surface (e.g., that a given surface is 1 billion years old), but this is more difficult because it requires some knowledge of how often impactors (chunks of space debris) of a certain size hit the surface to make craters.

Sunlight on Pluto
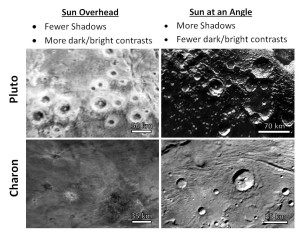
These close-up images of Pluto and Charon illustrate the effect of lighting geometry on the appearance of craters.
Credit: SwRI/Kelsi Singer

Age-dating based on craters is complicated by a number of other factors as well. I will highlight one big issue here: How one “sees” craters is affected by lighting over the planet’s surface. Just like on Earth, the lighting on Pluto and Charon changes both with latitude and over the course of the day. When the sun is directly overhead, there are very few shadows cast and it is hard to see topography, but that overhead lighting makes it much easier to see dark or bright markings. The opposite is true when the sun hits the surface at a shallow angle near sunrise or sunset: topography is easy to see, but bright and dark colorations are often washed out.

Because New Horizons flew by Pluto so quickly (in just a few hours out of Pluto’s day, which is 6.4 Earth days), our highest-resolution pictures were all taken under the same lighting conditions. The northern latitudes of Pluto and Charon have the sun mostly overhead, while near the equator the sun hits the surface at an angle. This gives the effect that craters in the north look flatter and have stronger dark/bright contrasts, while craters near the equator look more 3-D.

Kelsi Singer
Kelsi Singer

There are many other complicating factors, such as variable image resolutions and variable surface erosion or degradation. Even fragments of surface material ejected while creating a “primary” crater can pose a problem because they may litter the surface and make smaller, so-called “secondary craters” that influence crater statistics. We are taking all of these factors into account as we map Pluto and Charon’s craters and mine this data to learn more about the history and evolution of these amazing, mysterious worlds.

Pluto’s Small Moons Nix and Hydra

Today’s post is written by Simon Porter, a New Horizons postdoctoral researcher at the Southwest Research Institute in Boulder, Colorado. Simon’s work focuses on the small satellites of Pluto.

This week’s beautiful Charon images remind us that Pluto is not just one body; it’s a whole system of worlds.

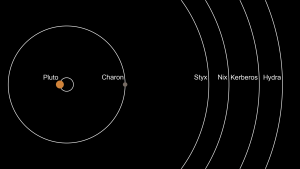
Pluto and its largest moon Charon dance around each other, making circles around their common center of mass, which lies in an empty space between them. Around the dancing couple are four small moons. In order of increasing distance, their names are Styx (just beyond Charon), then Nix, Kerberos and Hydra. These tiny moons also orbit around the system’s center of mass. The orbits line up like a miniature solar system, except with a binary system at the center, similar to the planetary system around the star Kepler 47. All four of the small moons are less than about 30 miles (50 kilometers) in their longest dimension. Each has a lumpy shape because, unlike Pluto and Charon, they aren’t big enough for gravity to squish them into a ball.

Nix and Hydra were discovered in 2005, shortly before New Horizons launched in 2006, and their initials were a subtle nod to the New Horizons mission that started the search for them, just as the P and L in Pluto are a subtle nod to astronomer Percival Lowell, who began the search for Pluto.

Pluto schematic
The orbits of Pluto and its moons Charon, Styx, Nix, Kerberos and Hydra are illustrated around their common center of mass. Credit: SwRI/S. Porter

Styx and Kerberos weren’t discovered until 2011 and 2012, well after the New Horizons spacecraft was on its way to Pluto. Although the mission’s observing plans were pretty well set by then, the New Horizons science team anticipated that new discoveries from other facilities might be made during the long cruise to Pluto and had left room for a handful of “TBD” observations, which became the only ones specifically devoted to Kerberos and Styx. That’s why New Horizons took many more pictures of Nix and Hydra than of Styx and Kerberos.

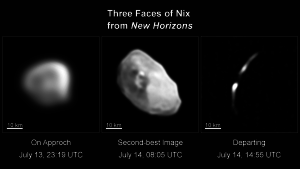
Nix is the second-largest of Pluto’s small moons and was the closest to New Horizons during the flyby, so we got better imaging of it than any of the other small moons. So far, we’ve been able to download close-up pictures of Nix taken at three different times by the Long Range Reconnaissance Imager (LORRI) high-resolution camera, but the best image is still on the spacecraft’s digital recorders waiting to come to Earth.

From looking at Nix as point of light with the Hubble Space Telescope and with New Horizons on approach, we knew that Nix’s brightness regularly changed over time, and therefore it was probably elongated. However, the first image (on the left) really surprised us, because Nix appeared to be round—not at all elongated.

Mark Showalter – who discovered Styx and Kerberos — pointed out that we were probably just looking down the long axis, and that the next images would look more “potato-ish.” Sure enough, the next image showed Nix looking far more elongated, but with one great surprise in it: a big crater! Nix isn’t very large, and there is a very fine line between an impact that will make a crater that big and one that will break Nix apart. So either Nix was very lucky in surviving that collision, or it’s a fragment of an older moon that was somehow destroyed.

Three faces of Nix
Pluto’s moon Nix is viewed at three different times during the New Horizons July 2015 flyby. Credit: NASA/JHUAPL/SwRI

The last Nix image we have so far was taken right after the spacecraft passed Pluto and started to look back on its crescent. Because Nix has no atmosphere, it isn’t as spectacular as the images looking back at Pluto, but measuring the brightness of that little crescent of light can help tell us about what the surface of Nix is made of, and whether its surface is smooth or covered in boulders.

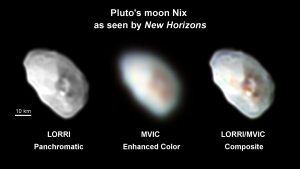
Pluto's Moon Nix as seen by New Horizons
Pluto’s moon Nix is shown in high-resolution black-and-white and lower resolution color. Credit: NASA/JHUAPL/SwRI

What we do know about the big crater on Nix is that it appears to be a different color than the rest of the moon. The color image below was taken by New Horizons’ Ralph-Multispectral Visible Imaging Camera (MVIC) three minutes before the LORRI picture; MVIC has one-fourth of LORRI’s resolution, but it can see in four colors: blue, red, near-infrared, and methane. In this image, the RGB colors are mapped to near-IR, red and blue, just like the enhanced-color images of Pluto and Charon. While most of Nix is a neutral white, the crater and its ejecta blanket (the material thrown out by the crater) appear to be a much redder material. Craters excavate material from below and throw it on the surface. This tells us that under its white surface, Nix is probably made of much darker material. We don’t actually know what either the dark or the light material is, nor will we be able to tell until we download the Nix data from the Ralph-Linear Etalon Imaging Spectral Array (LEISA) composition mapping spectrometer.

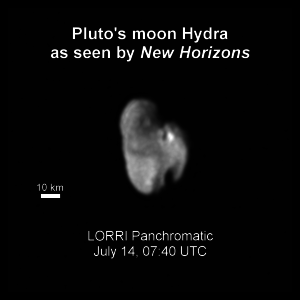
New Horizons also imaged Hydra and has sent some of these images to Earth. Below is the best LORRI image of Hydra taken by New Horizons. Unfortunately, Hydra was on the opposite side of Pluto from New Horizons at closest approach, so the images of Hydra are from farther away and therefore are at lower resolution than the Nix images we have. Because Hydra’s orbit was still somewhat uncertain, the mission planners designed this observation to be a mosaic of six slightly-overlapping shots. As it turns out, we hit the jackpot and Hydra fell right at the intersection of four of those six shots, meaning we got two full and two half-views of Hydra for the price of one!

Pluto's Moon Hydra as seen by New Horizons
Pluto’s moon Hydra as seen from NASA’s New Horizons spacecraft, July 14, 2015. Credit: NASA/JHUAPL/SwRI

The composite of these images shows that Hydra has a much more complicated shape than Nix and looks a bit like a much bigger version of comet 67P/Churyumov-Gerasimenko, which is currently being orbited by the Rosetta spacecraft. As some have proposed for 67P, it is possible that Hydra is the result of a low-speed collision of two older moons. We haven’t yet had a chance to download the LORRI images of Styx and Kerberos, but they are coming soon, and will be of similar resolution to this image of Hydra.

Simon Porter
Simon Porter Credit: Isaac Smith/SwRI

Finally, I want to tell you how I processed these images of Nix and Hydra. I created them in Python with AstroPy to read the images and translate from pixels to on-sky coordinates, and Scikit-Image to process and sharpen the images. LORRI’s pixels are smaller than the resolution limit of the imager, which makes the images appear a little bit blurry. But since the optics of LORRI are very stable, we can use a process called “deconvolution” to back out what the image would have been if the camera were perfectly sampled. This makes the images sharper, but also adds “noise.” We can minimize the noise by taking several deconvolved images and finding the median value at each pixel location; this keeps the real detail while throwing out much of the deconvolution noise. Both Astropy and Scikit-Image are free and open sources, and make astronomical image processing fun (and a bit addicting) for anyone with a basic knowledge of Python.