By Shane Grigsby, SARP Mentor
Tuesday, June 26th
Tuesday was our first day in Delano, the town closest to our field study area. We drove in from Palmdale, a trip that took us past the Mojave Desert and over the southern foothills of the Sierra Nevadas. Our destination, Delano, is a small, unassuming agricultural town of about 30,000 residents located in the central Joaquin Valley. The town is best known as the setting for John Steinbeck’s ‘Grapes of Wrath’.

Figure 1.1: Kate Garner admires the vineyard at our field site in Delano
Upon arrival, we checked into the Liberty Best Western Inn and headed to our field site. Our field site consisted of two blocks of vineyard owned by Delano Farms, one of which was subjected to water stress (half irrigation for 7-10 days), while the second block served as the control. The field site is part of a multiple-year water stress experiment run by Dr. Ustin’s colleague Dr. Smart, of the Department of Viticulture at UC-Davis. Once at the field site, Dr. Smart explained the history of the area, the nature of the experiment, how water stress is measured, and the larger impacts of water management to the state of California. In addition to meeting with Dr. Smart and his research group, we met with Dr. Ustin’s CSTARS group and discussed our sampling methodology for the following two days.
Wednesday, June 27th
Wednesday was our flight day. Some of the measurements for the experiment, such as Leaf Area Index (LAI), had some flexibility for the sampling window as they didn’t change much over small timescales. However, some of our measurements, such as water stress and water content, either follow diurnal cycles or change significantly over a few hours. To account for this, on Wednesday we took both imagery calibration measurements and in-situ field measurements for a variety of fast-changing field parameters.
 Figure 1.2: From left (standing): Tao Cheng, Shane Grigsby, Dr. Alsina-Marti (Mimar), Professor David Smart, and Austin Hopkins. Kate Garner and David Buckley are in the foreground. Professor Smart discusses agriculture, water management and plant stress.
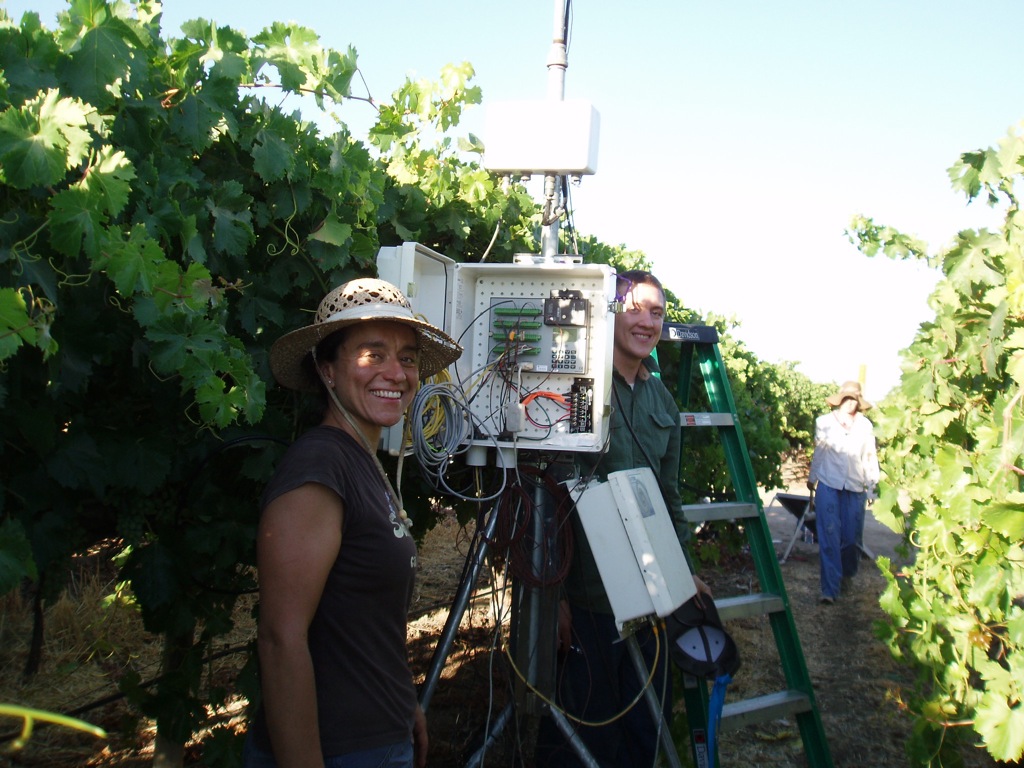
 Figure 1.3: From left: Susan Ustin, Michael Whiting, Tao Cheng and John Gajardo discuss field methods and sampling techniques
 Figure 1.4: David Buckley demonstrates proper all day-field attire: light-colored long-sleeve cotton shirt, wide-brimmed hat, and sunglasses
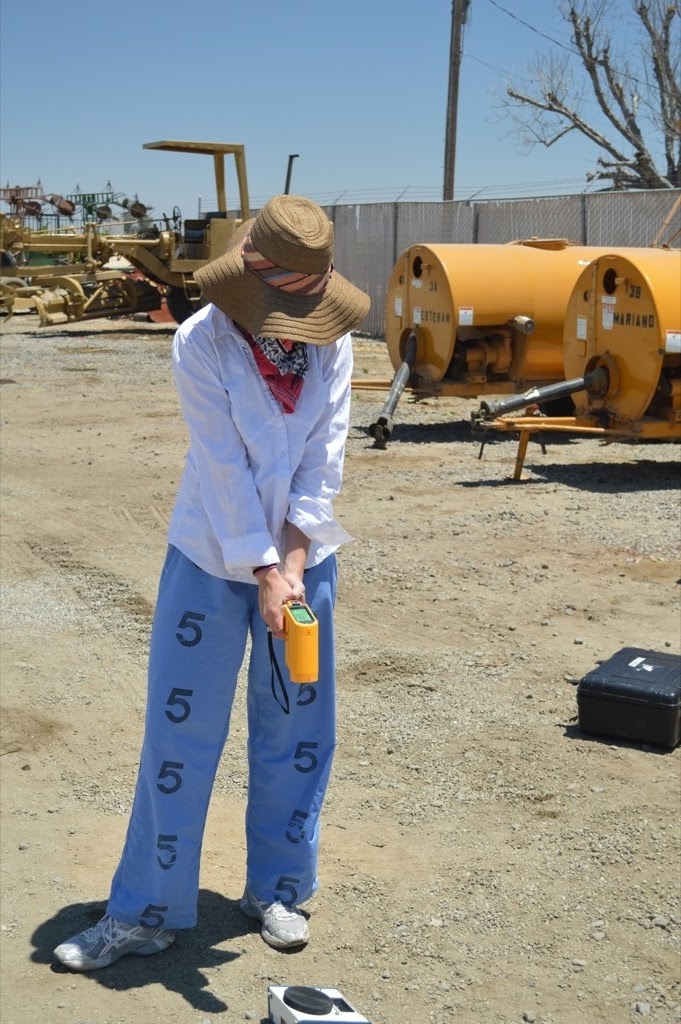
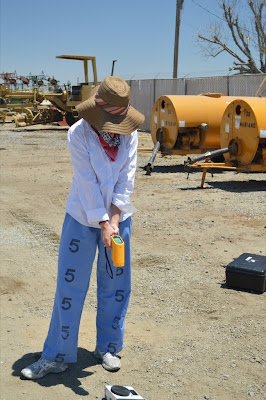 Figure 1.5: Kate Garner uses a radiometer gun for thermal calibration
Tao Cheng demonstrated many of the measurements needed for imagery calibration, including field spectral measurements with the ASD spectrometer, thermal measurements with the radiometer gun, and how to set up Spectralon panels.
 Figure 1.6: Chris Goyne is outfitted by Tao Cheng with ASD field spectrometer
For the water stress parameters, we sampled leaves for both water content and water stress. Ideally, we wanted the measurements to be as close to the flyover time as possible, so we formed several small groups to bag leaves simultaneously. The leaves for water content were picked in sets of three per vine, from nine vines per sample site, at twelve different sample sites. Water stress was measured using two ‘pressure bomb’ systems, which determined the amount of pressure needed to force water out of the leaf through the stem. We took each measurement twice to align with the MASTER overflights, once in the morning and again in the afternoon.
After the fieldwork concluded, we met at our lab, which is based at Liberty Best Western Inn. At the lab, we took additional spectral measurements and first estimates for leaf area and water content from our leaf samples. Additionally, we calculated the hemispherical transmittance and reflectance with an integrating sphere provided by Dr. Ustin’s group. This allowed us to solve for absorption. We completed lab analysis by determining leaf area with a LiCor table.
 Figure 1.7: Mimar explains the pressure bomb operation to Chris Goyne
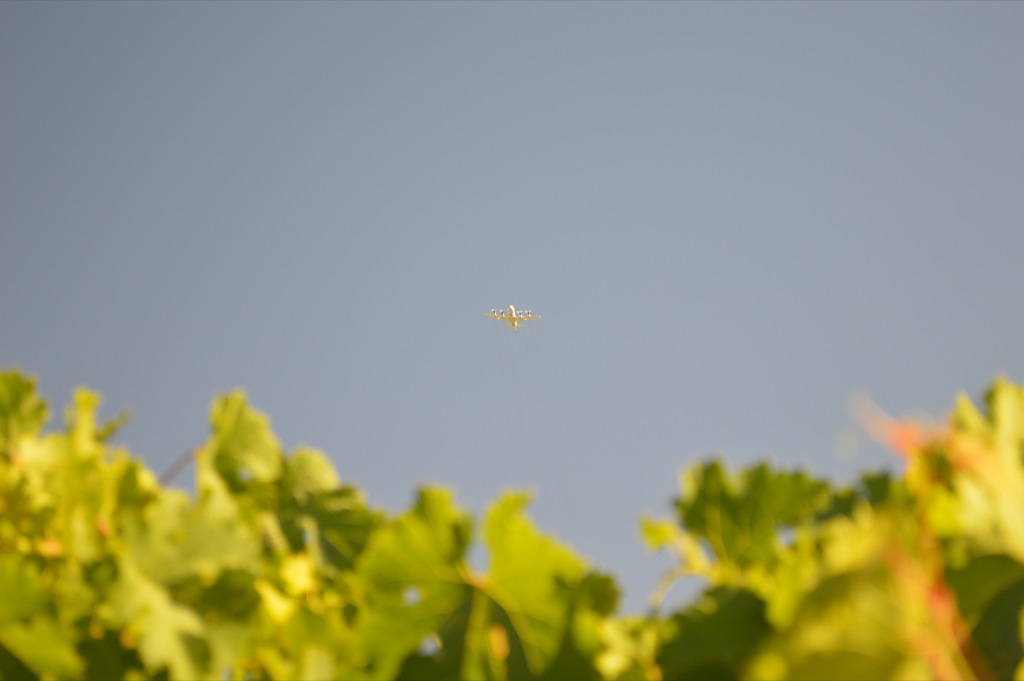
 Figure 1.8: The P-3 flying one of our data acquisition flight lines
 Figure 1.9: Kate Garner explains the LiCor scanning system to Peter Eckert; leaf samples awaiting processing are visible under the trash bags in the foreground
We ended the day by reviewing the set-up procedure for the LiDAR system in preparation for the next day’s work, and commemorating our efforts with a group LiDAR ‘photo’.
Thursday, June 28th
For our final day of sampling we primarily examined LAI, which is used as a proxy for plant productivity. We initiated the fieldwork with an explanation of surveying techniques, a demonstration of how to set up tribrechs, and exercises in taking differential GPS points.
 Figure 1.10: Aleeza and Kate cut leaves in preparation for the LiCor scanner, which requires flat leaf samples for analysis

Figure 1.11: Anthony controls the scanning rate for the LAI assessments
 Figure 1.12: Mimar and Peter Eckert move one of the Flux Towers, which is used to collect data on the surface energy budget
 Figure 1.13: The first scanning position with the scanner elevated above the canopy
 Figure 1.14: Shane Grigsby explains survey techniques for GPS setup
We set up reflectors for the LiDAR scans and separated into groups to take measurements. Dr. Smart and Mimar supervised the students for a second day of water stress measurements, while Dr. Ustin’s research group collected reference LAI measurements. As we had sampled leaves on Wednesday and calculated out leaf area, on Thursday we collected full cane samples. This was accomplished by selecting a vine, from which several full canes were removed to obtain leaf number and cane number counts.
 Figure 1.15: Reflectors arranged for linking together multiple LiDAR scans
To acquire canopy structure, leaf estimates, and leaf angles, we scanned a transect between the two data blocks. In order to take these measurements, we needed to get the equipment above the canopy–an endeavor that required some teamwork to get equipment on top of a Smart lab truck.
 Figure 1.16: Shane, Austin and John set up the LiDAR scanner
 Figure 1.17: Shane and Austin work with the scanner in darkness to reduce glare on the data laptop