Enceladus News Conference – Wednesday,March 26

Carolina MartinezCarolina Martinez, JPL News Team


There will be an Enceladus news conference at NASA headquarters in Washington at 11 a.m. PDT (2 p.m. EDT), Wednesday, March 26.  New results from the March 12 flyby will be presented.


For live streaming of NASA TV, visit:

https://www.nasa.gov/multimedia/nasatv/index.html


Participants in the news conference will be:

Hunter Waite

– Hunter Waite, Southwest Research Institute, San Antonio–principal investigator,

  Ion and Neutral Mass Spectrometer

John Spencer

– John Spencer, Southwest Research Institute, Boulder, Colo.–co-investigator,

  Composite Infrared Spectrometer

Larry Esposito

– Larry Esposito, University of Colorado, Boulder, Colo.–principal investigator,

  Ultraviolet Imaging Spectrograph


Spilling the Beans

John SpencerJohn Spencer, Cassini Scientist on the Composite Infrared Spectrometer (bio)

Well, now it can be told!  It’s frustrating for me to sit on exciting
new results – when we’ve found something cool in our data I want to
tell everyone all about it right away.  But it’s important to present
mission results in a coherent and coordinated way, and of course we
have to take the time to be sure we have our facts straight.  So
we’ve waited till today, Wednesday 26th March, 2 weeks after the
close Enceladus flyby, to spill the beans.

The days after the Wednesday March 12th Enceladus flyby were a blur
of frenzied activity for me as I worked to find the goodies in the
tens of megabytes of data that Cassini’s Composite Infrared
Spectrometer (CIRS) instrument had gathered during the flyby.  My
first peek at the uncalibrated data the next day, on Thursday
afternoon, was already thrilling – the glow of the tiger stripes was
visible not just at the usual 9 – 16 micron wavelength range where
we’d seen them before, but at wavelengths as short as 7 microns.  
Shorter wavelengths mean hotter temperatures (in the same way that
white-hot is hotter than red-hot), so it looked like the fractures
might be warmer than we had thought.  By the time I got all the files
I needed for the full analysis, from CIRS’s home at the Goddard
Spaceflight Center, it was time for dinner.  Precious ones and zeros
that had been flying through the Saturn system onboard Cassini 24
hours earlier, and squirted overnight across the solar system at the
speed of light, made the final leg of their journey to analysis by
bicycle, as I cycled home with my laptop.

After dinner I got comfortable on the sofa and dived in.  By bedtime
I had a preliminary map of the heat radiation from the south pole, at
four times the resolution of our previous best map.  Each of the four
tiger stripe fractures, clearly resolved in the thermal infrared for
the first time, lit up with the bright glow of internal heat.  A
couple of other fractures, not previously suspected to be active,
were warm too.  By Friday afternoon I also had preliminary
temperature estimates for the fractures- yes, they were pretty warm,
at least 180 Kelvin!  That’s -135 Fahrenheit, which isn’t exactly
toasty until you consider that the surrounding terrain is at around
65 Kelvin or -342 Fahrenheit.  The highest temperatures we’d seen on
the previous flyby in July 2005 were much lower, around 145 Kelvin
(-198 Fahrenheit)- not because Enceladus’s fractures were cooler
then, but because the older, more distant, scans were less
sensitive.  If it’s 180 K on the surface it must be even warmer down
below, perhaps approaching the magic number of 273 Kelvin or +32
Fahrenheit, where Enceladus’ ubiquitous ice can melt to form the holy
grail of astrobiology, liquid water.

Since that initial frenzy I’ve been checking calibration and refining
details, preparing graphics for today’s press briefing, and hearing
by e-mail and telecons about all the great data that was gathered by
the rest of Cassini’s arsenal of science instruments during the
flyby, some of which will be revealed by Hunter Waite at today’s
telecon.  We’ve also been modifying plans for upcoming flybys based
on the new data- we now know the hottest and most interesting parts
of the south polar region and can zero in on them next time.  Already
the theoretically-inclined members of the Cassini science team are
honing their models of the south polar plumes based on the new
findings, and the rest of the planetary science community will soon
be following suit.  And this is just the beginning- there are seven
more Enceladus flybys to come in the next two years.

I’ll end this blog with a big thank you to the rest of the CIRS
team.  I’ve been doing the fun job of analyzing these data, but there
would be no CIRS data to analyze without the tireless efforts of the
many folks at Goddard Spaceflight Center who designed and built CIRS
back in the 1990s, keep it running, design the observations, and
calibrate the data.  Special thanks are due to my CIRS colleagues
John Pearl and Marcia Segura, and CIRS Principal Investigator Mike
Flasar.

Culling Through It All!

Linda SpilkerLinda Spilker, Cassini Deputy Project Scientist
 
It’s been a whirlwind here at JPL as the data from the Enceladus flyby comes pouring in, and we scientists have been doing our thing . . . culling through it all! Sometimes there’s so much to choose from that I feel like a kid in a candy story.  There is much excited email chatter among the many Cassini teams, all suggesting awesome findings.  These first-looks are being matured by the team members, and we have begun to share and compare results. 

You may have already seen the press release from JPL explaining that the
Cosmic Dust Analyzer (CDA) had an unfortunate software hiccup at closest approach to Enceladus and their data was not recorded. The CDA instrument measures the composition of small particles that hit the instrument, which is an important thing to do at Enceladus to understand its geyser-like jets.  But like all small bumps on the road to discovery, we will find out what happened, fix it and get on with our business about the Saturn system.  And what an amazing system it is. 
 
On the very bright side, all of the other fields and particles instruments and remote sensing instruments, worked perfectly at Enceladus.  They are returning fantastic data and providing an incredible look around and inside the plume, and of the surface.  The fields and particles instruments are complementary to CDA and provide information on particle composition and characteristics, among other things.   
 
As soon as possible in the week or two ahead, we will be able to announce the preliminary results to the world.  Until then, I’m waiting like the rest of you are for these data sets to be analyzed, since the first-looks are looking so great!  Stay tuned for some Earth-shaking — I mean moon-shaking — results!
 
–Linda
 

A First Peek at the Data

John SpencerJohn Spencer, Cassini Scientist on the Composite Infrared Spectrometer (bio

Yesterday was a long day of waiting for our Composite Infrared
Spectrometer (CIRS) data from Wednesday’s Enceladus flyby.  CIRS’s
most important job on this encounter was to map the temperatures in
the active south polar region, to learn more about what warms the
“tiger stripe” fractures and measure the total amount of heat that
Enceladus is generating (the current estimate, based on earlier CIRS
data, is a whopping 6 GigaWatts).  Before I and others could do much
with the new data, they had to be calibrated, and calibration of CIRS
data, which is done by the CIRS team at Goddard Spaceflight Center in
Maryland, is pretty complicated.  It turned out there were some
hiccups in the calibration process, and though the team was working
as fast as they could, everything took longer than expected.

So all through the morning I was reading excited e-mails from members
of other instrument teams, enthusiastically describing their first
look at their data, without being able to contribute any news from
CIRS.  I *did* copy over some files early in the day, but when I
learned that they were only partially calibrated, I decided to wait
for the good stuff – I concentrated on getting my software ready instead.

Marcia Segura at Goddard, who did the detailed designs for these
observations, kept me posted on the progress of the work at Goddard,
and by mid-afternoon it looked like the final calibration was still a
couple of hours away.   So I broke down and took a quick-and-dirty
look at the preliminary files I’d downloaded in the morning.  And
they showed …  well, I can’t tell you, because we still need to
properly calibrate and check everything, and make sure we don’t
announce any results that turn out to be wrong on closer inspection.
But I’m pretty happy with what I saw, and we (and the other
instrument teams) hope to have some cool findings to release in the
next few weeks.

Greetings From Houston

                             
Amanda HendrixAmanda Hendrix, Cassini Scientist on the Ultraviolet Imaging Spectrograph
(bio)

So here I am in Houston at the Lunar and Planetary Science Conference (aka LPSC). It’s Tuesday morning and yesterday was an interesting day, filled mainly with results from the first MESSENGER flyby of Mercury. Thursday afternoon there’s a session dedicated to Enceladus with talks on topics such as the possibility of a near-surface ocean, frictional heating, and crater chains. So I’ll be yawning my way through that session — not that it won’t be interesting, but I’m planning to stay up most of Wednesday night to watch my science data come in from tomorrow’s exciting Enceladus flyby! I’m super excited about it, and crossing my fingers that everything goes as planned.  Also, tomorrow at noon, Alan Stern (Associate Administrator of the Science Mission Directorate at NASA HQ) will give a talk — I’m hoping he’ll mention the Enceladus flyby!

More soon from LPSC …

–Amanda

Waiting for Hidden Treasures

Linda SpilkerLinda Spilker, Cassini Deputy Project Scientist

I just got the good news that the playback has ended.  Now for the fun part!   I am eagerly waiting to see what new discoveries are buried in the bits streaming back from Cassini.

All sorts of questions are running through my head.  I wonder if the Ion and Neutral Mass Spectrometer (INMS) will find more exotic hydrocarbons in the gases it samples deeper in Enceladus’ geysers.  Will the magnetometer find an induced magnetic field that points to an ocean just under Enceladus’ crust?  If there is a water ocean, what are the chances that life might exist in it?

As a Composite Infrared Spectrometer (CIRS) co-investigator, I am especially interested in the new thermal maps of the south polar region.  I am eager to find out if any of the hot spots that our instrument saw back in July 2005 disappeared or if any new hot spots appeared, indicating that the geysers might change locations.  Given the golden opportunity to observe Enceladus up close during an eclipse, I wonder how quickly the surface of Enceladus warms up once sunlight hits it again.  With Enceladus’ fluffy surface, will it warm up faster than any other moon circling Saturn?
 
You’d think that being a veteran of icy satellite flybys this would be old hat for me by now, but each flyby is just as exciting as the one before it!

YIPPEE (and PHEW!)

Amanda HendrixAmanda Hendrix, Cassini Scientist on the Ultraviolet Imaging Spectrograph (bio)

Well everyone, this is both exciting and a relief! — the flyby is over and we couldn’t have hoped for a smoother ride! I got word last night (during dinner!) that we had a signal from Cassini, which initially meant that the spacecraft hadn’t safed (always a good thing), and then the data started coming in.  Now, the downlink pass is over, the images are down, and they look wonderful!  I’m busy downloading and having a first look at the Ultraviolet Imaging Spectrograph data (thanks to Alain and crew for getting them into the database so quickly!).
 
Thanks so much to everyone out there for your support and great questions. We have more Enceladus flybys planned for later this year — here’s hoping they all go as nicely as this one. There’s a lot more to come!!
 
Cheers,
Amanda from Houston

A Great Day for Engineering

Todd BarberTodd Barber, Cassini Lead Propulsion Engineer (bio)

Hello again from the other side of Enceladus!  I’m happy to report that the engineering teams are very pleased this morning with this historic Enceladus flyby.  I attended a 9 am weekly meeting regarding engineering subsystem status, and all engineers reported a very nice flyby.  The team includes attitude control, command and data subsystem, power, propulsion, thermal, fault protection, and telecommunications engineers.  Our telecom guy brought in some nice pastries from his favorite European bakery to help celebrate another successful Cassini encounter.  Just before the meeting, I did manage to find five minutes to look at the latest Enceladus images from the flyby–they’re breathtaking!  Makes all of the hard work seem more than worthwhile.

We’d love to celebrate this engineering success, but as I mentioned in a prior blog, the show must go on.  We did open the main-engine cover successfully last night, which is vital for today’s main-engine maneuver.  Around 5:30 pm PDT, as seen on the third rock from the sun, Cassini will fire its main engine for about seventeen seconds.  So, as our science teams digest a treasure trove of new data, the engineering teams are looking forward to a thrilling Titan low-altitude flyby in a few weeks.  This friendly give-and-take between science and engineering isn’t always easy, but it’s truly wonderful how the teams support each other and pull off things that seem impossible.  I’m honored to be a part of this world-class team, and I thank you for your continued support of Cassini!

Todd

Visiting the Icy Outpost of Enceladus


Carolina Martinez

Carolina Martinez, JPL News Team

As we head into the close brush with the geysers of Enceladus, scientists, engineers and the public can come along on the ride as we count down to this amazing flyby, Cassini’s closest flyby yet of any of Saturn’s moons. On this blog we’ll post regular updates directly from the science and spacecraft teams.

Enceladus jumped to the top of scientists’ short list of places to look for life when the mission discovered giant geysers ejecting water-ice crystals and gas into space.  Few people know that Michele Dougherty of Imperial College London and principal investigator on the Magnetometer instrument was the one who pushed to have Cassini’s flyby altitude of 1,300 kilometers lowered to just 175 kilometers during the third Enceladus flyby on July 14, 2005.
 
This was after two flybys of Enceladus in February and March 2005.  Magnetometer data from those flybys showed strange things going on in the magnetic field lines.  Michele and others thought if they could just come close enough, they might be able to figure out what was happening.  She and others convinced the project to change the flyby altitude and lower it substantially. Not an easy task as these things are planned months in advance, but with a little luck and a lot of work everything fell into place and the team went closer.  Lo and behold, the little moon, the brightest in the solar system, was active, and geysers of water and vapor were erupting from mysterious hot spots at the moon’s south pole. 
 
You can see the original news release on the Magnetometer discovering an atmosphere around Enceladus at: https://www.nasa.gov/mission_pages/cassini/media/cassini-031605.html
 
For a timeline of Enceladus discoveries, and a  mission description with flyby details put together by Amanda Hendrix, Cassini scientist on the Ultraviolet Imaging Spectrograph (UVIS), see our media page:  
https://www.nasa.gov/mission_pages/cassini/media/enceladus-20080312.html 

While you’re there, check out the preview video, Taking the Plunge. 
Oh and a real nice Enceladus interactive that lets you leapfrog from place to place all over the little moon is now online: http://saturn.jpl.nasa.gov/multimedia/flash/Enceladus/enceladus.html
 
Stay tuned for exciting events ahead. 
 

Enceladus Play-by-Play Movie

Amanda Hendrix,  Cassini Scientist on the Ultraviolet Imaging Spectrograph (bio)

This is a neat movie (click here to download or click here to watch it) put together by Brent Buffington, on the Cassini Navigation team. I love these kinds of movies, because you can really get a good idea of what the spacecraft is doing during a flyby. Everything goes pretty fast, so you may want to watch this a few times to really absorb what’s going on!

In the big left-hand window (you can see a still from the first frame of the movie below), you can see Cassini and a projection of the active (or “prime”) instrument’s field-of-view (FOV) (see key below). The right-hand windows show a view of what the boresights are seeing. Sometimes they’re staring, sometimes they’re scanning. Generally, since the optical remote sensing (ORS) instruments are pretty much bore-sighted (as shown in the upper right window), that means that when one of them is “prime,” the others are “riding along” and also getting data, resulting in a wonderful multi-wavelength suite of measurements.
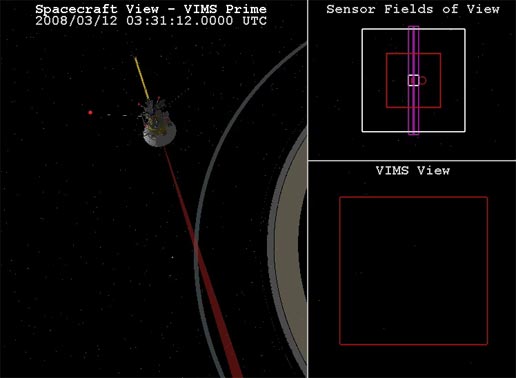
view of Cassini video
So we start off with a long, distant stare, with the Visual and Infrared Mapping Spectrometer (VIMS) prime. Even though Enceladus is still far away and small, staring for such a long time gives all the optical remote sensing instruments a nice chance to build up signal and get a good spectrum, useful especially for investigating surface composition.

After VIMS, ISS (i.e., the camera) takes over for a stare at Enceladus (notice that Enceladus is still smaller than a Narrow Angle Camera–NAC, here). Also notice that the phase angle is pretty high, meaning that the body is only partially illuminated and will appear as a crescent (not unlike our own Moon last night!).

After the cameras, radar does a scan of Enceladus. To do this, we have to turn the spacecraft 90 degrees, since the radar is mounted on the spacecraft at a different orientation from the cameras.

After radar, the Composite Infrared Spectrometer (CIRS) is prime and does a scan and a stare to get temperature information, of the north polar region.

Then Ultraviolet Imaging Spectrograph (UVIS) does a slow scan of Enceladus to do surface composition (and potentially gas) measurements.

The Composite Infrared Spectrometer then does another scan (notice that we are getting pretty close to Enceladus and it’s looking bigger!).

For the final remote sensing observation before closest approach, the camera system does a three-panel mosaic of the cratered northern hemisphere. This will be our best look yet at this terrain.

After the cameras, the spacecraft does a big turn to put the in situ instruments’ sensors into the proper orientation for the closest approach (facing into the direction of motion, so they can “scoop up” particles around Enceladus). Remember that the closest approach (about 50 kilometers, or 31 miles) occurs near 20 degrees south latitude – not in the plume. About a minute after the closest-approach, we’ll be over the south pole and in the plume (at about 641 kilometers, or 398 miles). So we’re diving in the plume a little more than we’ve done before! The in situ instruments will get great measurements of particle size and composition, and gas composition, both in the plume and close to the surface of Enceladus.

Now, it isn’t obvious from this movie, but Enceladus goes into eclipse (i.e., it passes into the shadow behind Saturn), very close to the time that Cassini is making its closest approach, and remains in eclipse for a couple of hours. This is a prime opportunity for the Composite Infrared Spectrometer to do temperature mapping of the hot, active south pole region (which is now in view, after Cassini has swung through its closest approach), with no contribution or heating from solar illumination. The other remote sensing instruments will ride along, but without light from the sun, it isn’t clear exactly what they’ll measure – so that will be a surprise! While Enceladus is in eclipse is also a nice time to do radar measurements (radar doesn’t need the sun to illuminate the surface), which we do next, followed by another Composite Infrared Spectrometer scan, post-eclipse.

We complete the flyby with an Ultraviolet Imaging Spectrograph-prime stare at Enceladus (note that by this time, Enceladus is distant and small again), followed by a turn to Earth to downlink the data!

Key to instrument Field of Views:

Optical Remote Sensing, or ORS, instruments:
UVIS (Ultraviolet Imaging Spectrograph) – long narrow magenta field of view
VIMS (Visible-Infrared Mapping Spectrometer) – big red square
ISS (Imaging Subsystem, i.e., the camera) – white square (small=Narrow Angle Camera; large=Wide Angle Camera)
CIRS (Composite Infrared Spectrometer) – red circular field of view and two small red parallel narrow fields of views

HGA – high gain antenna, used for communication with Earth

Radar – green circle (centered on the high gain antenna)

Cheers,
Amanda, still in Houston