Catching Our Breaths: Getting Ready For More

Amanda HendrixAmanda Hendrix
Cassini scientist on the Ultraviolet Imaging Spectrograph (bio)

Hi everyone, Just got back from the DPS science meeting in Ithaca, NY (where lots of great Enceladus results from previous flybys were presented!).  It was a busy week but I got a chance to have a quick look at the new UVIS data from last week’s flyby. It looks good!!

Looks like we got some really good-quality data, and we’ll be able to say something about surface composition at the south pole, and potentially about variations in surface composition, as well as about the environment around Enceladus. I need to dig much deeper into the data though, before I say anything more!

Wow. I have to say, even though it’s pretty hectic to analyze new data while going to meetings and giving talks and writing papers (all at once)– and all the while preparing for the next flyby (Oct.31!) –it is so useful to have multiple flybys of Enceladus.  Enceladus is such a crazy and dynamic object, that it is incredibly vital to get multiple observations and flybys to be able to really find out what’s going on. Hearing some of the DPS talks on Enceladus made me feel like we’re just starting to get enough data to begin looking at trends and really get to know Enceladus. So it’s really getting exciting. So even though this flyby went very smoothly, we can’t get all the data we need to understand Enceladus on just one flyby! This is partly because Cassini is a complicated spacecraft and not all instruments can get data optimally at once, but also because Enceladus is so interesting and puzzling that many flybys are required to start to understand it.

Anyway, that’s all for now. Thanks for your support and interest!

Amanda.

Waiting,Patiently . . .

Sascha KempfSascha Kempf
Cassini Scientist on Cosmic Dust Analyzer


Right now we are excited that we collected many mass spectra of fresh dust emerging from Enceladus.  Mass spectra provide information about the composition of the particles.  We obtained about 1,500 spectra during the flyby.


We just started the data reduction process which may take some time. Like many of you, we are all eager to know what this data are telling us; however our data require careful analysis and interpretation. 


Our mass spectrometer is not like instruments you find in university labs. In space we cannot just catch the particle and prepare it carefully for examination– the particles hit the detector with a speed of about 18 kilometers per second (40,000 miles per hour). Instead, we analyze the composition of the plasma created by the striking particles. The plasma constituents are separated in a strong electric field and accelerated toward a multiplier at the instrument centre. From the ions’ time of flight we get the ion masses and finally the composition of the particle–in theory.  In reality things are much more difficult because within the plasma, the ionized atoms and molecules react with each other and form new compounds. Thus, to interpret an impact ionization mass spectrum correctly we have to understand the chemistry going on in the impact plasma.  In other words, things aren’t always clear cut: a Carbon Monoxide (CO) reading does not necessarily imply that the grain really contains CO. 


We are working hard in Heidelberg and as soon as we are certain of our results, we will share it with all of you.  This could take several weeks.  So we wait patiently for the news to unfold on this tiny moon.


–Sascha from Heidelberg, Germany


We Sniffed the Plume!

Sascha KempfSascha Kempf
Cassini Scientist on Cosmic Dust Analyzer


Everything went great for the Cosmic Dust Analyzer (CDA) during this flyby. We got good data during the entire flyby—before, during and after closest approach. We recorded mass spectra even in the deep plume with no data gaps as far as I can see.

The High Rate Data rate count profile shows pronounced peaks at the time we traversed the jets. This data is key for pinning down the structure of the dust jets.

None of it would have been possible without an excellent team overseeing the instrument and the team at JPL for flying us through. Now we are looking ahead to an exciting period of evaluation.

–Sascha, who is heading off to pick up the kids from school.

Where No Hoover Has Gone Before

Sascha KempfSascha Kempf
Cassini Scientist on Cosmic Dust Analyzer


Cassini’s closest flyby so far of Enceladus is rapidly approaching, and we here at the Max Planck Institute for Nuclear Physics in Heidelberg, Germany, can’t bear the suspense any longer. Our team has built and operates the Cosmic Dust Analyzer, CDA.

CDA is part of Cassini’s suite of magnetospheric  and plasma science, or MAPS instruments, and is capable of determining the mass, speed, composition, and electrostatic charge of typically micron-sized grains, so called dust, striking the detector with speeds of a few tens of kilometes per second (how many miles is that?). Dust particles can tell us a lot about the Saturnian system, because each grain is a messenger and a participant in the physical processes responsible for forming Saturn’s magnificent rings, structuring the planet’s magnetosphere, and reshaping the surfaces of its moons. Like photons, dust particles carry precious information about their site of origin and about their history.

So what does the CDA team want to achieve during this flyby? Enceladus is the major dust producer of the E ring. Most of the particles are emerging from the plumes in the moon’s unusually warm south pole region. Those particles tell us a lot about the conditions inside the surface fractures, where the particles condense from the water vapor ascending through the cracks. There is, however, a second, although less effective way that Enceladus produces fresh dust: fast impacts by either interplanetary meteoroids or by ring particles onto the moon’s surface
produce many new particles—the surface ejecta. We believe that the composition of these ejecta differs from that of the plume particles, and this is one of the main goals of this flyby. If this turns out be true then we can follow the evolution of plume particles through the E ring until their end of life. This knowledge would also help us to understand whether the plumes’ exhaust is deposited on the surface of Enceladus and if so, how much We need just the right geometry to accomplish this goal since we can observe the surface ejecta only when the spacecraft is very close to the Enceladus surface but outside the south pole region.  That’s because the Enceladus plumes are such a strong dust source.

The upcoming encounter is just right for our needs. Around the closest approach, just 25 kilometers (16 miles) from Enceladus’ surface we hope to scoop particles that come directly from the moon’s surface. Later on, when Cassini traverses the dust plumes, we hope to collect genuine plume particles. This approach worked quite well during the last encounter in August.

We can hardly wait!

Enceladus,Here We Come!

Amanda HendrixAmanda Hendrix
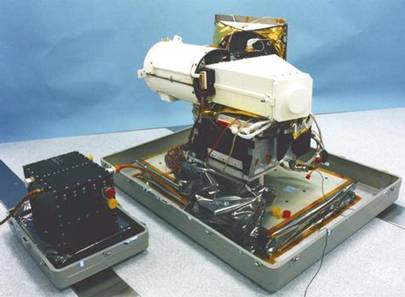
Cassini scientist on the Ultraviolet Imaging Spectrograph(bio)

Hi everybody! I’m very excited about today’s Enceladus flyby, which will take us deeper into the plume than we’ve ever been before! Here’s the scoop on the science activities that will take place during the encounter, accompanied by a neat movie provided by Cassini navigator Brent Buffington. Click here to see the movie (30Mb).

We’ve posted these types of movies for previous flybys, but in case you haven’t seen one before, here’s the setup: the left-hand panel shows the spacecraft and its relationship to Enceladus and will indicate the view of the “prime” instrument by showing its viewing frustum in the color corresponding to that instrument. The upper right panel shows the fields-of-view of the remote sensing instruments (i.e. the cameras and the imaging spectrometers), and the lower right panel shows the “active” field-of-view, since at any time, one instrument is “prime” (though other instruments may be simultaneously taking data, while “riding along”). (By the way, you can go to the end of this post for a key to help watch the animation.)

view from Cassini flyby animationNow, this flyby has a similar trajectory to the previous two flybys in March and August: a fast, inclined path coming in over the northern hemisphere and leaving over the southern hemisphere, with closest approach at a low latitude. Recall that summer in the southern hemisphere is winding down, meaning that the active “tiger stripe” region is illuminated by the sun less and less every day. CIRS and RADAR can see in the dark and don’t care too much about solar illumination, but ISS, UVIS and VIMS usually measure solar light reflected from the surface—so opportunities to measure the wild south pole using these methods are dwindling!

OK, so the movie starts while we’re inbound to Enceladus, about eight hours before closest approach, when RADAR makes measurements to get at centimeter-scale roughness and to investigate the energy balance in the upper layers of the surface – so you can see the green circle doing repeated scans over Enceladus. The scans are accomplished by slewing the entire spacecraft.

Then the spacecraft turns 90 degrees so that the remote sensing instruments can point at Enceladus. First CIRS is prime and does a series of stares and scans. CIRS measures the temperature of the surface. Fellow blogger John Spencer will probably tell you later more about CIRS measurements, which are super important and interesting at Enceladus.

After CIRS, we’re about two hours from closest approach, and UVIS is prime, starting from several radii away from the body and slowing scanning onto Enceladus, to map out any neutral gases, such as oxygen or hydrogen, that are present in the vicinity.

When UVIS is finished with the slow scan, the spacecraft executes a big turn to put the fields-and-particles instruments (especially CDA and INMS) into position to “scoop up” dust particles and gas species during closest approach and while in the plume. Such a close approach and relatively deep plume passage are going to provide really interesting and key results on plume composition and also the composition of material sputtered from the surface away from the plume. (Note that during the closest approach period, the remote sensing instrument boresights are actually on the planet – see the upper right panel – though they’re not taking data.)

Closest approach goes by quickly (we whiz by at nearly 40,000 mph!), and about 15 minutes after closest approach, the spacecraft turns so that the remote sensing instruments can check out the south pole. ISS is prime first, for about 30 minutes, to image the active tiger stripes while Enceladus is in sunlight. Then CIRS takes over, and at around 19:52, Enceladus will enter eclipse, and will be in eclipse for about 2.5 hours, so CIRS will be able to map south polar surface temperatures without the influence of solar input.

Finally the Enceladus sequence ends with a distant view of the body with UVIS as prime instrument!  That’s the instrument I work on.

I’ll report again on progress, from the DPS science meeting in Ithaca, NY.

It’s going to be great! Thanks for coming along with us as we fly by this crazy moon.

Amanda

Here’s the key to help watch the animation:
UVIS = magenta long skinny rectangles
CIRS = red circle and red small parallel rectangles
WAC = large white box
NAC = smaller white box
VIMS = red box
RADAR/HGA = green circle

Jackpot!

Carolyn PorcoCarolyn Porco

Cassini Imaging Team Leader


As you can imagine, we Cassini imaging scientists have been bee-busy trying to understand what our recent images from this week’s Enceladus flyby are telling us about the nature of the moon’s south polar surface and sub-surface environments.


I can now report that, so far, we have successfully located the surface sources of the jets for which Enceladus has become renowned.


source of jets on Enceladus
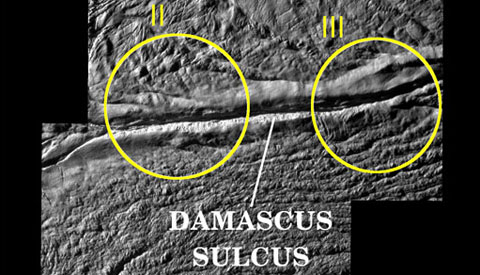
There is still much more to do to see if we can glean any information at all about the eruptive process itself from the geological characteristics we see on the surface.  But this, you have to admit, is a very good start!
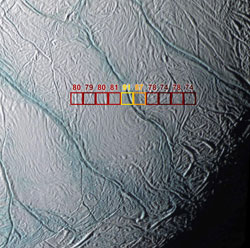
 

Click here for our latest release.


Image left: Surface sources of some jets on Enceladus. Full image and caption


And click here for a similar image.


We Nailed It!

John SpencerJohn Spencer

Cassini Scientist on the Composite Infrared Spectrometer (bio)


Click here to browse Cassini raw images site for Enceladus images


All sorts of emotions over the last couple of days.  Yesterday morning began with the great (but not surprising) news that our trusty spacecraft had successfully negotiated its latest and deepest- yet passage through the Enceladus plume, successfully executed its observations, and was starting to ship its cargo of data home.  There wouldn’t be any calibrated data to look at for hours, so I focused for a while on something much more down-to-Earth: my wife Jane and I put in an hour harvesting produce at a local vegetable garden.   Searching through the luxuriant, dripping-wet foliage for green beans and tomatoes, Jane remarked, “Isn’t it amazing what can happen on a planet that has water on it”?  That of course, is part of the reason why we’re so excited to be exploring Enceladus–the geysers breaking through that intensely cold surface harbor heat, lots of it, maybe enough to melt the ice below the surface and, just maybe, enough to give Enceladus its own chance for life.  Maybe our new Composite Infrared Spectrometer (CIRS) observations of Enceladus’ internal heat, now on their way home, could give us new clues about whether liquid water really does lurk beneath the surface.


close-up view of Enceladus

Image left: This image shows our initial discovery, back in 2005,  that the south polar tiger stripe fractures were warm. Larger view


The rest of the day was an exercise in patience as we waited for the CIRS data to be calibrated at CIRS’s home at NASA’s Goddard Spaceflight Center in Greenbelt, Md., a complicated and time-consuming process.  By late afternoon, right before I had to leave for the evening, we got a nibble–a short sequence of data from the few minutes right after closest approach.  The processed data ended, tantalizingly, just before our planned stare at the active fracture Damascus Sulcus, which we hoped, if targeting was perfect, would give us perhaps our best-yet determination of the temperatures of the tiger stripe fractures.  But something bothered me–CIRS was operating in a mode that I didn’t expect.  Had something gone wrong with the instrument commanding?  It was too late in the day to check with the folks in Maryland.  That worry preyed on my mind all evening, so this morning I pounced on the data as soon as I could, to run some more checks.  To my great relief, everything was fine–I had forgotten that we had planned to use that unfamiliar instrument mode for this unusual close-up observation.  Still, the rest of our data were still not calibrated, and I had to wait a bit longer.


In the meantime, there were the close-up ISS camera images to look at.  Like the other bloggers here, I was blown away by both the quality of the images, which were taken under very difficult 
circumstances, and by the bizarre landscape that they revealed.  Utterly stunning.  Hats off to the imaging team, particularly (as Bonnie and Carolyn also mentioned) to Paul Helfenstein, who sweated for months on the details of planning that sequence.


Then, finally, it was our turn–the Goddard team completed the CIRS calibration this morning, and I downloaded the data.  More nervousness, until the plots started coming up on the screen and showed a beautiful spike in the signal strength, right when we expected to be staring at Damascus.  It was obvious that we were pointing right at the warm fracture, just as planned.  We nailed it!  Not that CIRS gets credit for this bit of precision targeting–the camera team was driving and we were along for the ride.  Credit goes once more to Paul Helfenstein and rest of the ISS team, and also the navigation team who put the spacecraft exactly where it was supposed to be.  Now we have to delve deeper to find out what that beautiful observation of Damascus is telling us.


Seeing The Images For The Very First Time

Bonnie BurattiBonnie J. Buratti  (bio)

Cassini Scientist on the Visual and Infrared Mapping Spectrometer 


What a way to start Cassini’s extended mission! On Tuesday afternoon (Aug. 12, 2008) about 50 scientists sat in the Spaceflight Operations Facility at JPL to view the images as they came down. 


I was as dumbfounded as anyone, but rapt in awe to be among a privileged group of humans to see another part of nature for the first time.  How fantastic that the public can share in this excitement through the raw image gallery .  Those few sublime moments were worth the many months of drudgery that went into planning these observations. Some of the views were of old familiar terrains, roads that we traveled many times. But many of the features revealed were new, and seeing them evoked the same level of astonishment I experienced at my first sight of the Grand Canyon or Niagara Falls. 


Image left: That’s me to the lower left of the image screen. My colleagues and I gathered to look at these raw images from Enceladus.


Inspiring as that first peek at new data was, I am now confronted with Thomas Edison’s cogent remark about the nature of discovery: it’s one percent inspiration and 90 percent perspiration. Much of the most important discoveries to come from this flyby will be squeezed out of the data over the coming days and weeks: teams of scientists poring over the measurements, analyzing, massaging, modeling, thinking, going up blind alleys – that is just the nature of research. It is also very much a team approach, with each member contributing from an area in which they are expert.


Jerry Jones, who heads the Cassini Navigation Team, told the assembled scientists yesterday that we came within one kilometer of our planned trajectory. Instead of a close approach of 50 km (30 miles), we came within 49 km of the surface of Enceladus. That Navigation Team is awesome! Imaging scientist Paul Helfenstein built a clever sequence at closest approach that was designed to place observations right on the hot tiger stripes, and which he nicknamed the “skeet shoot” (explained in Amanda’s first post).  The skeet shoot that was successfully executed on August 11 was equivalent to the clay pigeon being thrown into the air in New York, and the bullet being fired from Pasadena.  Good going, Paul.


How fortunate we are to have the spacecraft alive and well, with all systems and scientific instruments operating. What we saw at Enceladus represents just a small part of what we will learn over the coming years. There are six more targeted flybys of Enceladus coming up over the two years of the extended mission. There is still so much to learn about the ringed planet and its family of moons.  


The Perspective From an Airplane

Amanda HendrixAmanda Hendrix (bio)

Cassini scientist on the Ultraviolet Imaging Spectrograph


Well as luck would have it, much of my day yesterday was spent on an airplane flying to Baltimore for a non-Cassini-related meeting Wednesday and Thursday. I knew the data would be coming in while I was in the air and was excited to check it all out once I landed.  For most flybys, I am in front of my computer, watching the data come in real-time.  So I’m on the flight, and I’m working on some UVIS (Ultraviolet Imaging Spectrograph) Enceladus data from a past flyby that I think will be interesting to compare with the data from Monday’s flyby, and I’m gearing up for the new UVIS data, listening to my iPod (Sigur Ros, which is always nice n’ mellow for a flight) and I hear my name being shouted (above the music) and I look up and it’s Bob Pappalardo, who is sitting one row up across the aisle. He’s the Cassini Project Scientist for the Extended Mission and has been a colleague and good friend of mine for several years. I take out my ear buds and Bob is shouting at me that, just prior to taking off, he received an email from Carolyn Porco (Imaging Team Lead and fellow blogger) that she’d seen the first of the closest-approach images and her reaction was (an informal version of) “Golly!” That got me all excited and I took my laptop over to his row of seats and we checked out the playback table again to review which images were hitting the ground when. I told Bob, “The second we land you must fire up your remote internet access thing so we can get at those images!!”


close-up, raw image of Enceladus

Image left: Here’s an example of a raw image from Enceladus. Click here for the full image


Went back to my seat, experiencing the first waves of absolute thrill that I always get during these flybys, and happiness because I am so lucky to do this for a living! What fun.  I switched to something more upbeat than Sigur Ros … I’m thinking old school Oingo Boingo or maybe some MGMT. I’m excited to see these data!


And now it’s Wednesday morning and we’ve all seen the fabulous images. All the excitement was well-founded. Golly, indeed! I’m having fun digging through the UVIS data and we’ll see what they reveal about the south polar region. What an interesting, fascinating little world. What a surprising bit of insight into solar system processes! Thanks to Paul Helfenstein and the Imaging Team for their hard work on the closest-approach “skeet shoot” and mosaic, and to the entire Cassini spacecraft team for their diligence in making this flyby work so incredibly well!


Cheers from Baltimore,

Amanda

How Hot Is Hot?

Bonnie BurattiBonnie J. Buratti (bio)

Cassini Scientist on the Visual and Infrared Mapping Spectrometer


Figure 1. The best Voyager 2 image of Enceladus, showing the heavily cratered terrain of the northern hemisphere. This image was obtained on Aug. 25, 1981, at a distance of 112,000 km (69, 500 miles).

When I was a graduate student at Cornell University, studying Enceladus with Voyager images, I had this sneaking suspicion that the little moon had active geysers, spewing fresh material into outer space. Why? Because Enceladus is so bright – this gleaming object reflects light as if it were covered in fresh, bright snow. No other body in the Solar System looks quite like it. Voyager never saw the plumes because it flew over the northern hemisphere of Enceladus (Figure 1). The plumes are on the south pole.

So you can imagine how exciting it is to be here at JPL, 27 years later, studying the intriguing surface of Enceladus and its plumes. This moon has literally been a life-long passion of mine. Every time Cassini encounters Enceladus, I feel as if I were right there, in my own personal observatory whizzing by the moon. This time, we are coming within 50 kilometers (30 miles) of the surface, and “all eyes” (cameras and spectrometers) onboard will be peering intently as the moon gets closer and closer.

Figure 2. The Visual Infrared Mapping Spectrometer under construction in a laboratory at JPL (it’s now orbiting Saturn!). The mass of VIMS is 37 kg (82 lbs) and its longest dimension is 78 cm (31 inches). It uses only 22 Watts of power.

I am a member of the Visual Infrared Mapping Spectrometer (VIMS, seen in Figure 2) team, led by Dr. Robert Brown of the University of Arizona. During the flyby, VIMS will be taking images of Enceladus in 356 wavelengths (colors) in the visible and infrared part of the spectrum. When we think of the infrared, we think of heat. One thing Cassini scientists don’t know yet is how hot the hottest parts of the tiger stripes are. If we could detect temperatures at or near the melting point of water, we would know for sure that there is liquid water – maybe even an ocean – under the surface of the moon. The Cassini Composite Infrared Mapping Spectrometer (CIRS) has detected and mapped the thermal energy around the tiger stripes.  During the past three targeted flybys, VIMS, which is only sensitive to much hotter temperatures than CIRS, didn’t detect any thermal energy. But the question now is: are we looking at a tiny area that is very hot, or at a larger area that is not so hot? With the much better spatial resolution attained during today’s flyby, VIMS may be able to observe small hot spots.

Another “hot” topic that interests our team is the presence of organic materials on Enceladus. The moon is almost pure water ice, but we think we found some light organics during our previous flybys. “Organics” are materials composed of hydrogen, carbon, oxygen, and nitrogen, the building blocks of life. With liquid water and the presence of organic material, the conditions on Enceladus may be similar to those in the oceans where life arose on the young Earth.

I am sure that Nature will have more surprises for us in the days ahead.