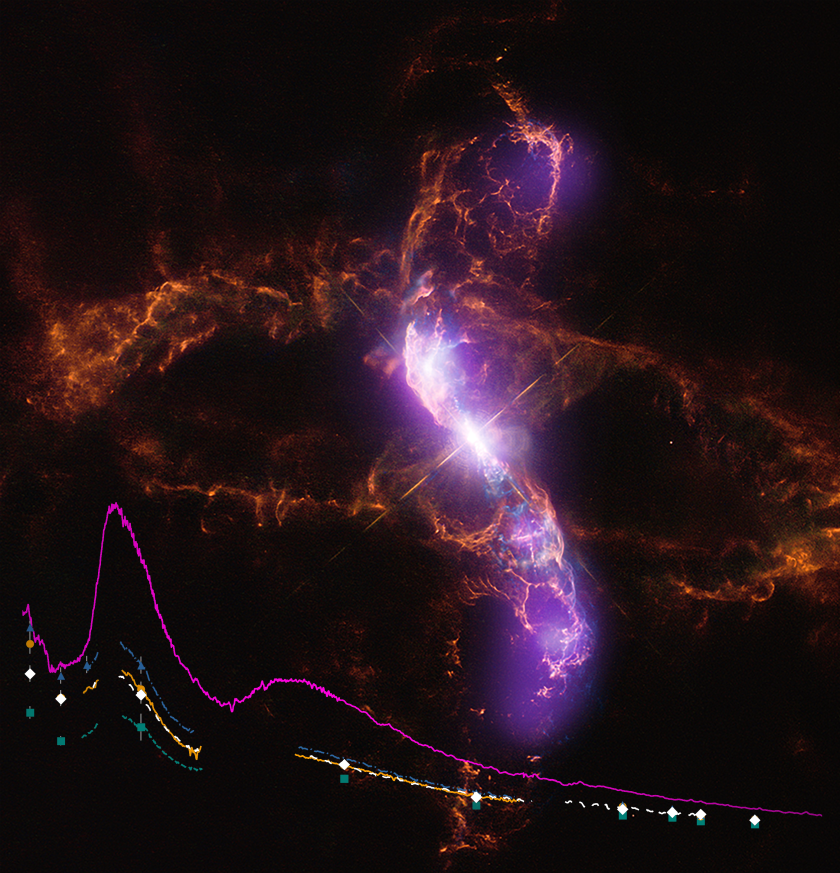
This composite image of R Aquarii resembles a ring of fire over a black field, with a glowing purple “S” flowing through it. Near the center of the image, in the middle of the ring and the “S” wave, is a twinkle of bright white, which is the Mira variable in R Aquarii. The white dwarf is very faint and contributes very little to the optical emission. However, the purple wave is the result of a jet that is powered by the white dwarf accreting dust produced by the Mira variable. The smokey red circles are evidence of explosive events that occurred several hundred years ago.
Overlain atop the composite image of R Aquarii is a set of five plots indicating the energy emitted by the system. SOFIA acquired four of the data sets, while the strong purple plot is data from the Infrared Space Observatory from 1996, when R Aquarii’s emission was strongest. The strength also depends on the phase of the binary star system’s eclipse, so it does not increase each successive year, exactly: the flux fell between 2018 and 2019.
Credit: NASA/CSC/SAO/STScI/Palomar Observatory/DSS/NSF/NRAO/VLA/LCO/IMACS/MMTF/Sankrit et al.