A SHOT IN THE DARK
Chasing the aurora from the world’s northernmost rocket range
Part IV
I • II • III • IV • V • VI • VII
Each day, the science team prepared just the same. At 3 a.m., Rowland opened the giant doors of the Telemetry Readout building, where they were stationed. Over the next five hours, they stepped through instrument preparations, tests, and practice countdowns. It had now reached 8 a.m. on the fourth day of the launch window. Practice was over — it was time to try, once more, for the real thing.
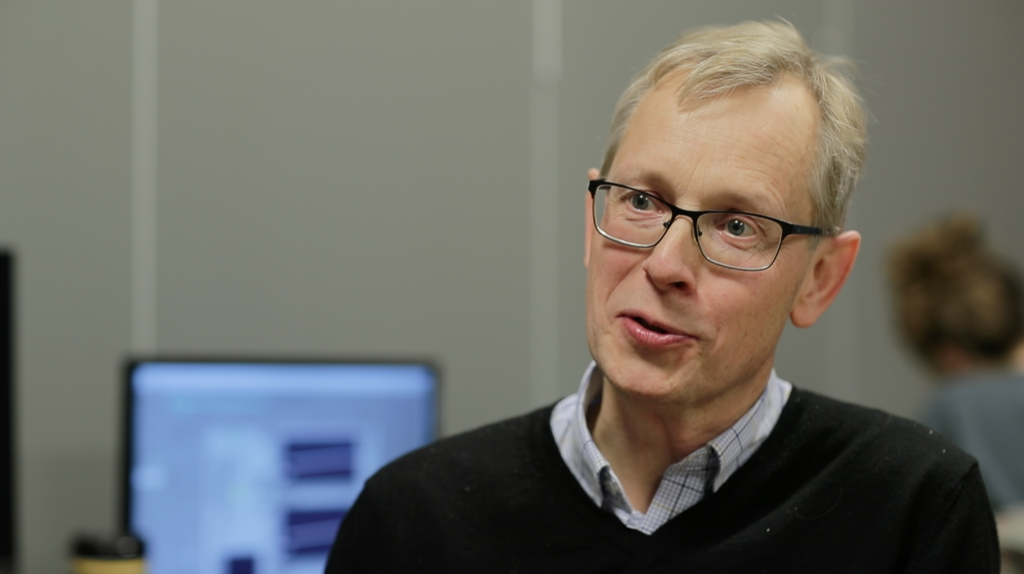
Rowland sat in the front room of the building, hunched over his laptop. Two long tables stretched out to either side of him, stacked with computer monitors of different shapes and sizes. Streams of data danced across their screen, one for each of the 11 instruments on the rocket. These were the rocket’s vital signs, so they watched them meticulously, beginning long before launch. Beside Rowland, Zaccarine, the youngest member of the science team, stared at the temperature readouts from one of the instruments that she’d watched for three days now.
Across the room, Pfaff inspected long sheets of paper showing data from several instruments. Pfaff was familiar with the challenges of launching from Ny-Ålesund, and could advise Rowland on what to look for. But he couldn’t stay long. He was scheduled to deliver two lectures at a science conference back in Washington, D.C., and had almost left that morning. At the last minute, he delayed his flight: The weather seemed promising today.
The rest of the team gathered in the adjacent main hall. Jøran Moen and Andres Spicher from the University of Oslo, a professor and postdoc respectively, sat at a small table, sipping coffee from skinny white mugs. Moen was in charge of one of the instruments, but he also knew the cusp region well. He was one of the chief architects of the Grand Challenge Initiative – Cusp, the international sounding rocket campaign to explore the cusp, of which Rowland’s mission was one part.
Across the room, Matt Zettergren, a professor from Embry-Riddle, was fiddling with cables dangling from his laptop. One clicked into place, and a large screen in the middle of the room came alive. Four scientists gazed up at it, their faces illuminated by the blue-white glow.

This was the Wall of Science, as they playfully called it. Its geometric arrangement of windows resembled farmland seen from a plane. The separate plots of data were beamed back from satellites in space and ground-based instruments. They blinked, shifted, and refreshed each at their own cadence. But each parcel had its own significance, requiring the right attention and know-how to read it. The Wall of Science contained all the information they had to decide whether, and when, to launch.
“This is our upstream space weather buoy,” said Rowland, pointing to a window in the upper right-hand corner of the screen. It was one of three windows that, together, told the story of atmospheric escape, following a gust of solar wind as it approached Earth, flowed through cusp, and triggered the aurora and fountains of escaping oxygen.
The first window showed a red squiggly line stretching across the plot. The data came from NASA’s Advanced Composition Explorer, or ACE satellite, perched one million miles closer to the Sun than we are. The science team looked to this data to see what the solar wind was blowing their way, some 45 minutes to an hour before it hit Earth.
This red squiggly line measured the solar wind’s magnetic field. Like Earth itself, the solar wind is magnetic, with its own north and south pole. But while north, on Earth, points in one steady direction, the solar wind is far less stable. A compass placed inside it would spin from moment to moment, depending on the changing activity on the Sun.
The scientists were waiting for the solar wind to point south, and to stay that way for a while. When a southward-pointed solar wind collided with Earth’s northward-pointed magnetic field, the two would fuse. It was the first step toward the ideal cusp aurora.
The effects of this collision could be seen on Earth, and were displayed in the next window. In two wavelengths of red light emitted by the aurora, it showed the location of the cusp over Svalbard.
At the moment, the cusp was positioned to the northeast of the island, out of range of the rockets’ trajectory. But the arrival of a southward-pointing gust of solar wind would intensify the aurora, dragging the cusp southward, towards the rocket’s planned trajectory.
Once the cusp started shifting south, launchable conditions were closing in. But to fire the rockets, the science team looked to the final window, placed on the far left of the screen. It told them when the aurora had reached its boiling point, and the oxygen was starting to escape. The data were from the EISCAT radar, short for European Incoherent Scatter Scientific Association. The two EISCAT antennas measured the density and temperature of the atmosphere over Ny-Ålesund, and at the peak of the rocket’s trajectory. When oxygen in the air started to boil, they would see it here. It would be time to start the countdown.
There was one more window squeezed into the bottom left corner, the only one that the team itself controlled. It was a simple digital clock. When it struck zero, rockets would fly.