By Miles Hatfield
NASA’s Goddard Space Flight Center
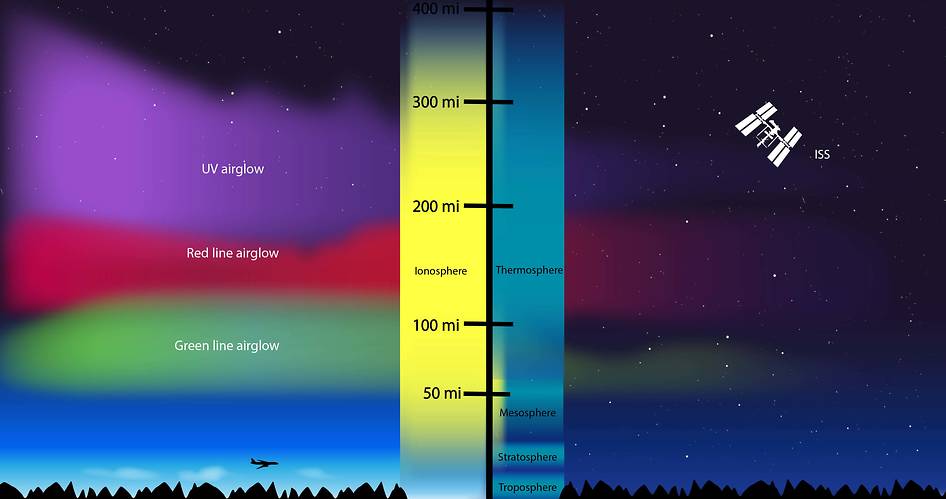
About 50 miles up, Earth’s atmosphere undergoes a fundamental change. It starts at the atomic level, affecting only one out of every million atoms (but with about 91 billion crammed in a pinhead-sized pocket of air, that’s plenty). At that height, unfiltered sunlight begins cleaving atoms into parts. Where there once was an electrically neutral atom, a positively charged ion and negatively charged electron (sometimes several) remain.
The result? The air itself becomes electrified.
Scientists call this region the ionosphere. The ionosphere doesn’t form a physically separated atmospheric layer – the charged particles float amongst their neutral neighbors, like bits of cookie dough in a pint of cookie dough ice cream. Nonetheless, they follow a very different set of rules.

Consider how the ionosphere moves. Charged particles are constrained by magnetism; like railroad cars, they trace Earth’s magnetic field lines back and forth unless something actively derails them. Neutral particles can cross those tracks unfazed – they’re more like passengers crisscrossing as they board and exit at the station.
The ionosphere also reflects radio signals, which pass right through the neutral atmosphere as if it was transparent. (In fact, radio is how the ionosphere was discovered.) Scientists still use ground-based radio waves to study the ionosphere from afar. Learning about the neutral atmosphere, however, usually requires going there – or looking down at it from above.
Despite their differences, the ionosphere and the neutral atmosphere are parts of a larger atmospheric system, where disturbances in one part have a way of spreading to the other. Their connection is explored in a new paper led by Scott England, space physicist at Virginia Tech in Blacksburg and co-investigator for NASA’s Global-scale Observations of the Limb and Disk, or GOLD mission, published in the Journal of Geophysical Research.
England and his coauthors combined ground-based radio signal measurements with special-purpose satellite observations to study whether Traveling Ionospheric Disturbances – waves regularly observed moving through the ionosphere – are at root the same event as Traveling Atmospheric Disturbances, pulses sometimes seen in the neutral atmosphere.
Traveling Ionospheric Disturbances, or TIDs, are giant undulations in the ionosphere, waves that stretch hundreds of miles from peak to peak. They’re are detected with ground-based radar beams, which bounce radars off the ionosphere to detect density enhancements move through.
Traveling Atmospheric Disturbances, or TADs, are gusts of wind that roll through the sky, pushing along neutral atoms as they go. TADs are harder to measure, best observed by flying within them – as some missions have – or by using indirect measures of airglow, the glimmer of oxygen and nitrogen in our atmosphere that brightens and dims as TADs move through it.

TIDs and TADs are measured in quite different ways, and it can be hard to compare across them. Still, many scientists have assumed that if one is present, the other is too.
“There is this assumption that they’re just the same thing,” said England. “But how robust is that assumption? It may be extremely good – but let’s check.”
England designed 3-day campaign to look for TIDs and TADs at the same time and same place.
TIDs were tracked from below, using ground-based radio receivers from stations across the Eastern U.S. Meanwhile, NASA’s Global-scale Observations of the Limb and Disk, or GOLD satellite, was looking for TADs from above, measuring airglow variations to track movements of the neutral atmosphere. But it took a little re-jiggering to see them. GOLD typically scans the whole western hemisphere once every half hour, but that’s too quick a glance at any one location to see a TAD.
“GOLD was never designed to see these things,” said England. “So we devised a campaign where we have it not do what it normally does.”
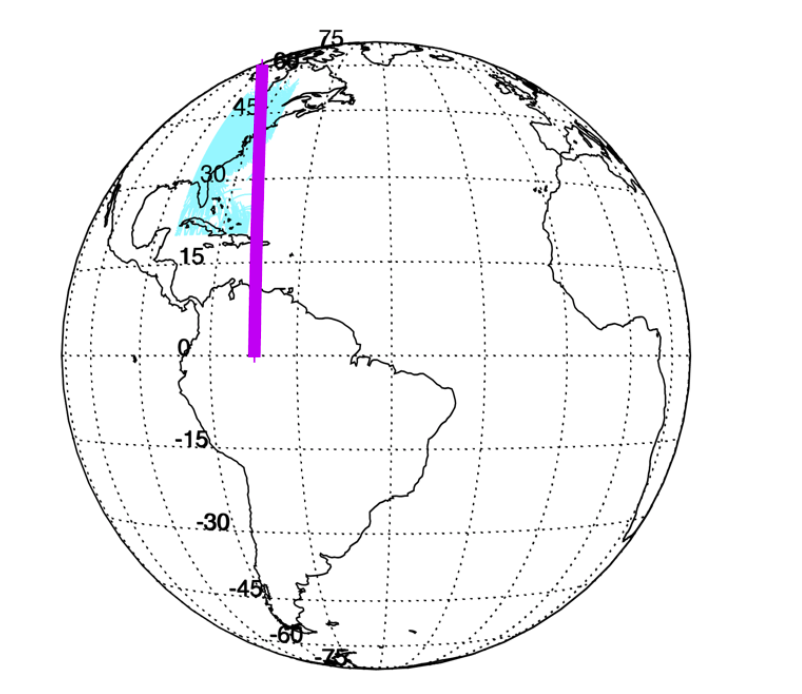
Instead, England directed one of GOLD’s telescopes to stare to along a strip of sky, increasing its detection power 100-fold. That strip is shown below in purple – GOLD’s search space for TADs. The region measured by ground-based radio receivers, which looked for TIDs, is shown in light blue. The region where they overlapped was the focus of England’s study.

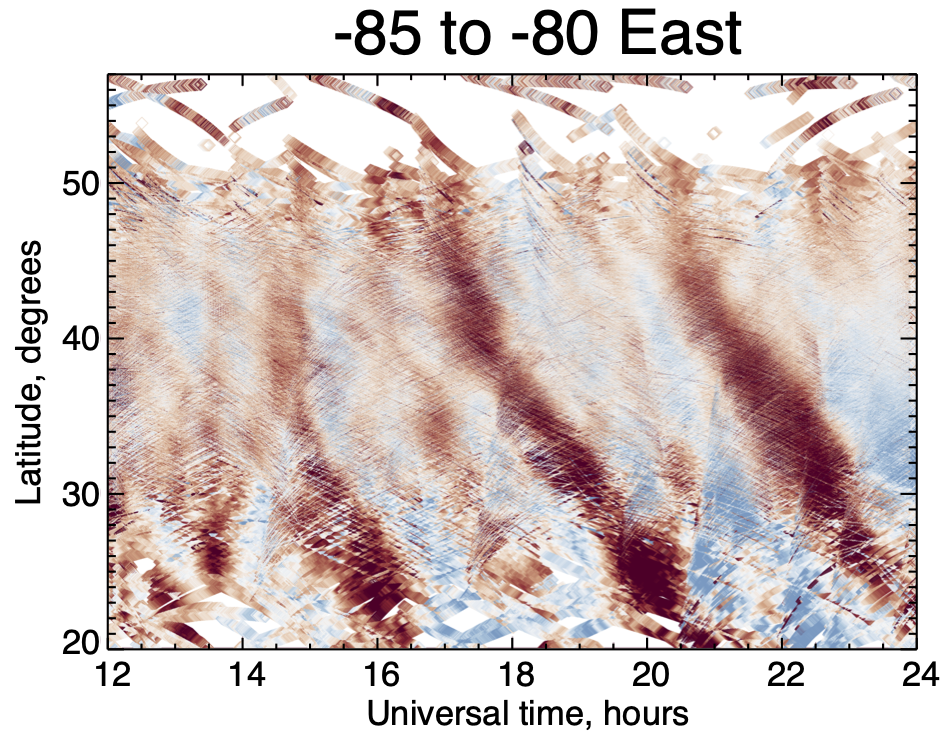
The radio receivers listened for changes in incoming signals, as these modulations could indicate a TID was passing by. The graph below shows the radar results from one of the three days in the campaign. The vertical axis represents latitude – higher up meaning more northern – and the horizontal axis represents time. The different colors show the strength of the signal modulation, dark red being the strongest.

Over a span of 12 hours, three stripes formed in the data. These were TIDs: pulses or density enhancements in the ionosphere moving southward over time.
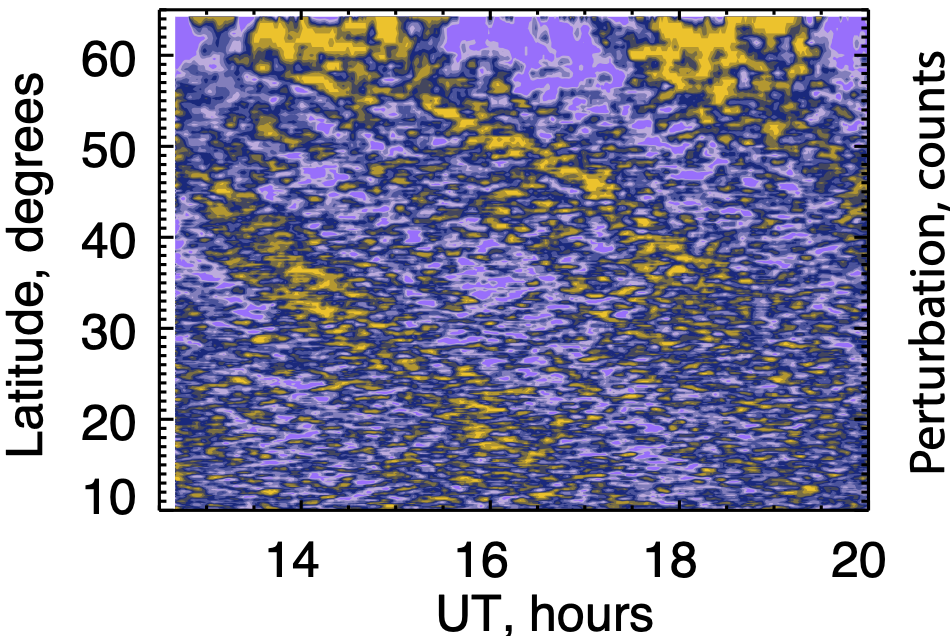
Meanwhile, GOLD was watching light from oxygen and nitrogen to discern the motion of the neutral atmosphere. The graph below shows the results. Note that the latitudes GOLD measured range farther than the radar measurements, from 60 degrees to 10 degrees, but over a slightly shorter period of time, about 8 hours.

It was a weak signal, just above the ambient environmental noise. Still, the faint outlines of TADs – diagonal stripes in the GOLD data – appeared at the same time.
“It’s really at the limit of what GOLD could see – if it was any smaller than this, we wouldn’t see it,” England said.
Aligning the two datasets and correlating them, England found that both sets of ripples moved at about the same rate. Then, with the help of some mathematical models, they tested out the idea that atmospheric gravity waves could be the underlying cause of both.
Gravity waves – not to be confused with gravitational waves, caused by distant supernova explosions and black hole mergers – form when buoyancy pushes air up, and gravity pulls it back down. They’re often created when winds blow against mountain faces, pushing plumes of air upward. Those plumes soon fall back down, but like a line of dominos, the initial “push” cascades all the way to the upper atmosphere.
England and his coauthors linked up a mathematical model of the atmosphere with an airglow simulator. They then mimicked a gravity wave by introducing an artificial sine wave to the models. The resulting simulated data produced similar “stripes,” both in the atmospheric model (TIDs) and the airglow simulator (TADs), indicating that gravity waves could indeed cause both.
So – are TIDs just TADs, as scientists assumed? While the pulses moved together, England’s team found that their amplitude, or size, were not as clearly related. Sometimes a large TID would be associated with a small TAD, and vice versa. Partly that’s because GOLD and the radio receivers don’t measure exact same altitudes – the radio receivers picked up a region about 40 miles above where GOLD could measure. But the largest contributor to that difference is probably the many other phenomena in the atmosphere that we don’t fully understand yet.
“And that makes what we’re looking at hard – but also interesting,” England added.
It will take more than three days of data to fully determine the relationship between TIDs and TADs. But England’s study provides something that virtually all scientists get excited about: a new tool for answering that question.
“We didn’t know if there would be a clear relationship between TIDs and TADs or not. And we certainly seem to have the ability to determine that now,” England said. “We just have to use the GOLD spacecraft instrument to do something we didn’t originally think of.”

