Probing a 100-Year-Old Theory of Plasma Motion for the First Time with NASA’s MMS

By Mara Johnson-Groh
NASA’s Goddard Space Flight Center

Plasma – a fourth state of matter after solid, liquid, and gas where particles have split into charged ions and electrons – is the most common form of matter in the universe. It’s somewhat rare on Earth, but it makes up 99% of the matter in the visible universe. Despite its prevalence, scientists haven’t been able to observationally verify a foundational theory describing how plasma moves in response to electric and magnetic forces. Until now.

With its ultraprecise measurements, NASA’s Magnetospheric Multiscale mission – MMS – has finally measured plasma’s movement on the small scales necessary to see if plasma collectively interacts with electromagnetic fields in the way the fundamental theory predicts, which is described mathematically by the so-called Vlasov equation.

Since the beginning of plasma physics research nearly 100 years ago, the Vlasov equation has often been assumed to be valid for many kinds of plasmas in space. But now the new MMS results, which were published in the journal Nature Physics on July 5, 2021, have allowed scientists to finally see the fundamental plasma variations described in the theory for the first time in nature.

Measuring the basic interactions of space plasmas with electric and magnetic fields helps scientists better understand different mechanisms that fuel energetic space weather events, from auroras to plasma ejections off the Sun, which can interfere with satellites and communications on Earth.
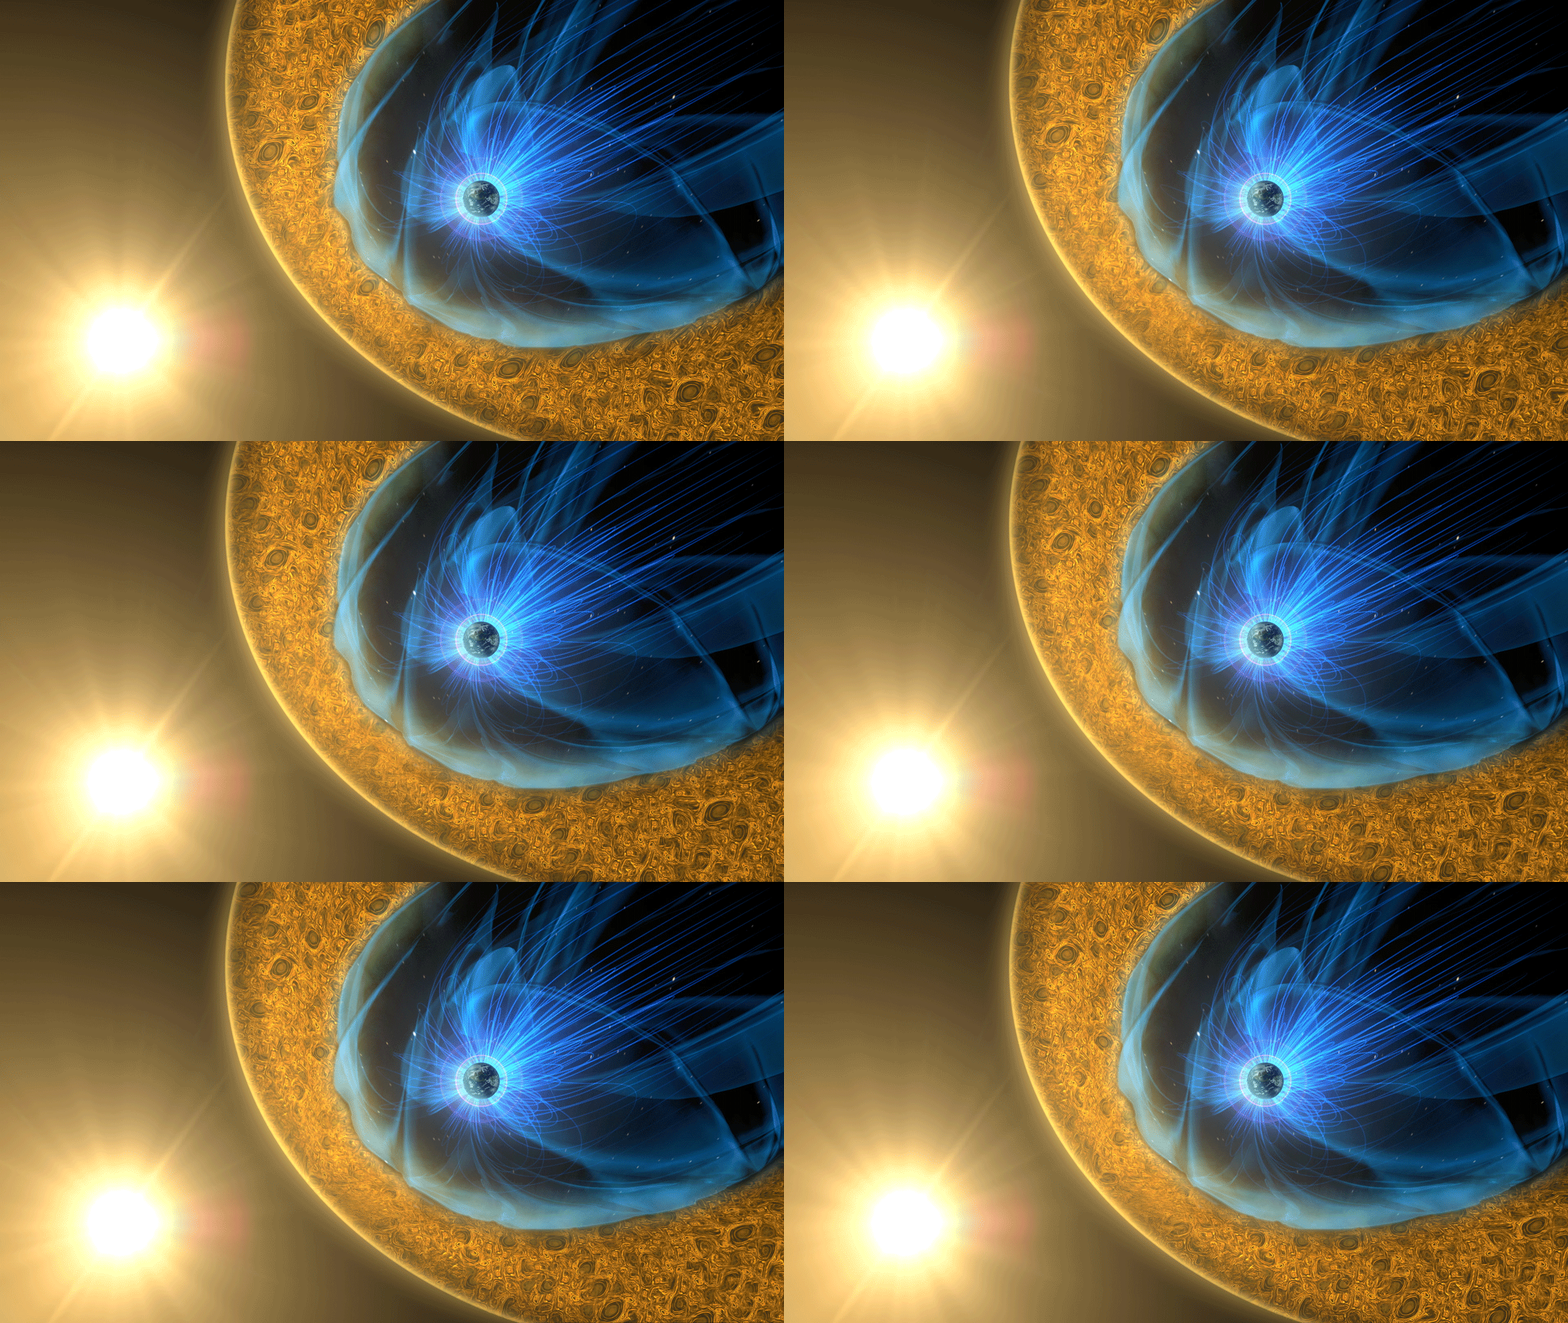
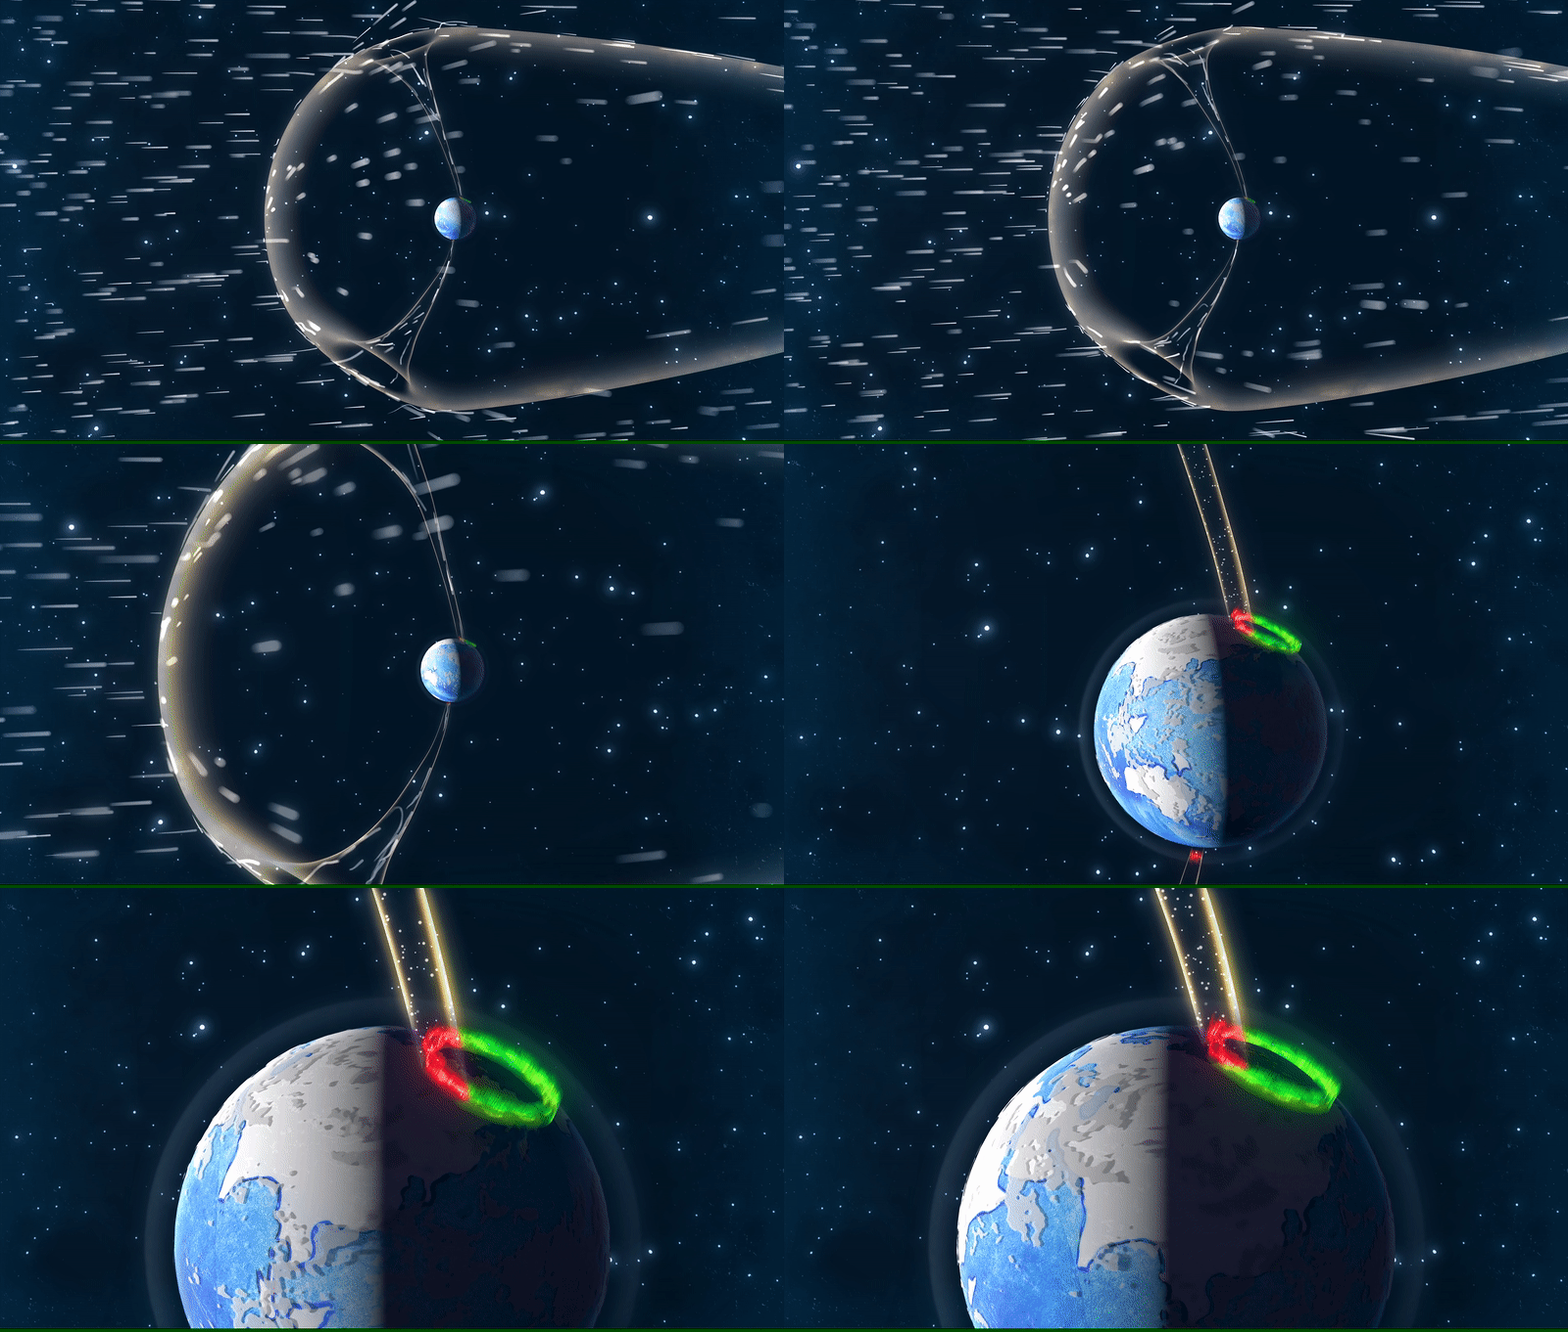
The thin boundary in Earth’s protective magnetic field, or magnetosphere, shown here between the blue and yellow regions, is where NASA’s Magnetospheric Multiscale mission measured terms of the Vlasov equation reported in a new study. The new measurements help scientists better understand how supersonic solar wind plasma particles penetrate the magnetosphere where they can produce auroras and damage communications satellites. Credits: NASA’s Goddard/ Space Flight Center/Mary Pat Hrybyk-Keith/Conceptual Image Lab/Josh Masters

A Century of Plasma Physics Progress

The basic theory of plasma motion originated out of a fundamental theory for gases from the nineteenth century. In the 1890s, an Austrian physicist by the name Ludwig Boltzmann came up with a way to describe the microscopic movement of gases and fluids using statistics. It’s known as the Boltzmann equation, and it’s still taught in physics courses today.

In the 1930s, this work was extended to describe plasmas by Anatoly Vlasov, a Russian physicist. His work specifically described collisionless plasmas, which exist at such high temperatures and low densities that individual plasma particles almost never collide.

Collisionless plasma environments are common in space and can be found in the Sun’s outer atmosphere, solar wind, and in various regions throughout Earth’s magnetic environment, called the magnetosphere.

Unlike ordinary gases, plasmas are electrically charged, as they’re made of positively and negatively charged particles – namely atomic nuclei and their separated electrons. This makes plasmas behave very differently than gases since they are sensitive to electromagnetic forces, which influence their movements. Whereas individual particles in a gas constantly bounce off each other as they erratically travel along, collisionless plasma particles rarely interact and are instead controlled solely by electric and magnetic forces. Vlasov’s equation describes the interplay between plasma particles and electromagnetic fields in these unique collisionless plasma systems – and it has formed the foundation for many ideas about plasmas in the years since.

“The Vlasov equation governs all collisionless plasma phenomena that we know of,” said Jason Shuster, lead author on the new study, Assistant Research Scientist at the University of Maryland in College Park, and MMS scientist at NASA’s Goddard Space Flight Center in Greenbelt, Maryland.

Nevertheless, the terms in the Vlasov equation have never been directly measured because the observation requires seven different types of measurements to be made simultaneously at very small scales in a diffuse plasma – something which is only possible in space.

“In smaller experiments in labs we can’t probe the plasma without disturbing it,” said Barbara Giles, co-author on the new study, Project Scientist for MMS and research scientist at NASA’s Goddard Space Flight Center. “Only in space can we fully immerse instruments within the same phenomenon and accurately test these theories without disturbing the system.”

The MMS Tetrahedron

In 2015, the launch of the four MMS spacecraft changed the way physicists could study plasma in space. Flying in a tetrahedral – or pyramid-shaped – formation with high-resolution instruments, MMS can take measurements far beyond the capabilities of previous spacecraft missions. In their record-breaking tight flying formation, the four MMS spacecraft also fly close enough to measure small-scale properties of plasma, which enabled them to detect variations in terms of the Vlasov equation for the first time.

“With MMS, we can actually probe those minute details at higher resolution than ever before,” Shuster said.

To measure terms in the Vlasov equation, MMS used 64 particle spectrometers – instruments which measure particle energies and charges. The unprecedented spectrometers can simultaneously record multiple types of measurements in position, velocity, and time needed to resolve terms in Vlasov equation. Since each of the four spinning MMS spacecraft has 16 spectrometers sampling particles around its entire circumference, MMS is uniquely able to take these measurements at incredibly high speeds – every 0.03 seconds, which is nearly 100 times faster than previous missions.

“MMS takes advantage of the natural laboratory provided by Earth’s magnetic environment in outer space,” Shuster said. “In the lab, it is very difficult to create a vacuum with a pressure and density low enough to measure the types of electron-scale structures that we’re able to probe with MMS.”

Improving Global Predictions

Now that MMS has observationally confirmed fundamental predictions of the Vlasov equation, this data can be used to better understand phenomena in plasma environments in near-Earth space.

For example, applying small-scale knowledge of plasma to the global-scale magnetosphere can help scientists better understand different mechanisms that fuel energetic space weather events – such as magnetic reconnection, an explosive event unique to plasma that occurs when magnetic field lines sharply reverse direction.

Additionally, just as high- and low-pressure systems create winds and storms on Earth, electric currents and plasma flows drive weather systems in space. Fast moving jets of energetic plasma, such as those scientists observed in this study with MMS, can sustain strong electric currents and pressure gradients which drive space weather phenomena throughout Earth’s magnetic environment.
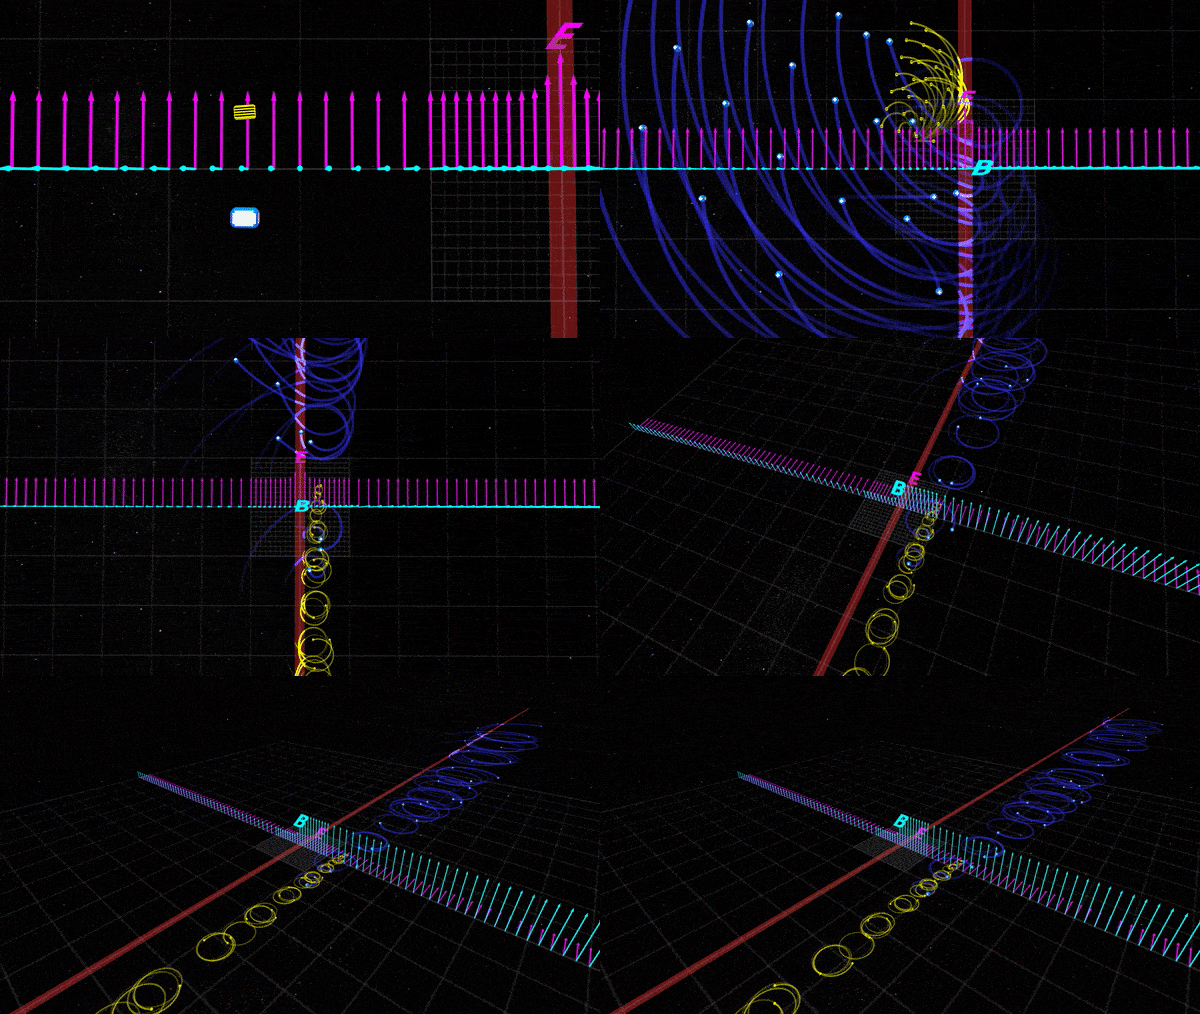
Understanding the acceleration and energization of particles is a big challenge for the field of space physics. Scientists believe thin boundary layers, like the one depicted in this animation, are prime candidates for accelerating particles up to energies high enough that they can penetrate through Earth’s magnetic field and generate strong electric currents that can fuel space weather and geomagnetic storms inside Earth’s magnetosphere. Credit: NASA’s Scientific Visualization Studio/Tom Bridgman/Mara Johnson-Groh

Having direct observations of the terms in the Vlasov equation provides scientists with a deeper understanding of these basic plasma motions, which enables them to predict the triggers of these fundamental plasma processes more accurately.

“The measurements of terms in the Vlasov equation provide information we can use to constrain and increase the accuracy of our global space weather models, which currently rely on large-scale approximations,” Shuster said. “These discoveries improve our ability to predict space weather operating close to home in Earth’s magnetosphere and deepen our overall understanding of plasmas existing throughout the universe.”

The Sun Spot blog logo

What Is a TID? It’s a TAD More Complicated Than We Thought

By Miles Hatfield
NASA’s Goddard Space Flight Center

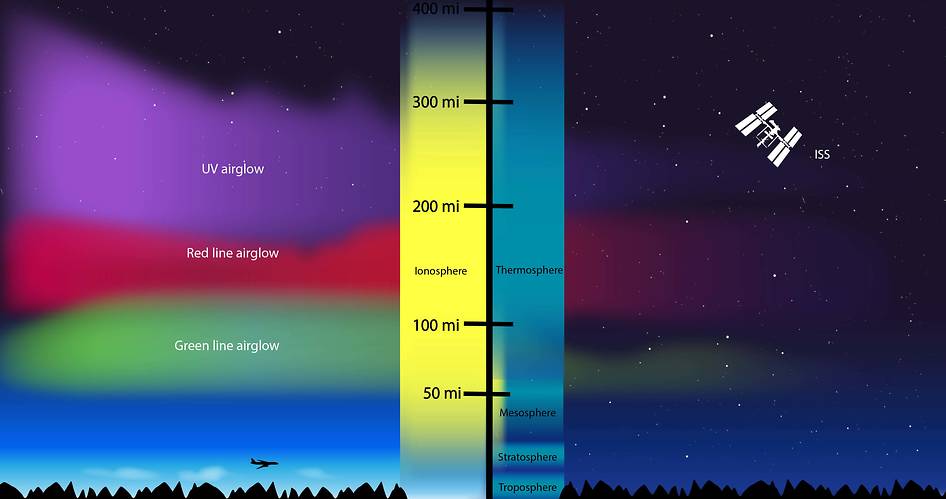
About 50 miles up, Earth’s atmosphere undergoes a fundamental change. It starts at the atomic level, affecting only one out of every million atoms (but with about 91 billion crammed in a pinhead-sized pocket of air, that’s plenty). At that height, unfiltered sunlight begins cleaving atoms into parts. Where there once was an electrically neutral atom, a positively charged ion and negatively charged electron (sometimes several) remain.

The result? The air itself becomes electrified.

Scientists call this region the ionosphere. The ionosphere doesn’t form a physically separated atmospheric layer – the charged particles float amongst their neutral neighbors, like bits of cookie dough in a pint of cookie dough ice cream. Nonetheless, they follow a very different set of rules.

infographic showing the layers of the atmosphere including the ionosphere, as well as the red, green and UV airglow
A layer of charged particles, called the ionosphere, surrounds Earth, extending from about 50 to 400 miles above the surface of the planet. Credits: NASA’s Goddard Space Flight Center/Genna Duberstein

Consider how the ionosphere moves. Charged particles are constrained by magnetism; like railroad cars, they trace Earth’s magnetic field lines back and forth unless something actively derails them. Neutral particles can cross those tracks unfazed – they’re more like passengers crisscrossing as they board and exit at the station.

The ionosphere also reflects radio signals, which pass right through the neutral atmosphere as if it was transparent. (In fact, radio is how the ionosphere was discovered.) Scientists still use ground-based radio waves to study the ionosphere from afar. Learning about the neutral atmosphere, however, usually requires going there – or looking down at it from above.

Despite their differences, the ionosphere and the neutral atmosphere are parts of a larger atmospheric system, where disturbances in one part have a way of spreading to the other. Their connection is explored in a new paper led by Scott England, space physicist at Virginia Tech in Blacksburg and co-investigator for NASA’s Global-scale Observations of the Limb and Disk, or GOLD mission, published in the Journal of Geophysical Research.

England and his coauthors combined ground-based radio signal measurements with special-purpose satellite observations to study whether Traveling Ionospheric Disturbances – waves regularly observed moving through the ionosphere – are at root the same event as Traveling Atmospheric Disturbances, pulses sometimes seen in the neutral atmosphere.

Traveling Ionospheric Disturbances, or TIDs, are giant undulations in the ionosphere, waves that stretch hundreds of miles from peak to peak. They’re are detected with ground-based radar beams, which bounce radars off the ionosphere to detect density enhancements move through.

Traveling Atmospheric Disturbances, or TADs, are gusts of wind that roll through the sky, pushing along neutral atoms as they go. TADs are harder to measure, best observed by flying within them – as some missions have – or by using indirect measures of airglow, the glimmer of oxygen and nitrogen in our atmosphere that brightens and dims as TADs move through it.

A view of Earth's limb showing red airglow
Earth’s limb at night, seen from the International Space Station, with an air glow visual composited into the image. Credit: NASA

TIDs and TADs are measured in quite different ways, and it can be hard to compare across them. Still, many scientists have assumed that if one is present, the other is too.

“There is this assumption that they’re just the same thing,” said England. “But how robust is that assumption? It may be extremely good – but let’s check.”

England designed 3-day campaign to look for TIDs and TADs at the same time and same place.

TIDs were tracked from below, using ground-based radio receivers from stations across the Eastern U.S. Meanwhile, NASA’s Global-scale Observations of the Limb and Disk, or GOLD satellite, was looking for TADs from above, measuring airglow variations to track movements of the neutral atmosphere. But it took a little re-jiggering to see them. GOLD typically scans the whole western hemisphere once every half hour, but that’s too quick a glance at any one location to see a TAD.

“GOLD was never designed to see these things,” said England. “So we devised a campaign where we have it not do what it normally does.”

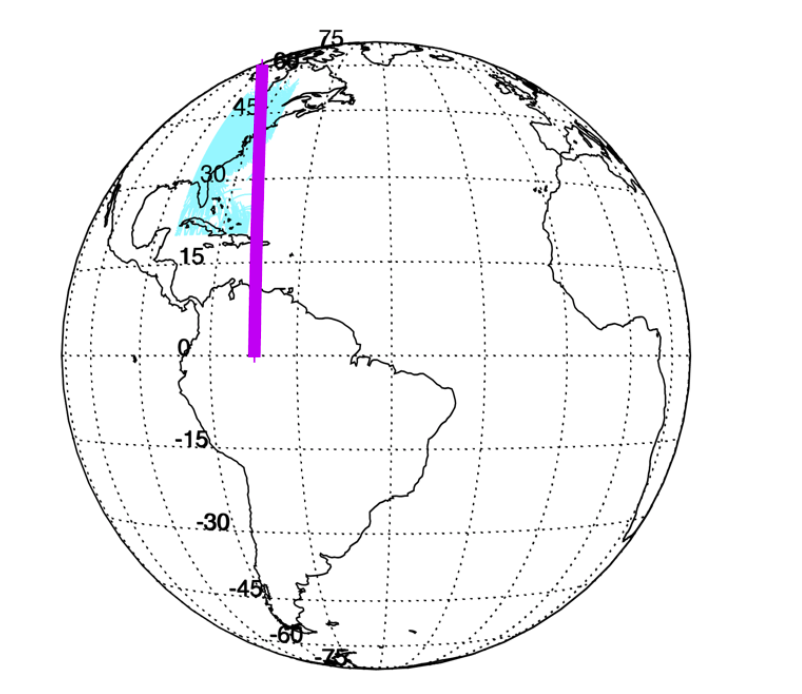
Instead, England directed one of GOLD’s telescopes to stare to along a strip of sky, increasing its detection power 100-fold. That strip is shown below in purple – GOLD’s search space for TADs. The region measured by ground-based radio receivers, which looked for TIDs, is shown in light blue.  The region where they overlapped was the focus of England’s study.

Map of the Earth showing the region covered by the radio-wave measurements and GOLD measurements. The overlap occurs on the east coast of the United States
Location of the GOLD observations during the campaign (purple strip). The light blue region show the locations of the GPS radio data included in this study. Credit: NASA/England et al.

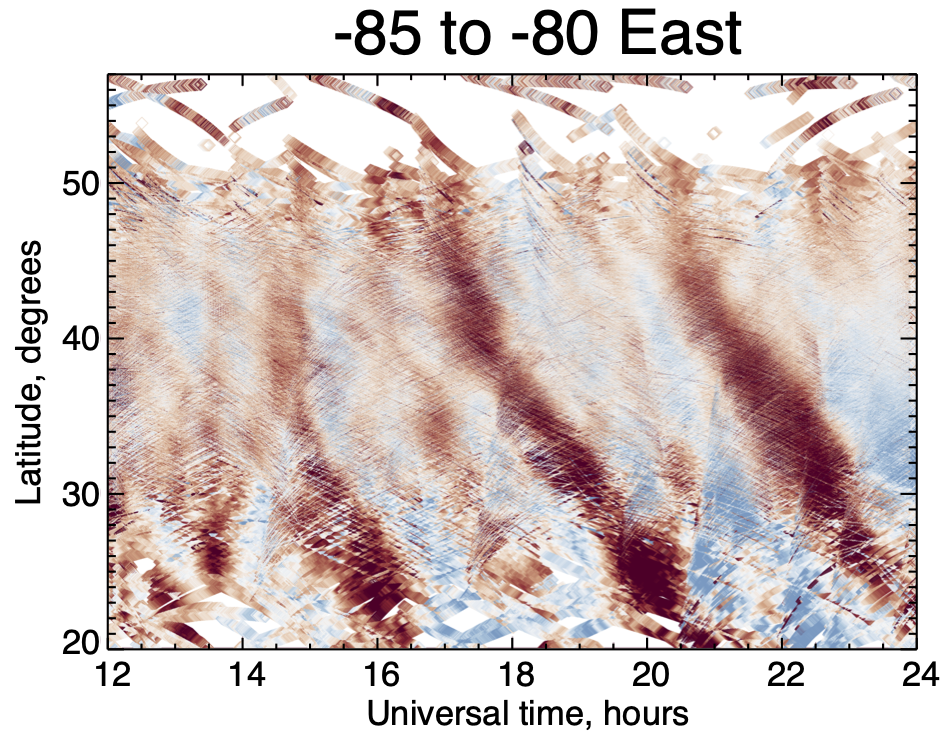
The radio receivers listened for changes in incoming signals, as these modulations could indicate a TID was passing by. The graph below shows the radar results from one of the three days in the campaign. The vertical axis represents latitude – higher up meaning more northern – and the horizontal axis represents time. The different colors show the strength of the signal modulation, dark red being the strongest.

Graph showing red diagonal stripes indicating the presence of TIDs as measured by ground-based radio receivers.
Global Navigation Satellite System differential TEC (dTEC) for October 18, 2019 as a function of latitude and universal time. The range of longitudes included is shown along the vertical axis. Credit: NASA/England et al.

Over a span of 12 hours, three stripes formed in the data. These were TIDs: pulses or density enhancements in the ionosphere moving southward over time.

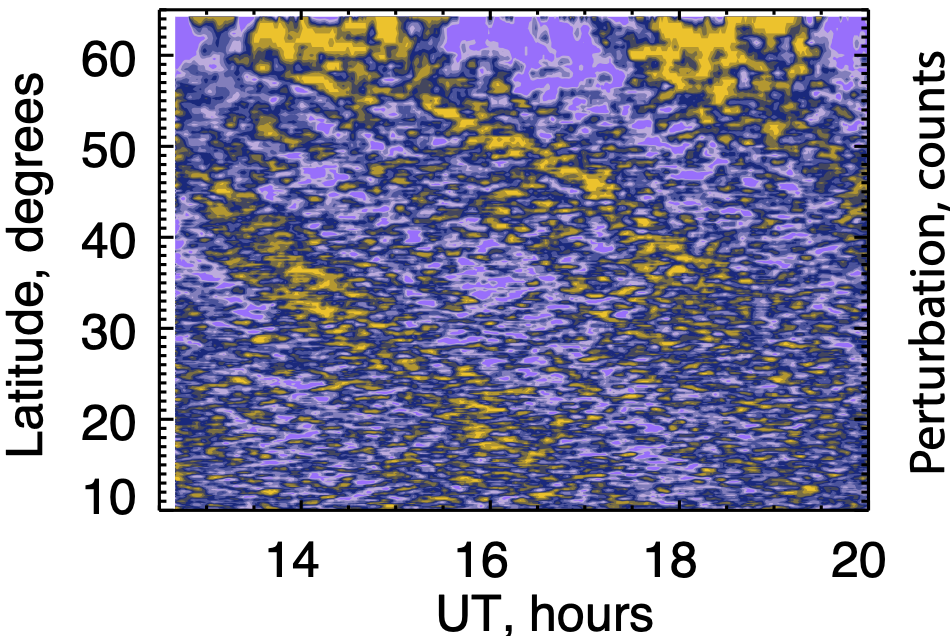
Meanwhile, GOLD was watching light from oxygen and nitrogen to discern the motion of the neutral atmosphere. The graph below shows the results. Note that the latitudes GOLD measured range farther than the radar measurements, from 60 degrees to 10 degrees, but over a slightly shorter period of time, about 8 hours.

graph showing the diagonal stripes of TADs observed by GOLD
Perturbations to the airglow observed on October 18, 2019. As oxygen and nitrogen signals were in counter-phase, this figure shows the perturbation in the oxygen minus twice the nitrogen airglow to highlight the difference. Credit: NASA/England et al.

It was a weak signal, just above the ambient environmental noise. Still, the faint outlines of TADs – diagonal stripes in the GOLD data – appeared at the same time.

“It’s really at the limit of what GOLD could see – if it was any smaller than this, we wouldn’t see it,” England said.

Aligning the two datasets and correlating them, England found that both sets of ripples moved at about the same rate. Then, with the help of some mathematical models, they tested out the idea that atmospheric gravity waves could be the underlying cause of both.

Gravity waves – not to be confused with gravitational waves, caused by distant supernova explosions and black hole mergers – form when buoyancy pushes air up, and gravity pulls it back down. They’re often created when winds blow against mountain faces, pushing plumes of air upward. Those plumes soon fall back down, but like a line of dominos, the initial “push” cascades all the way to the upper atmosphere.

England and his coauthors linked up a mathematical model of the atmosphere with an airglow simulator. They then mimicked a gravity wave by introducing an artificial sine wave to the models. The resulting  simulated data produced similar “stripes,” both in the atmospheric model (TIDs) and the airglow simulator (TADs), indicating that gravity waves could indeed cause both.

So – are TIDs just TADs, as scientists assumed? While the pulses moved together, England’s team found that their amplitude, or size, were not as clearly related. Sometimes a large TID would be associated with a small TAD, and vice versa. Partly that’s because GOLD and the radio receivers don’t measure exact same altitudes – the radio receivers picked up a region about 40 miles above where GOLD could measure. But the largest contributor to that difference is probably the many other phenomena in the atmosphere that we don’t fully understand yet.

“And that makes what we’re looking at hard – but also interesting,” England added.

It will take more than three days of data to fully determine the relationship between TIDs and TADs. But England’s study provides something that virtually all scientists get excited about: a new tool for answering that question.

“We didn’t know if there would be a clear relationship between TIDs and TADs or not. And we certainly seem to have the ability to determine that now,” England said. “We just have to use the GOLD spacecraft instrument to do something we didn’t originally think of.”


What Spring is like on Uranus and Neptune

By Miles Hatfield
NASA’s Goddard Space Flight Center

A new NASA study finds that our distant planetary neighbors, Uranus and Neptune, may have magnetic “seasons:” A time of the year when aurora glow brighter and atmospheric escape may quicken.

Study authors Dan Gershman and Gina DiBraccio, of NASA’s Goddard Space Flight Center in Greenbelt, Maryland, published the results in Geophysical Research Letters. Though these seasonal changes haven’t been directly observed, the results show that a combination of strong solar activity and Uranus’ and Neptune’s unusually tilted magnetic fields is likely to trigger them.

From Mercury to Neptune, every planet in our solar system feels the unceasing stream of the solar wind. This barrage of solar particles, traveling hundreds of miles a second, drags the Sun’s magnetic field out to space, inevitably colliding with planetary magnetic fields.

But each planet responds differently. For planets closer to the Sun, like Mercury and Earth, the solar wind can really shake things up. Strong blasts of solar wind create our northern lights – at their worst, they can even cause electrical surges that lead to blackouts. (Mercury is hit so hard that it can’t even sustain an atmosphere.)

On Jupiter and Saturn, the solar wind’s blast has little effect. This is not because they’re farther away from the Sun – the most important factor is their magnetic fields, which are optimally positioned to protect them. These planets have strong magnetic fields aligned almost perfectly vertically, like a spinning top.  As the solar wind blows past Saturn, for instance, it hits its equator, meeting its magnetic shield where it is strongest.

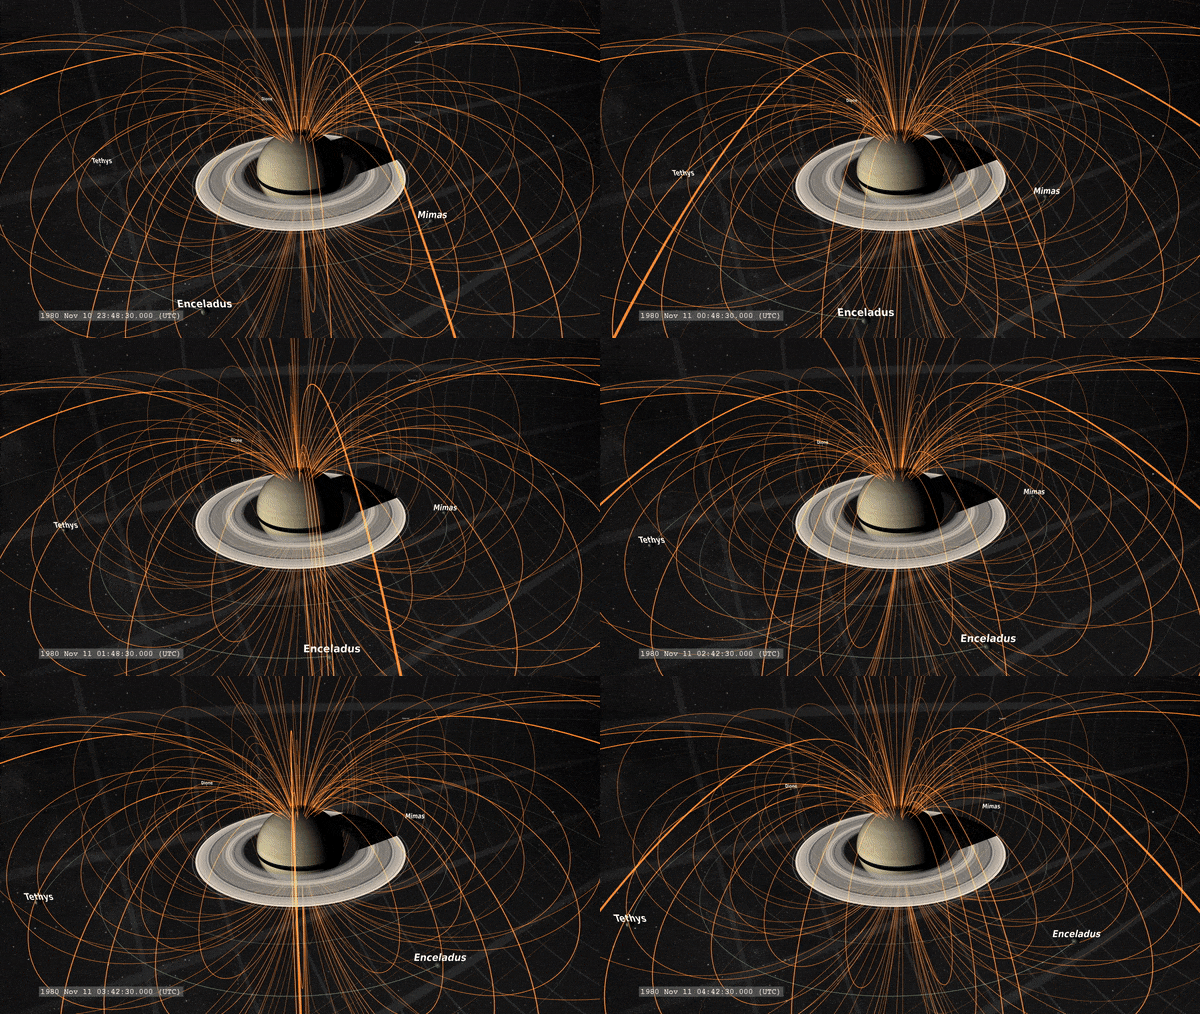
An animation of Saturn’s magnetosphere as measured during the Voyager 1 flyby.
Credits: NASA/Scientific Visualization Studio/Tom Bridgman

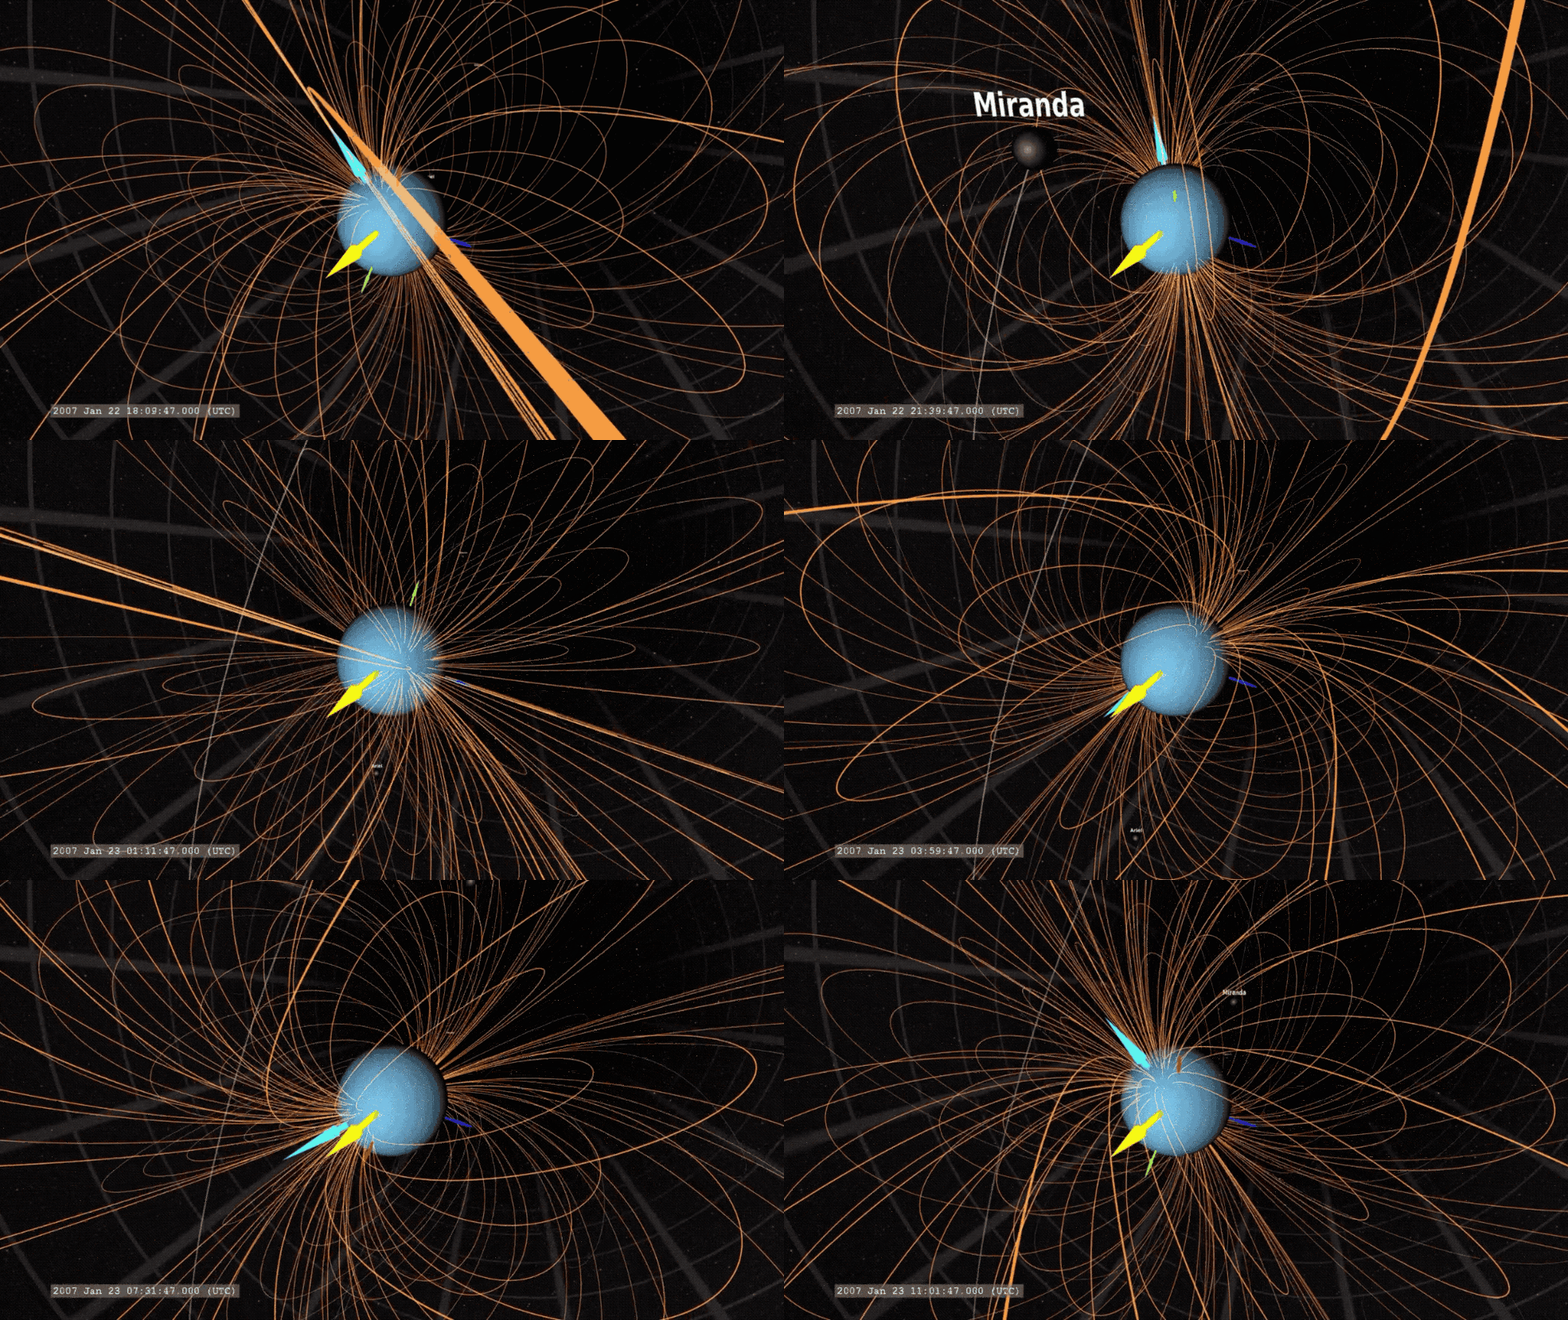
Uranus and Neptune are even farther away from that strong solar wind source, but their magnetic axes make them vulnerable. Uranus’ magnetic axis is tilted by a full 60 degrees. This means that for a portion of its 84-year-long trip around the Sun, the Sun shines almost directly into the planet’s magnetic north pole, where the planet is least protected. Neptune’s axis is similarly tilted – though only by 47 degrees.

Animated GIF showing Uranus’ magnetic field. The yellow arrow points to the Sun, the light blue arrow marks Uranus’ magnetic axis, and the dark blue arrow marks Uranus’ rotation axis.
Credits: NASA/Scientific Visualization Studio/Tom Bridgman

With that background knowledge, Gershman and DiBraccio set out to study how the solar wind would affect the ice giants. Using historical data from the Helios, Pioneer and Voyager spacecrafts, Gershman and DiBraccio measured the Sun’s magnetic field throughout the solar system.

The results showed that during intense conditions, the solar wind can be as impactful near Uranus and Neptune as it normally is near Mercury, some 1.5 billion miles closer to the Sun.

Such intense conditions aren’t even a rarity. The enhanced solar activity Gershman and DiBraccio studied occurs regularly, as part of the 11-year solar cycle. The solar cycle refers to the periodic flipping of the Sun’s magnetic field, in which activity rises and falls.  At the high point, known as solar maximum, the Sun’s magnetic field throughout space can double in strength.

If the Sun enters solar maximum when Uranus or Neptune is at the appropriate angle, the effects, Gershman and DiBraccio argue, could be extreme. These planets so far from the Sun could suddenly be driven by it. Though the seasonal effects have not yet been directly observed, the physics suggests that aurora should brighten and spread further across the planet. Globs of particles known to escape the Uranian atmosphere may do so at a quickened pace. But only a few Earth-years later, it all goes away and the planets enter a new magnetic season.

The only close-up measurements we have of the planets are from the single flyby of Voyager 2 in 1986 and 1989, respectively. But a future NASA mission to the Ice Giants may well change that, giving us the first glimpse of their other-worldly magnetic seasons.

The Sun Spot blog logo

SDO Captures Brilliant Solar Eruption

By Karen Fox
NASA’s Goddard Space Flight Center


Credits: NASA’s Goddard Space Flight Center/SDO
Download this video

This imagery captured by NASA’s Solar Dynamics Observatory shows a solar flare and a subsequent eruption of solar material that occurred over the left limb of the Sun on November 29, 2020.  From its foot point over the limb, some of the light and energy was blocked from reaching Earth – a little like seeing light from a lightbulb with the bottom half covered up.

Also visible in the imagery is an eruption of solar material that achieved escape velocity and moved out into space as a giant cloud of gas and magnetic fields known as a coronal mass ejection, or CME. A third, but invisible, feature of such eruptive events also blew off the Sun: a swarm of fast-moving solar energetic particles. Such particles are guided by the magnetic fields streaming out from the Sun, which, due to the Sun’s constant rotation, point backwards in a big spiral much the way water comes out of a spinning sprinkler. The solar energetic particles, therefore, emerging as they did from a part of the Sun not yet completely rotated into our view, traveled along that magnetic spiral away from Earth toward the other side of the Sun.

While the solar material didn’t head toward Earth, it did pass by some spacecraft: NASA’s Parker Solar Probe, NASA’s STEREO and ESA/NASA’s Solar Orbiter. Equipped to measure magnetic fields and the particles that pass over them, we may be able to study fast-moving solar energetic particles in the observations once they are downloaded. These Sun-watching missions are all part of a larger heliophysics fleet that help us understand both what causes such eruptions on the Sun – as well as how solar activity affects interplanetary space, including near Earth, where they have the potential to affect astronauts and satellites.

To download this video and see other views of the eruption, visit NASA’s Scientific Visualization Studio page.

The Sun Spot blog logo

Small-Class Flare Seen on the Sun

By Mara Johnson-Groh
NASA’s Goddard Space Flight Center

Late on August 16, 2020, the Sun released a burst of light and energy known as a solar flare. This B1-class solar flare – the second smallest class of flare – peaked at 1:26p.m. EDT.

NASA’s Solar Dynamics Observatory observes the Aug. 16, 2020, B-class flare at 131, 171, and 193 angstroms. Credit: NASA/SDO

Solar flares, which are abrupt outbursts of energy and light on the solar surface, are often accompanied by CMEs. B-class flares – or “background” flares – were originally the lowest class of flare before lower level A-class flares were observed. B-class flares are relatively common; there have been at least three B-class flares in the last week.

The recent activity occurred in an otherwise quiet area of the Sun, providing an example of activity that did not originate from a sunspot – the darkened, magnetically active patches on the solar surface that often spawn flares and CMEs.

The flare was first seen by NASA’s Solar Dynamics Observatory, which has kept a constant eye on the Sun for over a decade.


A SHOT IN THE DARK: Part VII

A SHOT IN THE DARK

Chasing the aurora from the world’s northernmost rocket range

Part VII
I • II •​ ​III •​ IV •​ ​V •​ VI​ •​ VII


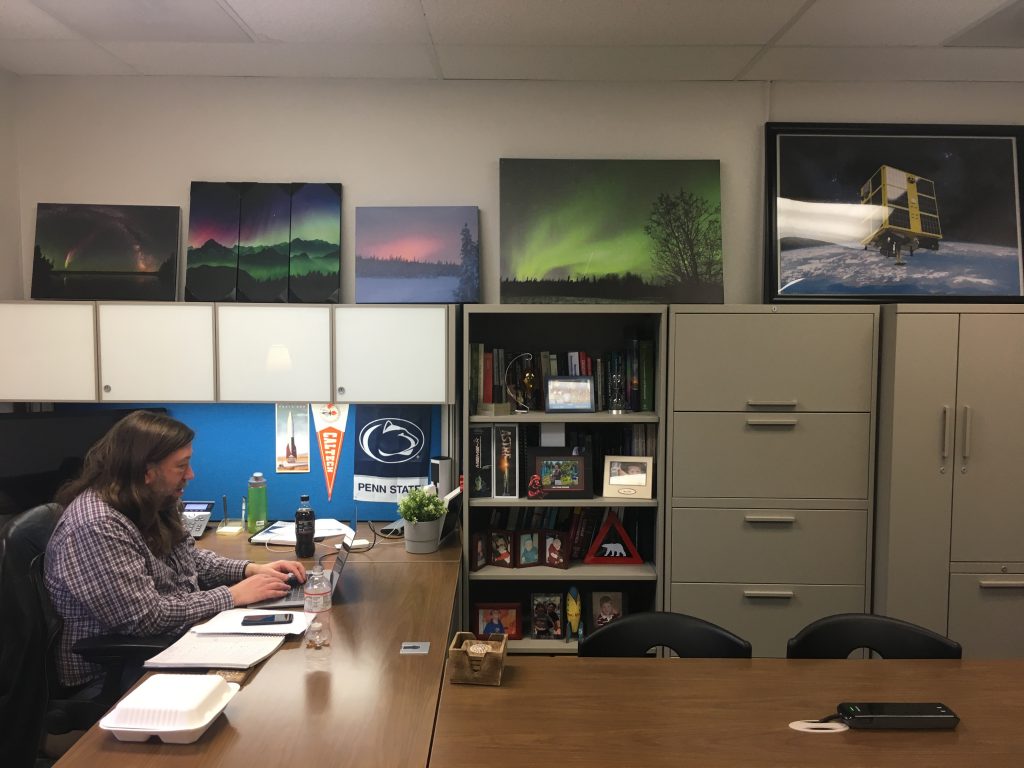
Rowland in his office. Credit: NASA/Miles Hatfield

Three months later, the science team convened at NASA’s Goddard Space Flight Center on the outskirts of Washington, D.C. Button-up shirts replaced down coats, their hair not ruffled from beanies and headlamps. But the mood, an eagerness to proceed, remained. Even Zaccarine — back at school and unable to make the meeting — had spent the past months helping with designs for a new instrument. It would fly on the next mission, VISIONS-3.

The next two days were filled with discussion. Each team member presented their preliminary findings, sharing open questions with the group. Each of the 11 instruments onboard captured a different part of the picture; the findings of one could often explain anomalies in the other. But telling the whole story would require many more meetings like this one.

Pfaff was the last to present, sharing the results from his electric fields experiment before departing for another meeting. The remaining members gathered around a table in Rowland’s new office, to which he had just moved after returning from Ny-Ålesund. By his estimates, Rowland would spend the next year or two here, in front of a computer screen under fluorescent lighting, analyzing data from that 15-minute rocket flight. Around him were mostly the familiar knick-knacks of his old office — books about physics, family pictures, academic regalia. Just to the right of his desk, second shelf from the bottom, was a new trinket. It was a small triangle, outlined in red, framing the silhouette of a polar bear.♦


Watch the video

A SHOT IN THE DARK: Part VI

A SHOT IN THE DARK

Chasing the aurora from the world’s northernmost rocket range

Part VI
I • II •​ ​III •​ IV •​ ​V •​ VI​ •​ VII


Doug Rowland. Credit: NASA/Joy Ng

On the snow-covered balcony, the science team huddled together in t-shirts and indoor slippers, too rushed to don their coats. Everyone was there except Rowland.

The first rocket was already in the air, but many on the team — glued to their computers until the last moments — had missed it. The flight of the second rocket would be their first chance to see the launch.

“Thirty seconds,” an unidentified voice called from inside.

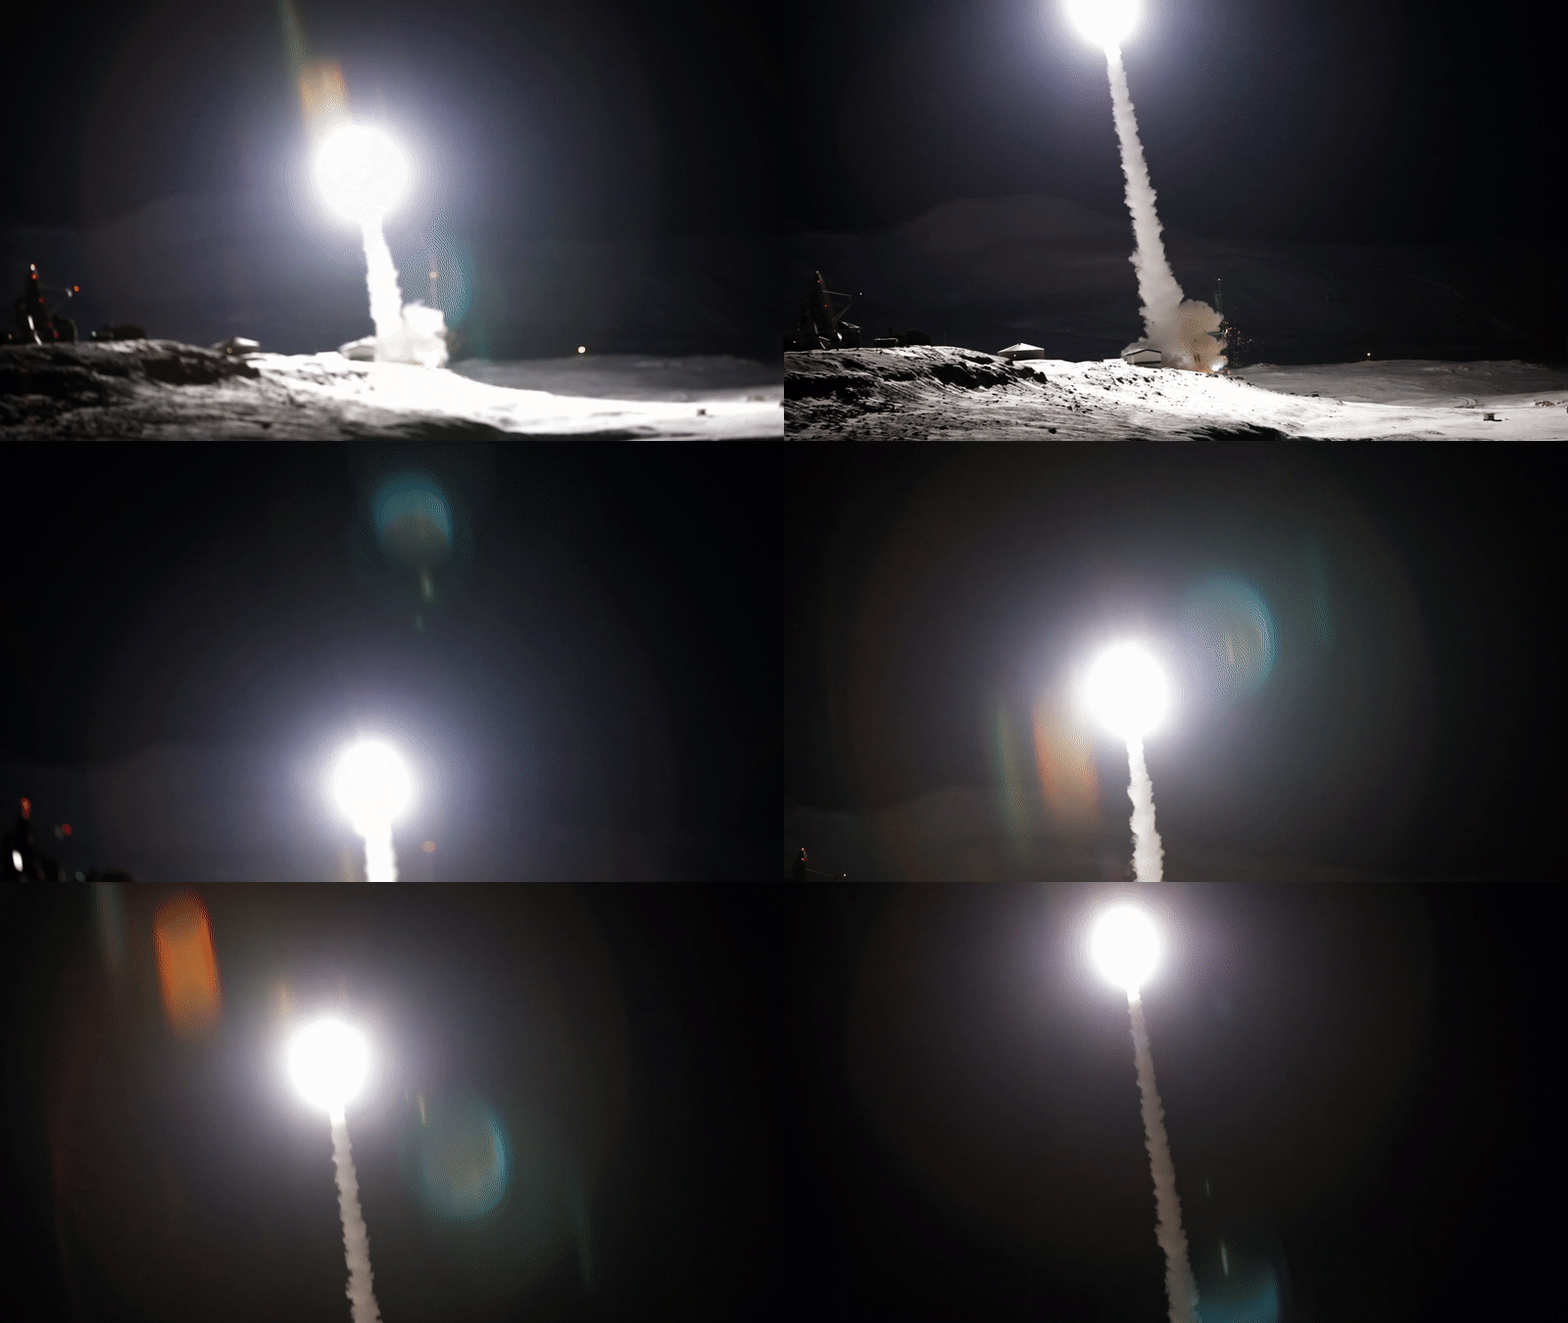
The hall door opened. With only a few moments left, Rowland made his way into the huddle. The crowd lifted their phones to capture the event, but all eyes were off in the distance, staring toward the launchpad. Suddenly, all faces were illuminated. A collective sigh rose up as an intensely bright flash illuminated the terrain. Ny-Ålesund was surrounded by mountains — for the first time, they could see them.

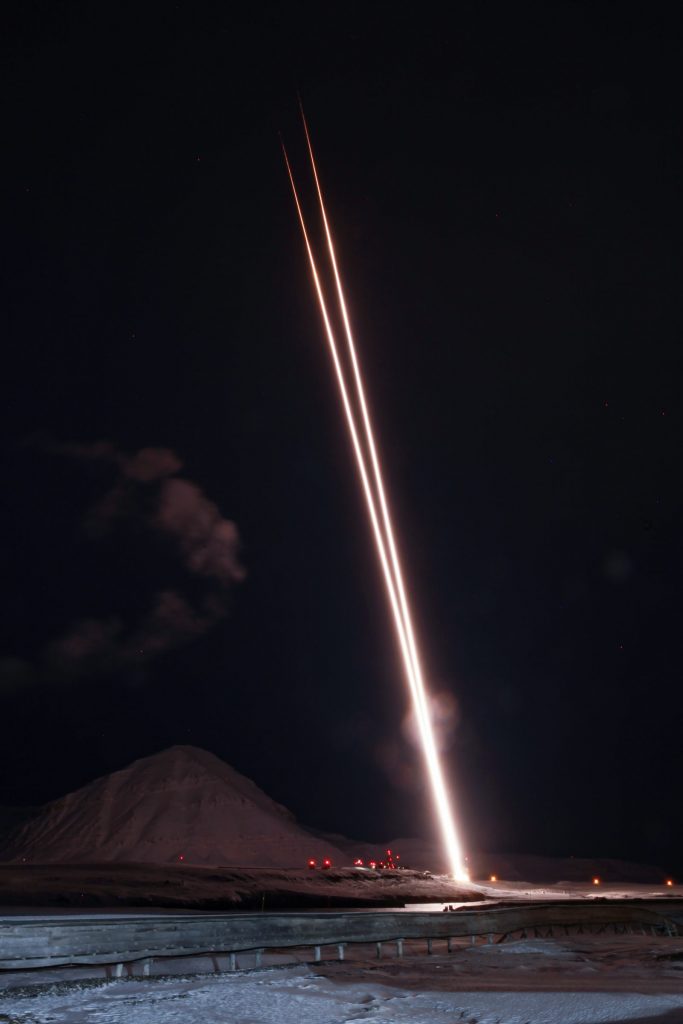
The second VISIONS-2 rocket launches. Credit: NASA/Joy Ng

The bright orb lifted quickly into the sky, followed a few moments later by a thunderous rumble. The trail of light continued on its arc as heads craned out over the balcony. The light began to dim, then suddenly brightened again. “Second stage!” Pfaff called out, to hollers of approval. Then the rocket passed out of view.

Without a word, the entire crowd rushed for the door, running back to their computers to watch the data stream in.  As they took their places, Rowland hovered among them like a conductor surveying his orchestra.

“First images!” he called out, pointing at a screen at the first station. It was the CCD imager, nitrogen-cooled, that was now flashing images in four square boxes, arranged two-by-two on the screen. At first, they each flickered rapidly, unsynchronized. Then suddenly, a semicircle of bright light appeared in all of them. “We’ve got the limb of the Earth!” he cried — the horizon was in view. The rocket was in space, looking back down at them.

Rowland continued down the line. Next up was a particle counter, measuring the oxygen ions escaping the atmosphere as the rocket flew through them. “We got the counts?” he called. Zaccarine, still glued to her screen, raised a thumbs-up.

Rowland scanned the room. Scientists watched their data roll in, narrating each dip and turn to one another like sports announcers. Radio chatter crackled in the background. At just under four minutes into the flight, all of the instruments were on, and no problems had been reported. Rowland stood, hands on the back of an empty seat, as his eyes welled with tears. A team member reached for a handshake but Rowland went for a hug.

Moen and Pfaff, the two veterans, met him in the middle of the room for congratulations. “Everything seems to be working,” Rowland said. He smiled and looked at Pfaff. “Looks like you might make your conference after all.”

Long-exposure photo of the 39 and 40 rocket launches. Credit: NASA/Allison Stancil-Ervin

Continue to Part VII

A SHOT IN THE DARK: Part V

A SHOT IN THE DARK

Chasing the aurora from the world’s northernmost rocket range

Part V
I • II •​ ​III •​ IV •​ ​V •​ VI​ •​ VII


Rob Pfaff. Credit: NASA/Joy Ng

Pfaff paced in front of the Wall of Science, stroking his chin, weighing the signs that launchable conditions were approaching. He had spent earlier hours on the phone, rapidly rebooking flights to make his science conference on time. But that was earlier, when conditions weren’t good. Now, everyone was at full attention.

In the background, the tinny sound of voices over a video chat trickled in. Moen, the professor from Oslo, was speaking with colleagues 50 miles south in Longyearbyen. One voice belonged to Fred Sigernes, Chief of the Kjell Henriksen Observatory, who was running the all-sky imager, the instrument that detected the cusp on the Wall of Science. The other voice belonged to Kjellmar Oksavik, a professor at the University of Bergen and at UNIS in Svalbard. He was running the EISCAT radar, scanning the sky for atmospheric heating. They kept the line open as they worked, ready to discuss every bit of new data as it appeared, in real time.

One of two EISCAT radar antennas in Longyearbyen. Credit: NASA/Joy Ng

At 11 a.m. — with one hour left in the day’s launch window — the solar wind’s magnetic field started to point south.

Rowland, sensing the opportunity to launch may be drawing close, OK’d the launch team to arm the rocket. “Let’s run the clock down to three minutes,” he said. It was as close to zero as they could get. Below that, the rocket was switched to internal battery power and the engineers completed their final checks.

Fifteen minutes passed and the solar wind’s magnetic field was still pointing south, but always zig-zagging, threatening to head north at any moment. The red blob marking the cusp remained too far north above Ny-Ålesund to launch through. A call came in over a walkie-talkie, and Rowland picked it up.

“We have some concern about surface winds.” It was Range Control. “It is not really stable enough just yet, and they are quite high. If you see something you want to start the count for, we will have to assess the winds at that point to make a decision if we can go or not.”

Rowland paused, working through his options. The cusp was still too far north at the moment, but given the steady stream of southward-pointing solar wind hitting Earth, it was due to move any moment. Once it moved into the rocket’s trajectory, they needed it to heat the atmosphere before they’d be ready to launch. “We’ll let it cook for a few minutes,” Rowland responded, “and then we’ll pick up the count.”

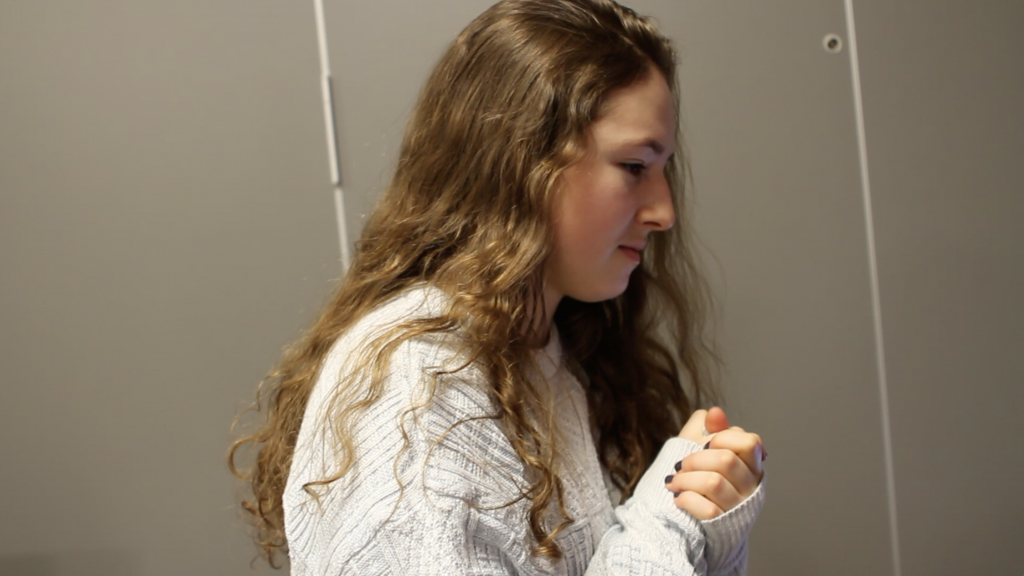
Zaccarine stands over her computer as launch opportunity draws near. Credit: Miles Hatfield

Before Rowland finished his sentence, Pfaff was already gesturing to him. “It’s slowly moving south,” he said. They rushed out to the Wall of Science, and Pfaff pointed to the red blob marking the cusp. “This used to be up here, now it’s right on top of us.”

By 11:50 a.m., with just ten minutes left in the launch window, the atmosphere was starting to heat up. The EISCAT radar’s measurements, once cool blues and greens, were turning orange and yellow. Now, time was of the essence.

“It’s three minutes to get in the air, and another couple to get to apogee — we’re five minutes from measuring anything,” said Rowland. It wasn’t the data now, but five minutes into the future, that they depended on. Rowland turned to Moen, who spoke to his colleagues over the video chat. “Should we go?” Moen asked.

Rowland looked around to the surrounding science team. The stakes were high enough to demand a unanimous decision. If they launched toward a transient, momentary fluke of heating that disappeared before they reached it, three years of work on the mission would be wasted. But waiting too long could lead to a similar fate if they missed their only chance. “Any dissenters?” he asked.

A hushed discussion ensued over the video chat as Rowland, out of earshot, studied the Wall of Science. Pfaff leaned in to the computer to listen closely. “They’re saying go!” Pfaff yelled. Everyone turned to Rowland. That was all the resolution he needed.

Rowland notified Range Control of their decision to launch and rushed back to the Wall of Science. At the bottom left display, the clock, long frozen at three minutes, began to count down.

Continue to Part VI

A SHOT IN THE DARK: Part IV

A SHOT IN THE DARK

Chasing the aurora from the world’s northernmost rocket range

Part IV
I • II •​ ​III •​ IV •​ ​V •​ VI​ •​ VII


Jøran Moen. Credit: NASA/Joy Ng

Each day, the science team prepared just the same. At 3 a.m., Rowland opened the giant doors of the Telemetry Readout building, where they were stationed. Over the next five hours, they stepped through instrument preparations, tests, and practice countdowns. It had now reached 8 a.m. on the fourth day of the launch window. Practice was over — it was time to try, once more, for the real thing.

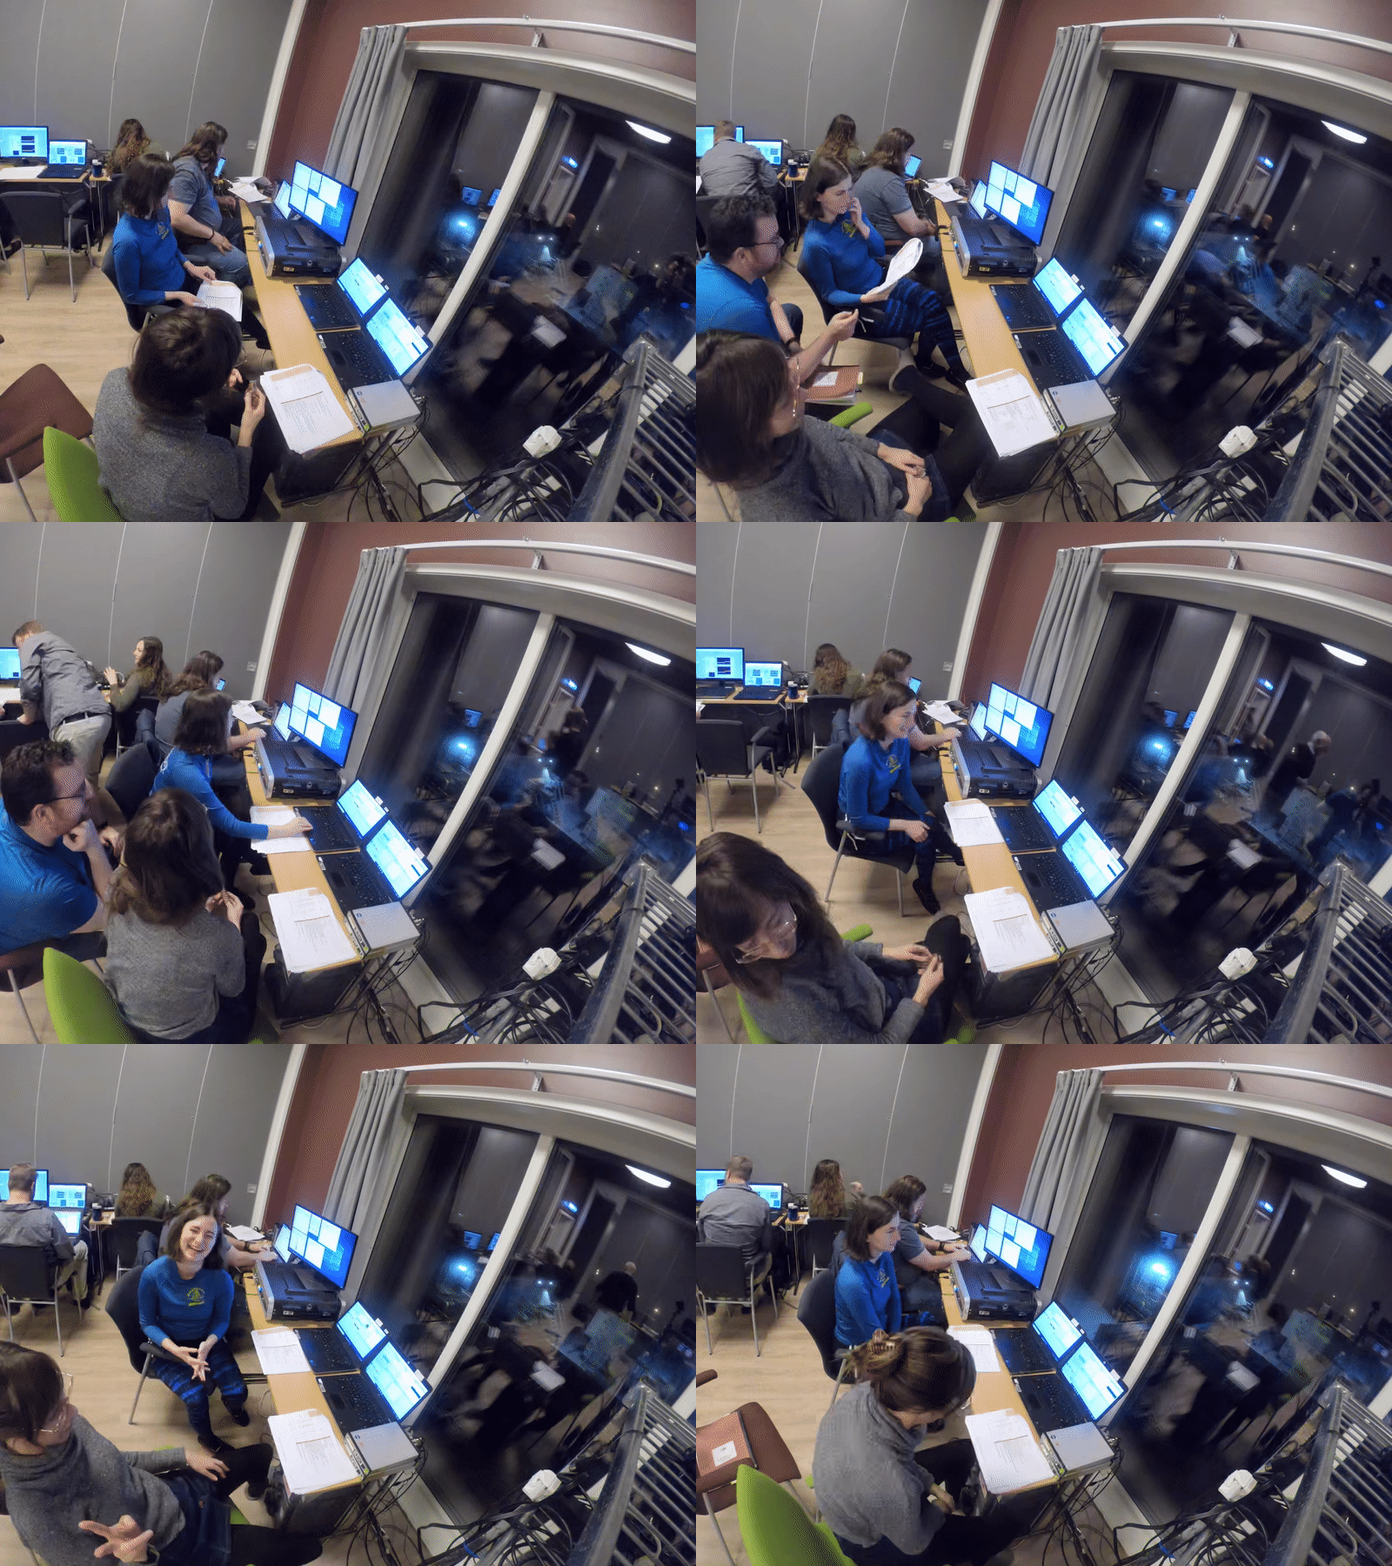
Rowland sat in the front room of the building, hunched over his laptop. Two long tables stretched out to either side of him, stacked with computer monitors of different shapes and sizes. Streams of data danced across their screen, one for each of the 11 instruments on the rocket. These were the rocket’s vital signs, so they watched them meticulously, beginning long before launch. Beside Rowland, Zaccarine, the youngest member of the science team, stared at the temperature readouts from one of the instruments that she’d watched for three days now.

The science team monitors their instruments in the Telemetry Room. Credit: NASA/Joy Ng

Across the room, Pfaff inspected long sheets of paper showing data from several instruments. Pfaff was familiar with the challenges of launching from Ny-Ålesund, and could advise Rowland on what to look for. But he couldn’t stay long. He was scheduled to deliver two lectures at a science conference back in Washington, D.C., and had almost left that morning. At the last minute, he delayed his flight: The weather seemed promising today.

The rest of the team gathered in the adjacent main hall. Jøran Moen and Andres Spicher from the University of Oslo, a professor and postdoc respectively, sat at a small table, sipping coffee from skinny white mugs. Moen was in charge of one of the instruments, but he also knew the cusp region well. He was one of the chief architects of the Grand Challenge Initiative – Cusp, the international sounding rocket campaign to explore the cusp, of which Rowland’s mission was one part.

Across the room, Matt Zettergren, a professor from Embry-Riddle, was fiddling with cables dangling from his laptop. One clicked into place, and a large screen in the middle of the room came alive. Four scientists gazed up at it, their faces illuminated by the blue-white glow.

The science team in front of the Wall of Science. Credit: NASA/Joy Ng

This was the Wall of Science, as they playfully called it. Its geometric arrangement of windows resembled farmland seen from a plane. The separate plots of data were beamed back from satellites in space and ground-based instruments. They blinked, shifted, and refreshed each at their own cadence. But each parcel had its own significance, requiring the right attention and know-how to read it. The Wall of Science contained all the information they had to decide whether, and when, to launch.

“This is our upstream space weather buoy,” said Rowland, pointing to a window in the upper right-hand corner of the screen. It was one of three windows that, together, told the story of atmospheric escape, following a gust of solar wind as it approached Earth, flowed through cusp, and triggered the aurora and fountains of escaping oxygen.

The first window showed a red squiggly line stretching across the plot. The data came from NASA’s Advanced Composition Explorer, or ACE satellite, perched one million miles closer to the Sun than we are. The science team looked to this data to see what the solar wind was blowing their way, some 45 minutes to an hour before it hit Earth.

This red squiggly line measured the solar wind’s magnetic field. Like Earth itself, the solar wind is magnetic, with its own north and south pole. But while north, on Earth, points in one steady direction, the solar wind is far less stable. A compass placed inside it would spin from moment to moment, depending on the changing activity on the Sun.

The scientists were waiting for the solar wind to point south, and to stay that way for a while. When a southward-pointed solar wind collided with Earth’s northward-pointed magnetic field, the two would fuse. It was the first step toward the ideal cusp aurora.

The effects of this collision could be seen on Earth, and were displayed in the next window. In two wavelengths of red light emitted by the aurora, it showed the location of the cusp over Svalbard.

At the moment, the cusp was positioned to the northeast of the island, out of range of the rockets’ trajectory. But the arrival of a southward-pointing gust of solar wind would intensify the aurora, dragging the cusp southward, towards the rocket’s planned trajectory.

Once the cusp started shifting south, launchable conditions were closing in. But to fire the rockets, the science team looked to the final window, placed on the far left of the screen. It told them when the aurora had reached its boiling point, and the oxygen was starting to escape. The data were from the EISCAT radar, short for European Incoherent Scatter Scientific Association. The two EISCAT antennas measured the density and temperature of the atmosphere over Ny-Ålesund, and at the peak of the rocket’s trajectory. When oxygen in the air started to boil, they would see it here. It would be time to start the countdown.

There was one more window squeezed into the bottom left corner, the only one that the team itself controlled. It was a simple digital clock. When it struck zero, rockets would fly.

Continue to Part V

A SHOT IN THE DARK: Part III

A SHOT IN THE DARK

Chasing the aurora from the world’s northernmost rocket range

Part III
I • II •​ ​III •​ IV •​ ​V •​ VI​ •​ VII


Sophie Zaccarine explains atmospheric escape. Credit: NASA/Joy Ng

At the entrance to the mess hall, Ny-Ålesund residents abandon snow-covered shoes for cozy slippers or socks. Inside, the warm air washes over wind-whipped faces, carrying the smell of rich soups, tea, and bread. “The chef is the most important person here,” Rowland quipped.

Residents make the pilgrimage to the mess hall three times a day: first for breakfast, beginning at 7:30 a.m. sharp, then for lunch, which runs from 12:20 to 1, and finally dinner from 4:50 to 5:30. Meals are not served outside of those hours, so the mess hall’s schedule is the town’s heartbeat. It also makes for a reliable meeting ground — a place hungry colleagues gather to discuss the day’s events.

The science team sat together at a table for lunch. The launch window on the second day had just closed — another scrub — but this time it wasn’t the wind. Instead, the aurora had eluded them.

In broad strokes, all types of aurora have a similar origin story. They form when negatively charged electrons crash into the gases in our atmosphere, jarring those gases into high-energy states. As they relax back to normal they give off their excess energy in the form of light: the ruby reds and emerald greens that illuminate the northern and southern skies.

Most of these auroras are formed by the same population of electrons. These electrons come from inside Earth’s magnetic field.

Illustration of the Earth’s magnetosphere, polar cusps and the solar wind. The northern and southern polar cusps appear as two funnels, where the solar wind can collide with Earth’s atmosphere. The collisions create the cusp aurora and hot fountains of outflowing oxygen. Credit: NASA CILab/Josh Masters

But the cusp auroras — the kind that form above Ny-Ålesund for just a few hours a day — are from a different stock of electrons. When they set the sky alight, they are at the end of a 93-million-mile journey, direct from the Sun.

Most particles that flow off the Sun — collectively known as the solar wind — don’t have that fate. By and large, they are deflected around Earth’s magnetic field, sent skimming off into space. But near the north and south poles, there are two funnels where solar particles can slip inside.

These holes in our protective shield are known as the polar cusps. They’re the only places on Earth where the oncoming solar wind directly collides with our atmosphere. The polar cusps are anchored to the Sun-facing side of Earth; as the planet rotates, they remain in perpetual daylight, piping  electrons from the Sun into the polar atmosphere. And between the hours of 10 a.m. and noon, the town of Ny-Ålesund passes right beneath one of them.

The cusp aurora hold secrets that extend far beyond Ny-Ålesund, both in space and time. Some 4.2 billion years ago, Mars had a hearty atmosphere along with liquid water on its surface. In its prime, scientists estimate, it might have been suitable for life. But through the millennia, the solar wind stripped Mars’s atmosphere to produce the exposed, barren landscape we see today. Partly, this is due to Mars’s weak magnetic field, which is unable to protect the planet as well as Earth’s can. Yet the story is more complicated than that, for Venus’s magnetic field is also weaker than Earth’s, yet it boasts an atmosphere 90 times thicker.

A planet’s fate lies in a complicated balancing act between countless physical processes, some that drain its atmosphere away and some that grow it. In the cusp aurora, some of these processes can be spied up close.

The cusp aurora. Credit: Bin Li

But Rowland is also looking to the future. Today, with just over 4,000 confirmed exoplanets, or planets orbiting stars elsewhere in the universe, the race is on to determine which of them are potentially habitable. But the dynamics of their atmospheres — which make or break their suitability for life — remain poorly understood. At present, we can do no more than make intelligent guesses, based on scientific models, about what their atmospheres might be like. To check the accuracy of these models, we test them with data collected on Earth. Data just like what Rowland’s team were here to get.

But there were no guarantees that the cusp auroras would cross their path. When the Sun’s activity is low, the cusp passes just north of Ny-Ålesund, outside of their approved launch trajectory. But a healthy gust of solar wind, they knew, could push it south, right into their path. So they waited, readying their rockets to ambush the aurora at the perfect moment.

Continue to Part IV