From its vantage point in geostationary orbit, NASA’s GOLD mission – short for Global-scale Observations of the Limb and Disk – has given scientists a new view of dynamics in Earth’s upper atmosphere. Together, three research papers show different ways the upper atmosphere changes unexpectedly, even during relatively mild conditions that aren’t typically thought to trigger such events.
Extra electrons
GOLD studies both neutral particles and those that have electric charge – collectively called the ionosphere – which, unlike neutral particles, are guided by electric and magnetic fields. At night, the ionosphere typically features twin bands of dense charged particles. But GOLD’s data revealed previously unseen structures in the nighttime ionosphere’s electrons, described in research published in the Journal of Geophysical Research: Space Physics on Aug. 24, 2020.
Data from NASA’s Global-scale Observations of the Limb and Disk, or GOLD, mission reveals the twin bands of charged particles that persist near the equator at night. Credit: NASA/GOLD/NASA’s Scientific Visualization Studio
While comparing GOLD’s data to maps created with ground-based sensors, scientists spotted a third dense pocket of electrons, in addition to the typical two electron bands near the magnetic equator. Reviewing GOLD data from throughout the mission, they found that the peak appeared several times in October and November of multiple years, suggesting that it might be a seasonal feature.
Though scientists don’t know what exactly creates this extra pocket of dense electrons, it appeared during a period of relatively mild space weather conditions. This was a surprise to scientists, given that big, unpredictable changes in the ionosphere are usually tied to higher levels of space weather activity.
Nitrogen drops
GOLD also saw large drops in the upper atmosphere’s oxygen-to-nitrogen ratio – a measurement typically linked to the electron changes that can cause GPS and radio signal disturbances.
This event was notable to scientists not for what happened, but when: The dips that GOLD saw happened during a relatively calm period in terms of space weather, even though scientists have long associated these events with intense space weather storms. The research was published on Sept. 9, 2020, in Geophysical Research Letters.
During a geomagnetic storm – space weather conditions that disturb Earth’s magnetosphere on a global scale – gases in the upper atmosphere at high latitudes can become heated. As a result, nitrogen-rich air from lower altitudes begins to rise and flow towards the poles. This also creates a wind towards the equator that carries this nitrogen-rich air down towards lower latitudes. Higher nitrogen in the upper atmosphere is linked to drops in electron density in the ionosphere, changing its electrical properties and potentially interfering with signals passing through the region. GOLD observed this effect several times during relatively calm space weather conditions during the day – outside of the disturbed conditions when scientists would normally expect this to happen.
These changes during seemingly calm conditions may point to a space weather system that’s more complicated than previously thought, responding to mild space environment conditions in bigger ways.
“The situation is more complex – the ionosphere is more structured and dynamic than we could have seen before,” said Dr. Sarah Jones, mission scientist for GOLD at NASA’s Goddard Space Flight Center in Greenbelt, Maryland.
Improving models
Indeed, GOLD’s observations of changing atmospheric composition are already informing scientists’ computer models of these processes. A paper published in Geophysical Research Letters on May 20, 2021, uses GOLD’s data as a reference to show how changes near the poles can influence the ionosphere’s conditions in the mid-latitudes, even during periods of calm space weather activity. GOLD’s broad, two-dimensional view was critical to the finding.
“When you look in two dimensions, a lot of things that look mysterious from one data point become very clear,” said Dr. Alan Burns, a researcher at the High Altitude Observatory in Boulder, Colorado, who worked on the studies.
By Sarah Frazier NASA’s Goddard Space Flight Center, Greenbelt, Md.
By Mara Johnson-Groh NASA’s Goddard Space Flight Center
Plasma – a fourth state of matter after solid, liquid, and gas where particles have split into charged ions and electrons – is the most common form of matter in the universe. It’s somewhat rare on Earth, but it makes up 99% of the matter in the visible universe. Despite its prevalence, scientists haven’t been able to observationally verify a foundational theory describing how plasma moves in response to electric and magnetic forces. Until now.
With its ultraprecise measurements, NASA’s Magnetospheric Multiscale mission – MMS – has finally measured plasma’s movement on the small scales necessary to see if plasma collectively interacts with electromagnetic fields in the way the fundamental theory predicts, which is described mathematically by the so-called Vlasov equation.
Since the beginning of plasma physics research nearly 100 years ago, the Vlasov equation has often been assumed to be valid for many kinds of plasmas in space. But now the new MMS results, which were published in the journal Nature Physics on July 5, 2021, have allowed scientists to finally see the fundamental plasma variations described in the theory for the first time in nature.
Measuring the basic interactions of space plasmas with electric and magnetic fields helps scientists better understand different mechanisms that fuel energetic space weather events, from auroras to plasma ejections off the Sun, which can interfere with satellites and communications on Earth.
The thin boundary in Earth’s protective magnetic field, or magnetosphere, shown here between the blue and yellow regions, is where NASA’s Magnetospheric Multiscale mission measured terms of the Vlasov equation reported in a new study. The new measurements help scientists better understand how supersonic solar wind plasma particles penetrate the magnetosphere where they can produce auroras and damage communications satellites. Credits: NASA’s Goddard/ Space Flight Center/Mary Pat Hrybyk-Keith/Conceptual Image Lab/Josh Masters
A Century of Plasma Physics Progress
The basic theory of plasma motion originated out of a fundamental theory for gases from the nineteenth century. In the 1890s, an Austrian physicist by the name Ludwig Boltzmann came up with a way to describe the microscopic movement of gases and fluids using statistics. It’s known as the Boltzmann equation, and it’s still taught in physics courses today.
In the 1930s, this work was extended to describe plasmas by Anatoly Vlasov, a Russian physicist. His work specifically described collisionless plasmas, which exist at such high temperatures and low densities that individual plasma particles almost never collide.
Collisionless plasma environments are common in space and can be found in the Sun’s outer atmosphere, solar wind, and in various regions throughout Earth’s magnetic environment, called the magnetosphere.
Unlike ordinary gases, plasmas are electrically charged, as they’re made of positively and negatively charged particles – namely atomic nuclei and their separated electrons. This makes plasmas behave very differently than gases since they are sensitive to electromagnetic forces, which influence their movements. Whereas individual particles in a gas constantly bounce off each other as they erratically travel along, collisionless plasma particles rarely interact and are instead controlled solely by electric and magnetic forces. Vlasov’s equation describes the interplay between plasma particles and electromagnetic fields in these unique collisionless plasma systems – and it has formed the foundation for many ideas about plasmas in the years since.
“The Vlasov equation governs all collisionless plasma phenomena that we know of,” said Jason Shuster, lead author on the new study, Assistant Research Scientist at the University of Maryland in College Park, and MMS scientist at NASA’s Goddard Space Flight Center in Greenbelt, Maryland.
Nevertheless, the terms in the Vlasov equation have never been directly measured because the observation requires seven different types of measurements to be made simultaneously at very small scales in a diffuse plasma – something which is only possible in space.
“In smaller experiments in labs we can’t probe the plasma without disturbing it,” said Barbara Giles, co-author on the new study, Project Scientist for MMS and research scientist at NASA’s Goddard Space Flight Center. “Only in space can we fully immerse instruments within the same phenomenon and accurately test these theories without disturbing the system.”
The MMS Tetrahedron
In 2015, the launch of the four MMS spacecraft changed the way physicists could study plasma in space. Flying in a tetrahedral – or pyramid-shaped – formation with high-resolution instruments, MMS can take measurements far beyond the capabilities of previous spacecraft missions. In their record-breaking tight flying formation, the four MMS spacecraft also fly close enough to measure small-scale properties of plasma, which enabled them to detect variations in terms of the Vlasov equation for the first time.
“With MMS, we can actually probe those minute details at higher resolution than ever before,” Shuster said.
To measure terms in the Vlasov equation, MMS used 64 particle spectrometers – instruments which measure particle energies and charges. The unprecedented spectrometers can simultaneously record multiple types of measurements in position, velocity, and time needed to resolve terms in Vlasov equation. Since each of the four spinning MMS spacecraft has 16 spectrometers sampling particles around its entire circumference, MMS is uniquely able to take these measurements at incredibly high speeds – every 0.03 seconds, which is nearly 100 times faster than previous missions.
“MMS takes advantage of the natural laboratory provided by Earth’s magnetic environment in outer space,” Shuster said. “In the lab, it is very difficult to create a vacuum with a pressure and density low enough to measure the types of electron-scale structures that we’re able to probe with MMS.”
Improving Global Predictions
Now that MMS has observationally confirmed fundamental predictions of the Vlasov equation, this data can be used to better understand phenomena in plasma environments in near-Earth space.
For example, applying small-scale knowledge of plasma to the global-scale magnetosphere can help scientists better understand different mechanisms that fuel energetic space weather events – such as magnetic reconnection, an explosive event unique to plasma that occurs when magnetic field lines sharply reverse direction.
Additionally, just as high- and low-pressure systems create winds and storms on Earth, electric currents and plasma flows drive weather systems in space. Fast moving jets of energetic plasma, such as those scientists observed in this study with MMS, can sustain strong electric currents and pressure gradients which drive space weather phenomena throughout Earth’s magnetic environment.
Understanding the acceleration and energization of particles is a big challenge for the field of space physics. Scientists believe thin boundary layers, like the one depicted in this animation, are prime candidates for accelerating particles up to energies high enough that they can penetrate through Earth’s magnetic field and generate strong electric currents that can fuel space weather and geomagnetic storms inside Earth’s magnetosphere. Credit: NASA’s Scientific Visualization Studio/Tom Bridgman/Mara Johnson-Groh
Having direct observations of the terms in the Vlasov equation provides scientists with a deeper understanding of these basic plasma motions, which enables them to predict the triggers of these fundamental plasma processes more accurately.
“The measurements of terms in the Vlasov equation provide information we can use to constrain and increase the accuracy of our global space weather models, which currently rely on large-scale approximations,” Shuster said. “These discoveries improve our ability to predict space weather operating close to home in Earth’s magnetosphere and deepen our overall understanding of plasmas existing throughout the universe.”
By Miles Hatfield NASA’s Goddard Space Flight Center
About 50 miles up, Earth’s atmosphere undergoes a fundamental change. It starts at the atomic level, affecting only one out of every million atoms (but with about 91 billion crammed in a pinhead-sized pocket of air, that’s plenty). At that height, unfiltered sunlight begins cleaving atoms into parts. Where there once was an electrically neutral atom, a positively charged ion and negatively charged electron (sometimes several) remain.
The result? The air itself becomes electrified.
Scientists call this region the ionosphere. The ionosphere doesn’t form a physically separated atmospheric layer – the charged particles float amongst their neutral neighbors, like bits of cookie dough in a pint of cookie dough ice cream. Nonetheless, they follow a very different set of rules.
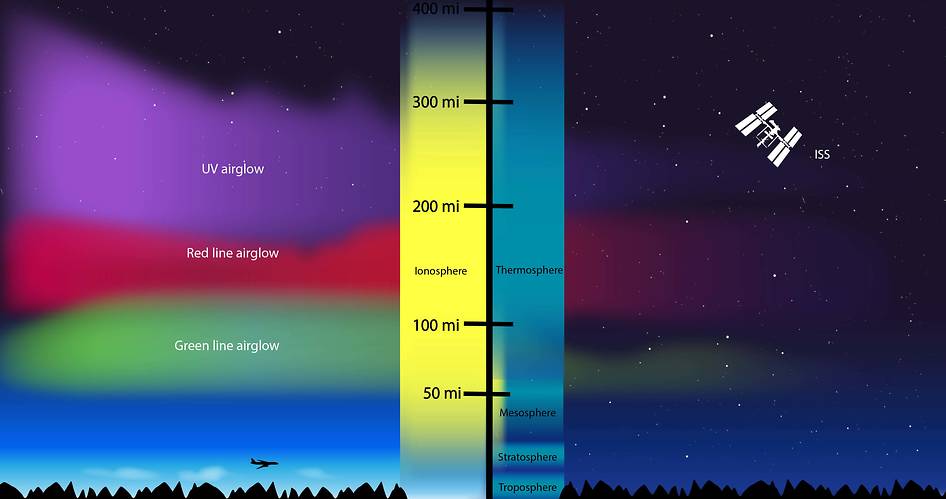
A layer of charged particles, called the ionosphere, surrounds Earth, extending from about 50 to 400 miles above the surface of the planet. Credits: NASA’s Goddard Space Flight Center/Genna Duberstein
Consider how the ionosphere moves. Charged particles are constrained by magnetism; like railroad cars, they trace Earth’s magnetic field lines back and forth unless something actively derails them. Neutral particles can cross those tracks unfazed – they’re more like passengers crisscrossing as they board and exit at the station.
The ionosphere also reflects radio signals, which pass right through the neutral atmosphere as if it was transparent. (In fact, radio is how the ionosphere was discovered.) Scientists still use ground-based radio waves to study the ionosphere from afar. Learning about the neutral atmosphere, however, usually requires going there – or looking down at it from above.
Despite their differences, the ionosphere and the neutral atmosphere are parts of a larger atmospheric system, where disturbances in one part have a way of spreading to the other. Their connection is explored in a new paper led by Scott England, space physicist at Virginia Tech in Blacksburg and co-investigator for NASA’s Global-scale Observations of the Limb and Disk, or GOLD mission, published in the Journal of Geophysical Research.
England and his coauthors combined ground-based radio signal measurements with special-purpose satellite observations to study whether Traveling Ionospheric Disturbances – waves regularly observed moving through the ionosphere – are at root the same event as Traveling Atmospheric Disturbances, pulses sometimes seen in the neutral atmosphere.
Traveling Ionospheric Disturbances, or TIDs, are giant undulations in the ionosphere, waves that stretch hundreds of miles from peak to peak. They’re are detected with ground-based radar beams, which bounce radars off the ionosphere to detect density enhancements move through.
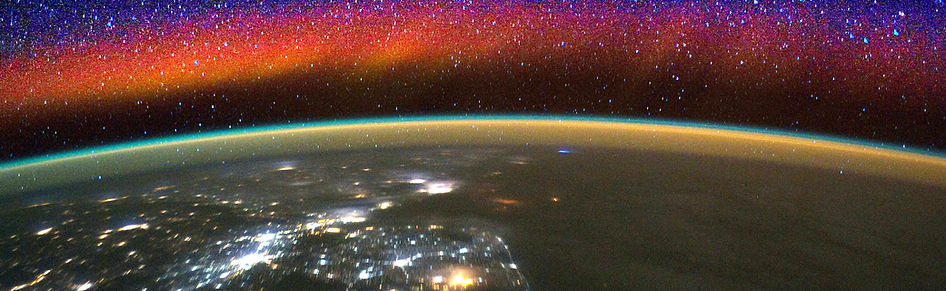
Traveling Atmospheric Disturbances, or TADs, are gusts of wind that roll through the sky, pushing along neutral atoms as they go. TADs are harder to measure, best observed by flying within them – as somemissionshave – or by using indirect measures of airglow, the glimmer of oxygen and nitrogen in our atmosphere that brightens and dims as TADs move through it.
Earth’s limb at night, seen from the International Space Station, with an air glow visual composited into the image. Credit: NASA
TIDs and TADs are measured in quite different ways, and it can be hard to compare across them. Still, many scientists have assumed that if one is present, the other is too.
“There is this assumption that they’re just the same thing,” said England. “But how robust is that assumption? It may be extremely good – but let’s check.”
England designed 3-day campaign to look for TIDs and TADs at the same time and same place.
TIDs were tracked from below, using ground-based radio receivers from stations across the Eastern U.S. Meanwhile, NASA’s Global-scale Observations of the Limb and Disk, or GOLD satellite, was looking for TADs from above, measuring airglow variations to track movements of the neutral atmosphere. But it took a little re-jiggering to see them. GOLD typically scans the whole western hemisphere once every half hour, but that’s too quick a glance at any one location to see a TAD.
“GOLD was never designed to see these things,” said England. “So we devised a campaign where we have it not do what it normally does.”
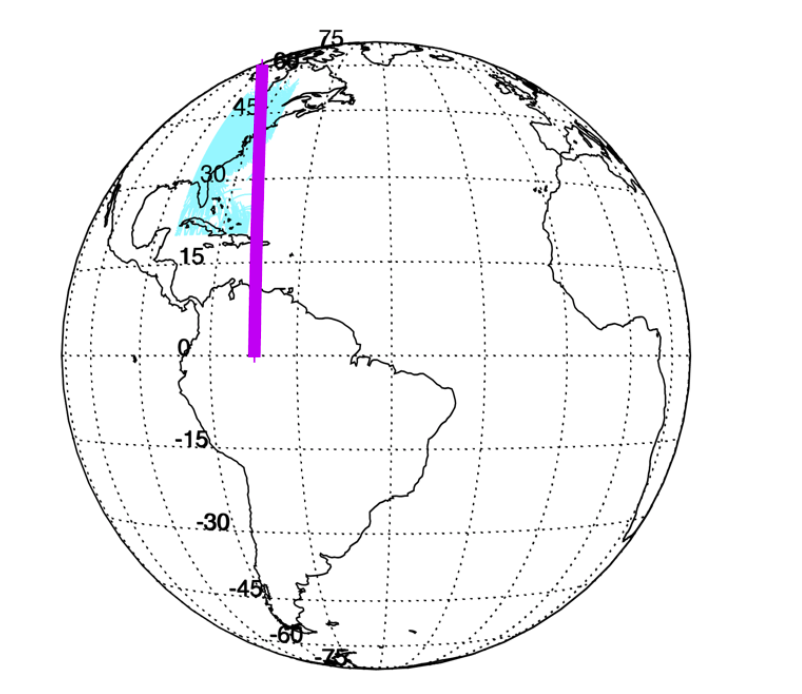
Instead, England directed one of GOLD’s telescopes to stare to along a strip of sky, increasing its detection power 100-fold. That strip is shown below in purple – GOLD’s search space for TADs. The region measured by ground-based radio receivers, which looked for TIDs, is shown in light blue. The region where they overlapped was the focus of England’s study.
Location of the GOLD observations during the campaign (purple strip). The light blue region show the locations of the GPS radio data included in this study. Credit: NASA/England et al.
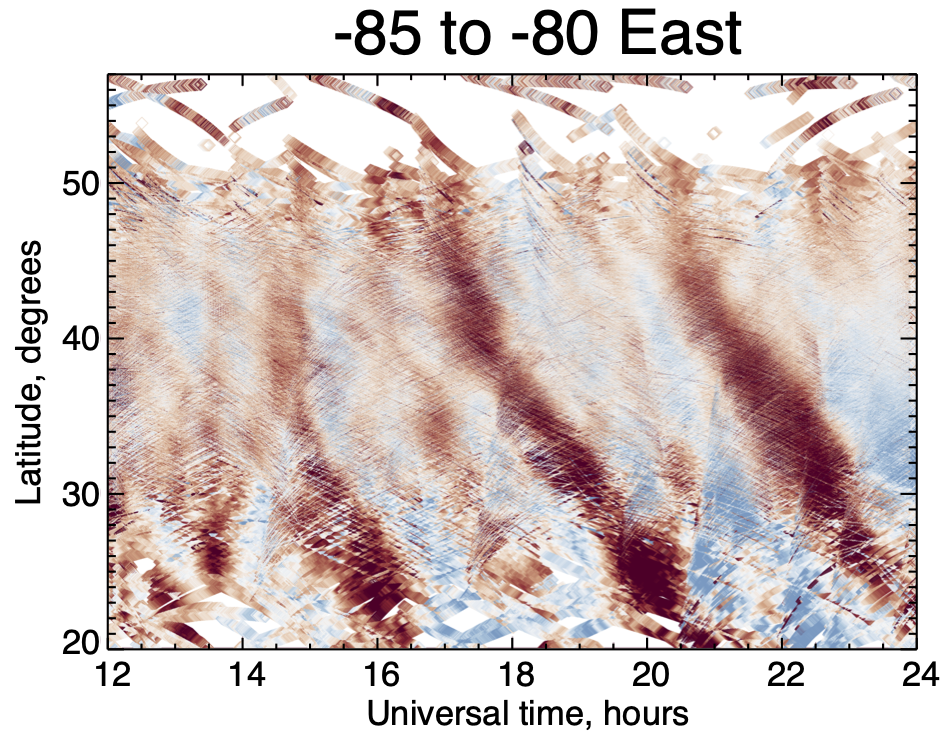
The radio receivers listened for changes in incoming signals, as these modulations could indicate a TID was passing by. The graph below shows the radar results from one of the three days in the campaign. The vertical axis represents latitude – higher up meaning more northern – and the horizontal axis represents time. The different colors show the strength of the signal modulation, dark red being the strongest.
Global Navigation Satellite System differential TEC (dTEC) for October 18, 2019 as a function of latitude and universal time. The range of longitudes included is shown along the vertical axis. Credit: NASA/England et al.
Over a span of 12 hours, three stripes formed in the data. These were TIDs: pulses or density enhancements in the ionosphere moving southward over time.
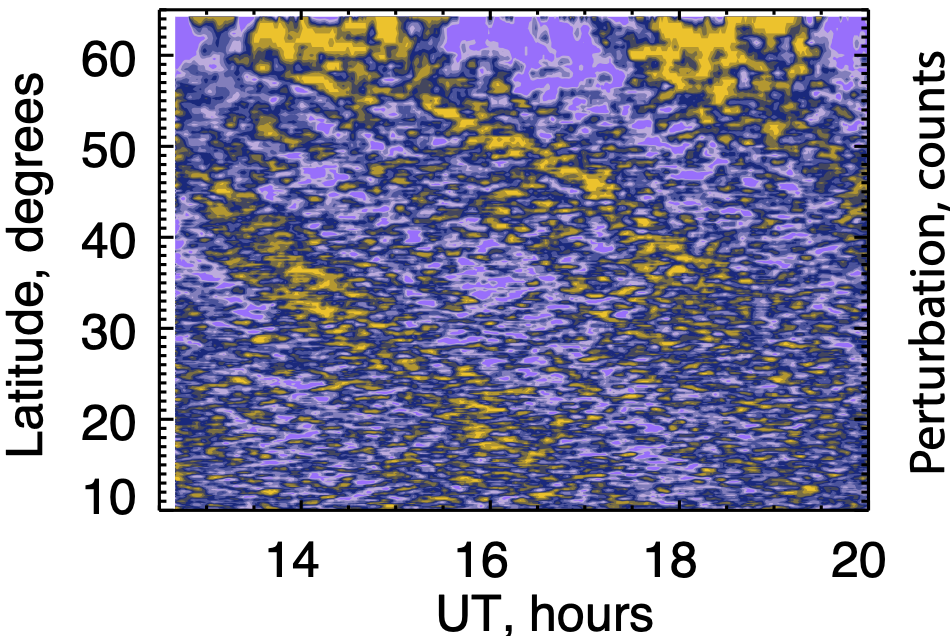
Meanwhile, GOLD was watching light from oxygen and nitrogen to discern the motion of the neutral atmosphere. The graph below shows the results. Note that the latitudes GOLD measured range farther than the radar measurements, from 60 degrees to 10 degrees, but over a slightly shorter period of time, about 8 hours.
Perturbations to the airglow observed on October 18, 2019. As oxygen and nitrogen signals were in counter-phase, this figure shows the perturbation in the oxygen minus twice the nitrogen airglow to highlight the difference. Credit: NASA/England et al.
It was a weak signal, just above the ambient environmental noise. Still, the faint outlines of TADs – diagonal stripes in the GOLD data – appeared at the same time.
“It’s really at the limit of what GOLD could see – if it was any smaller than this, we wouldn’t see it,” England said.
Aligning the two datasets and correlating them, England found that both sets of ripples moved at about the same rate. Then, with the help of some mathematical models, they tested out the idea that atmospheric gravity waves could be the underlying cause of both.
Gravity waves – not to be confused with gravitational waves, caused by distant supernova explosions and black hole mergers – form when buoyancy pushes air up, and gravity pulls it back down. They’re often created when winds blow against mountain faces, pushing plumes of air upward. Those plumes soon fall back down, but like a line of dominos, the initial “push” cascades all the way to the upper atmosphere.
England and his coauthors linked up a mathematical model of the atmosphere with an airglow simulator. They then mimicked a gravity wave by introducing an artificial sine wave to the models. The resulting simulated data produced similar “stripes,” both in the atmospheric model (TIDs) and the airglow simulator (TADs), indicating that gravity waves could indeed cause both.
So – are TIDs just TADs, as scientists assumed? While the pulses moved together, England’s team found that their amplitude, or size, were not as clearly related. Sometimes a large TID would be associated with a small TAD, and vice versa. Partly that’s because GOLD and the radio receivers don’t measure exact same altitudes – the radio receivers picked up a region about 40 miles above where GOLD could measure. But the largest contributor to that difference is probably the many other phenomena in the atmosphere that we don’t fully understand yet.
“And that makes what we’re looking at hard – but also interesting,” England added.
It will take more than three days of data to fully determine the relationship between TIDs and TADs. But England’s study provides something that virtually all scientists get excited about: a new tool for answering that question.
“We didn’t know if there would be a clear relationship between TIDs and TADs or not. And we certainly seem to have the ability to determine that now,” England said. “We just have to use the GOLD spacecraft instrument to do something we didn’t originally think of.”
By Mara Johnson-Groh NASA’s Goddard Space Flight Center
Up in the night sky, above the auroras and below the Moon, there exists a heated superhighway. Instead of cars though, this transient highway funnels charged particles across hundreds of thousands of miles toward Earth for a few minutes before vanishing.
While we can’t see it with our eyes, scientists have recently discovered a new way to look at the entire transportation structure from afar for the first time using special particles called energetic neutral atoms. Ultimately, this could help scientists predict when dangerous effects of space weather might be headed towards Earth.
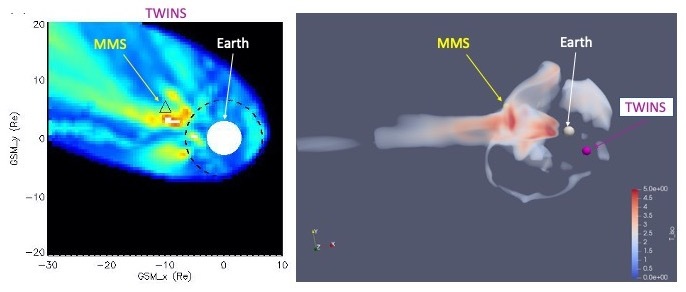
Using data from NASA’s MMS and TWINS missions, scientists were able to map temporary highways hurtling particles towards Earth during stormy space weather conditions. Credit: Amy Keesee/University of New Hampshire
The highway is temporarily created within Earth’s self-generated magnetic bubble, during periods of intense activity from the Sun, when the planet is bombarded with charged particles and radiation. The bubble protects the planet from most of the particles, but some sneak through and are funneled along towards Earth along a highway-like structure.
Since these particles can disrupt satellites and telecommunications in space and damage systems on Earth, scientists are keen to study how they are transported. However, charged particles have to be measured where they are – rather than being tracked with far-away observatories. This is like monitoring traffic by standing right on a highway instead of from a helicopter flying above – which makes it hard to get a full picture of the routes the vehicles travel.
As a result, scientists have only been able to glimpse snapshots of particles’ paths as satellites passed through the region.
But recently a group of scientists, led by Amy Keesee, a space physicist at the University of New Hampshire, decided to look at the highway in a new way. Using data from NASA’s Two Wide-angle Imaging Neutral-atom Spectrometers – TWINS – mission, which operated from 2008 to 2020, the scientists studied the region using energetic neutral atoms, or ENAs.
These particles are formed when a charged particle hits a neutral atom and loses its charge to the atom. Since it’s no longer charged, the particle is unbound from the magnetic fields it was previously confined to and goes streaming through space along a straight line. By measuring these particles, scientists can work back to see where the particle was created, providing an image of the region of charged particles. Scientists have previously used this technique to study the edge of the magnetic bubble created by the Sun.
Using near-Earth ENAs measured by TWINS, the scientists were able to create a complete map of the highway. They also verified their findings with data from NASA’s Magnetospheric Multiscale mission, which happened to fly through the region at the time. Together, this opens the door to observing these particle flows from far away, rather than needing to fly a spacecraft right through them. Such information could improve our real-time predictions of when charged particles are coming toward Earth.
By Mara Johnson-Groh NASA’s Goddard Space Flight Center
On January 31, 1958, the U.S. launched its first satellite: Explorer 1. Among its many achievements, Explorer 1 made the ground-breaking discovery of belts of charged particles encircling Earth.
That discovery is still being studied today. 63 years on, scientists are still learning about these belts – now known as the Van Allen belts – and their effects on Earth and technology in space.
From 2012 to 2019, scientists used NASA’s Van Allen Probes to gather data from the dynamic region discovered by Explorer 1. While the mission is no longer operational, it left a treasure-trove of observations, which are continuing to reveal new things about the belts. In 2020, over 100 scientific papers were published in peer-reviewed international journals using Van Allen Probes data, often leading studies in conjunction with partner missions. Here are three surprising discoveries scientists have recently made about the Van Allen belts.
1) In addition to particles, space is filled with electromagnetic waves called plasma waves, which affect how charged particles in space move. Near Earth, one type of wave, called whistler chorus waves, bounces back and forth following magnetic field lines between Earth’s North and South poles. Observations from the Van Allen Probes and Arase missions recently showed that these waves can leave the equator and reach higher latitudes where they permanently knock particles out of the Van Allen belts – sending the particles out into space never to return.
2) In addition to removing charged particles from the belts, magnetic activity can also add in new particles. Van Allen Probes observations combined with data from a Los Alamos National Lab geosynchronous satellite and one of NASA’s THEMIS satellites showed how hot charged particles can be abruptly transported by magnetic activity across 400,000 miles, from distant regions under the influence of Earth’s magnetic field into the heart of the Van Allen belts.
3) Earth’s magnetic environment and the Van Allen belts are highly influenced by the Sun, particularly when it releases clouds of ionized gas called plasma, which can create hazardous space weather. Some stormy activity from the Sun can create an intense ring of current surrounding Earth. Understanding these currents is critical for predicting their adverse space weather effects on ground-based infrastructure. Using years of Van Allen Probes data, scientists can now accurately model the distribution of the ring current around Earth even during the most intense space weather storms.
By Sarah Frazier NASA’s Goddard Space Flight Center
A special collection of research in the Journal of Geophysical Research: Space Physics highlights the initial accomplishments of NASA’s GOLD mission. GOLD, short for Global-scale Observations of the Limb and Disk, is an ultraviolet imaging spectrograph that observes Earth from its vantage point on a commercial communications satellite in geostationary orbit.
Since beginning science operations in October 2018, GOLD has kept a constant eye on Earth’s dynamic upper atmosphere, watching changes in the Western Hemisphere, marked by changes in the temperature, composition and density of the gases in this region.
A few highlights include:
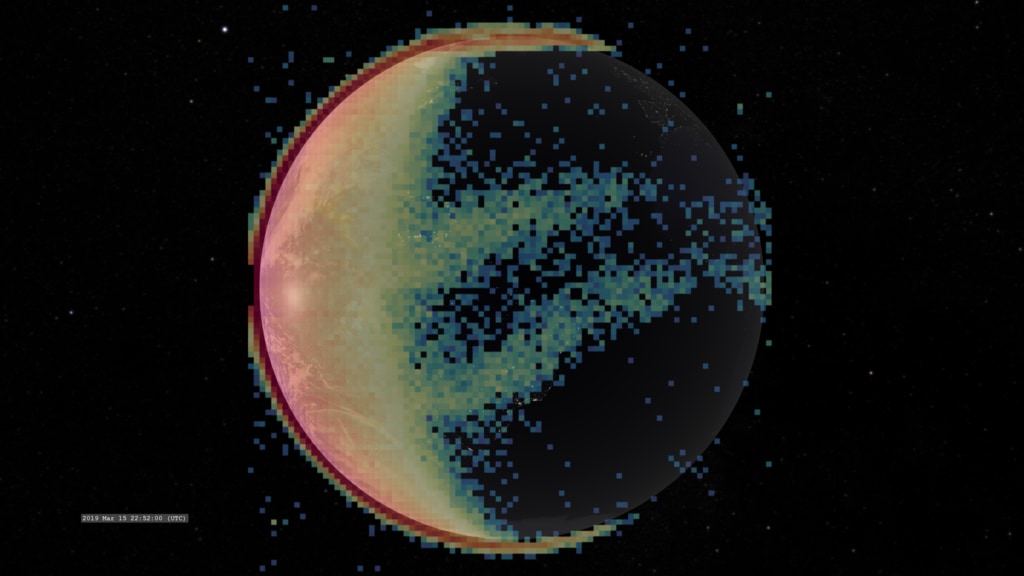
Results on one source of airglow seen at night, which relies on electrons on Earth’s day side becoming ionized by sunlight, then being transported along magnetic field lines to the nightside, where they create visible airglow (Solomon, et al)
New evidence supporting the idea that the equatorial ionization anomaly appearing in the early morning — a prominent feature in the ionosphere with poorly-understood triggers that can disrupt radio signals — is linked to waves in the lower atmosphere (Laskar, et al)
New observations of planet-scale waves in the lower atmosphere that drive change in the ionosphere (Gan, et al & England, et al)
Multi-instrument measurements of plasma bubbles — “empty” pockets in the ionosphere that can disrupt signals traveling through this region because of the sudden and unpredictable change in density — that suggest they are could be seeded by pressure waves traveling upwards from the lower atmosphere (Aa, et al)
Observations showing that plasma bubbles occur frequently at all of the longitudes covered by GOLD with different onset times, providing new information on the influence of the particular configuration of the geomagnetic field at these longitudes (Martinis, et al)
Measurements of changes in the chemical composition of the thermosphere during the total solar eclipse of July 2, 2019, which give scientists an unprecedented hemisphere-wide look at how the reduction in solar radiation throughout an eclipse affects this part of the atmosphere (Aryal, et al)
By Miles Hatfield NASA’s Goddard Space Flight Center
A new NASA study finds that our distant planetary neighbors, Uranus and Neptune, may have magnetic “seasons:” A time of the year when aurora glow brighter and atmospheric escape may quicken.
Study authors Dan Gershman and Gina DiBraccio, of NASA’s Goddard Space Flight Center in Greenbelt, Maryland, published the results in Geophysical Research Letters. Though these seasonal changes haven’t been directly observed, the results show that a combination of strong solar activity and Uranus’ and Neptune’s unusually tilted magnetic fields is likely to trigger them.
From Mercury to Neptune, every planet in our solar system feels the unceasing stream of the solar wind. This barrage of solar particles, traveling hundreds of miles a second, drags the Sun’s magnetic field out to space, inevitably colliding with planetary magnetic fields.
But each planet responds differently. For planets closer to the Sun, like Mercury and Earth, the solar wind can really shake things up. Strong blasts of solar wind create our northern lights – at their worst, they can even cause electrical surges that lead to blackouts. (Mercury is hit so hard that it can’t even sustain an atmosphere.)
On Jupiter and Saturn, the solar wind’s blast has little effect. This is not because they’re farther away from the Sun – the most important factor is their magnetic fields, which are optimally positioned to protect them. These planets have strong magnetic fields aligned almost perfectly vertically, like a spinning top. As the solar wind blows past Saturn, for instance, it hits its equator, meeting its magnetic shield where it is strongest.
An animation of Saturn’s magnetosphere as measured during the Voyager 1 flyby. Credits: NASA/Scientific Visualization Studio/Tom Bridgman
Uranus and Neptune are even farther away from that strong solar wind source, but their magnetic axes make them vulnerable. Uranus’ magnetic axis is tilted by a full 60 degrees. This means that for a portion of its 84-year-long trip around the Sun, the Sun shines almost directly into the planet’s magnetic north pole, where the planet is least protected. Neptune’s axis is similarly tilted – though only by 47 degrees.
Animated GIF showing Uranus’ magnetic field. The yellow arrow points to the Sun, the light blue arrow marks Uranus’ magnetic axis, and the dark blue arrow marks Uranus’ rotation axis. Credits: NASA/Scientific Visualization Studio/Tom Bridgman
With that background knowledge, Gershman and DiBraccio set out to study how the solar wind would affect the ice giants. Using historical data from the Helios, Pioneer and Voyager spacecrafts, Gershman and DiBraccio measured the Sun’s magnetic field throughout the solar system.
The results showed that during intense conditions, the solar wind can be as impactful near Uranus and Neptune as it normally is near Mercury, some 1.5 billion miles closer to the Sun.
Such intense conditions aren’t even a rarity. The enhanced solar activity Gershman and DiBraccio studied occurs regularly, as part of the 11-year solar cycle. The solar cycle refers to the periodic flipping of the Sun’s magnetic field, in which activity rises and falls. At the high point, known as solar maximum, the Sun’s magnetic field throughout space can double in strength.
If the Sun enters solar maximum when Uranus or Neptune is at the appropriate angle, the effects, Gershman and DiBraccio argue, could be extreme. These planets so far from the Sun could suddenly be driven by it. Though the seasonal effects have not yet been directly observed, the physics suggests that aurora should brighten and spread further across the planet. Globs of particles known to escape the Uranian atmosphere may do so at a quickened pace. But only a few Earth-years later, it all goes away and the planets enter a new magnetic season.
The only close-up measurements we have of the planets are from the single flyby of Voyager 2 in 1986 and 1989, respectively. But a future NASA mission to the Ice Giants may well change that, giving us the first glimpse of their other-worldly magnetic seasons.
This imagery captured by NASA’s Solar Dynamics Observatory shows a solar flare and a subsequent eruption of solar material that occurred over the left limb of the Sun on November 29, 2020. From its foot point over the limb, some of the light and energy was blocked from reaching Earth – a little like seeing light from a lightbulb with the bottom half covered up.
Also visible in the imagery is an eruption of solar material that achieved escape velocity and moved out into space as a giant cloud of gas and magnetic fields known as a coronal mass ejection, or CME. A third, but invisible, feature of such eruptive events also blew off the Sun: a swarm of fast-moving solar energetic particles. Such particles are guided by the magnetic fields streaming out from the Sun, which, due to the Sun’s constant rotation, point backwards in a big spiral much the way water comes out of a spinning sprinkler. The solar energetic particles, therefore, emerging as they did from a part of the Sun not yet completely rotated into our view, traveled along that magnetic spiral away from Earth toward the other side of the Sun.
While the solar material didn’t head toward Earth, it did pass by some spacecraft: NASA’s Parker Solar Probe, NASA’s STEREO and ESA/NASA’s Solar Orbiter. Equipped to measure magnetic fields and the particles that pass over them, we may be able to study fast-moving solar energetic particles in the observations once they are downloaded. These Sun-watching missions are all part of a larger heliophysics fleet that help us understand both what causes such eruptions on the Sun – as well as how solar activity affects interplanetary space, including near Earth, where they have the potential to affect astronauts and satellites.
By Sarah Frazier NASA’s Goddard Space Flight Center
NASA will begin formulation of a new mission to study Earth’s dynamic interface to space: the upper atmosphere. This is a region that is constantly changing, influenced by Earth’s weather percolating up from below and space weather — in the form of solar energy and space plasma — streaming in from above. This new mission will provide the first systematic study of this region in our atmospheric backyard, providing the data needed to assess, and ultimately forecast, the phenomena that course through Earth’s upper atmosphere.
The new mission, called the Geospace Dynamics Constellation, or GDC, answers a call laid out in the most recent solar and space physics decadal survey for a mission to study how Earth’s atmosphere absorbs and responds to energy inputs. GDC is a mission within NASA’s Living With a Star program, focusing on fundamental heliophysics science and applications of that science to protecting human society and technology. On Sept. 8, 2020, GDC successfully completed the Key Decision Point – A review, or KDP-A, moving the project into Phase A, when the team works on concept and technology development that will support the mission. The GDC project management has been directed to NASA’s Goddard Space Flight Center. The target Launch Readiness Date is late 2027, and GDC mission timeline will be developed during Phase A.
This data visualization combines models of ions, upper atmospheric winds, and Earth’s magnetic field, a few of the many overlapping conditions that feed into complex processes in Earth’s upper atmosphere. The upcoming Geospace Dynamics Constellation mission will study this region of Earth’s atmosphere and provide the first systematic view of this area. Credit: NASA’s Scientific Visualization Studio
GDC will study Earth’s upper atmosphere, where our planet’s near-space environment overlaps with our atmosphere and space weather effects can manifest — ranging from the scrambling of communications and navigation signals to satellite orbit disruptions and induced currents that can trigger power outages on Earth’s surface.
Using a distributed constellation of spacecraft working together to gather comprehensive observations from multiple vantage points, GDC will explore the fundamental physics of this region of near space, investigating the complex processes that transmit energy and momentum on scales ranging from seasonal to daily to minute by minute. The level of detail and resolution provided by GDC will give us an unprecedented understanding of the space environment surrounding our home planet. Understanding these processes will provide crucial information needed to understand, and ultimately predict, the variable nature of the space environment our satellites, signals, and astronauts must travel through — and give us new insights into the forces that shape our home planet and other worlds.
By Mara Johnson-Groh NASA’s Goddard Space Flight Center
Late on August 16, 2020, the Sun released a burst of light and energy known as a solar flare. This B1-class solar flare – the second smallest class of flare – peaked at 1:26p.m. EDT.
NASA’s Solar Dynamics Observatory observes the Aug. 16, 2020, B-class flare at 131, 171, and 193 angstroms. Credit: NASA/SDO
Solar flares, which are abrupt outbursts of energy and light on the solar surface, are often accompanied by CMEs. B-class flares – or “background” flares – were originally the lowest class of flare before lower level A-class flares were observed. B-class flares are relatively common; there have been at least three B-class flares in the last week.
The recent activity occurred in an otherwise quiet area of the Sun, providing an example of activity that did not originate from a sunspot – the darkened, magnetically active patches on the solar surface that often spawn flares and CMEs.
The flare was first seen by NASA’s Solar Dynamics Observatory, which has kept a constant eye on the Sun for over a decade.