Waiting and Wondering …

Carolyn PorcoCarolyn Porco

Cassini Imaging Team Leader

I woke up unusually early this morning, on pins and needles, and looked
out my bedroom window from my house on a narrow ridge in northern
Boulder Colorado, onto the foothills of the Rocky Mountains and the
town below, and wondered how the day would unfold.  I paused to let my
gaze fly, in my mind, beyond the horizon and around and over the Earth,
pulling back in `powers of ten’ fashion, imagining our planet suspended
in space.  And I thought about how remarkable the inhabitants of that
small blue world truly are, and how extraordinary their achievements
over these past 4 years have been.

Those years of intensive examination of an alien planetary system have
brought us humans to this juncture, right now, awaiting news from clear
across the solar system of the outcome of our latest bold experiment in
interplanetary maneuvering, focused on one of the most fascinating
places in our solar system… a place we never even knew existed before
we set out on this adventure.

In this painstaking work, we proceed, step by step, to lay bare those
things which hold the greatest promise of comprehension, the greatest
significance for piecing together the story of the origins of the
bodies in our solar system, our Earth, and indeed ourselves.

The images we await now are just a few of those steps.  I wonder: What
will they show?


Today,Monday August 11th,Is the Day!

John SpencerJohn Spencer

Cassini Scientist on the Composite Infrared Spectrometer (bio)

Our next Enceladus encounter is very soon, at 21:06 Universal Time or 14:06pm Pacific time. This promises to be a spectacular encounter, giving our first high-resolution sunlit view of the south polar region since the discovery of activity there three years ago (the most recent encounter, in March 2008, observed the south pole only in the darkness of Saturn’s shadow). Our instrument, the Composite Infrared Spectrometer (CIRS), will be mapping the heat radiation from the warm tiger stripes as we did in last March’s flyby, but on that flyby our best views were from a range of 14,000 km (8,500 miles), allowing us to see details of the heat radiation on scales as small as 4 km (2.5 miles). This time we’ll start our observations from a range as close as 900 km (560 miles), showing us Enceladus in fabulous close-up, with CIRS mapping details as small as 270 meters (0.17 miles). As we scan the south pole we’re screaming away from Enceladus at nearly 18 kilometers/second (40,000 mph) so we have to work fast to make the most of this high-resolution opportunity.

heat radiation from tiger stripes
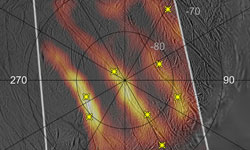
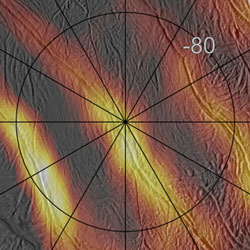
Image left: Heat radiation from tiger stripes. Full caption

I’m most excited about the observation we’ll be attempting at about 21:11 UT, when we will try to put the CIRS short-wavelength detector right along one of the most active tiger stripes, called Damascus Sulcus, from a distance of only 4,500 km (2,800 miles). On our last flyby we saw temperatures as high as at least 180 Kelvin (-135 Fahrenheit) on this part of Damascus, from 15,000 km (9,000 mile) range, and from three times closer we might see even higher temperatures because the warm material, which we think occupies a strip just tens or hundreds of meters wide along the fractures, will fill more of our detector and give us a more accurate reading. However, this is a challenging observation because our detector consists of a linear array of ten pixels, which will be aligned parallel to the fracture. Pointing may not be perfect this close to the moon, so we may get all ten detectors, or none of them, on Damascus. You might ask why we didn’t align the detector across the fracture rather than parallel to it, to be sure that at least some of our pixels would fall on the warm material. But we needed to align the spacecraft in the direction that allows it to rotate as fast as possible to keep up with Enceladus as we zoom past, and we didn’t have the luxury of also optimizing the orientation of the detector.

The animation to the right depicts Cassini flying close to Enceladus.

So tomorrow morning, when we hope the data will be processed and ready for us to look at, we’ll be both nervous and excited to see if this particular gamble paid off. But even if we are unlucky in this case, we’ll get lots of other spectacular data. Here’s a blow-by-blow account of the planned CIRS observations of the south pole, with times given in Universal Time (UT):
21:07-21:11 UT Very high resolution scan of the tiger stripes, riding along with the ISS camera “skeet shoot” observation that Amanda described in her previous blog entry, and ending with that view of Damascus Sulcus that I discussed above.

21:11-21:34 UT Ride along with the ISS camera mosaic of the south pole- more very valuable high-resolution views of selected locations on and near the tiger stripes.

21:36-21:50 UT A long-wavelength map of the entire southern hemisphere, which will allow us to measure total heat flow from the active south polar region. Enceladus enters Saturn’s shadow during this period, at 21:41.

21:52-22:09 UT A single scan of the south pole using our short-wavelength detectors, which will pick up the small part of the tiger stripes, along Alexandria Sulcus, that we missed in our March 2008 scan.

22:10-22:56 UT A global 7-16 micron map of the southern hemisphere with our short wavelength detectors, including the south pole, to look for changes in thermal emission since previous observations.

22:57-23:37 UT A stare at Damascus Sulcus with each of our two short-wavelength detectors, to give other instruments a chance to watch Enceladus in eclipse.

23:37-23:55 UT A maneuver to change the spacecraft orientation.

23:55-00:24 UT Watch the warming of Enceladus as it emerges from Saturn’s shadow at 00:07 UT, with the our long-wavelength detector.

00:25-00:42 UT ISS camera and VIMS compositional maps of the now-sunlit south pole.

00:42-01:04 UT Complete the CIRS long-wavelength observation of the post-eclipse warming.
It’s going to be one heck of a ride- I’ll report back once we’ve had a look at our data.

Flyby Underway!

Todd BarberTodd Barber,
Cassini Lead Propulsion Engineer (bio)


Best wishes from Pasadena, California on this fine day!  As I write
the highly anticipated Enceladus flyby is underway.

I was in the office this weekend trying to get caught up a bit (a
weekend tradition), allowing me to hit the ground running on another
busy work week.  This week holds exciting promise and scientific
anticipation, though, in addition to my typical engineering duties.
Over the weekend, we did two Reaction Wheel Assembly (RWA) biases to
optimize the rotational speeds of these objects.  Through angular
momentum changes, these wheels can turn and point the spacecraft,
allowing incredible precision.  One of my tasks is to calculate how
much propellant these biases use, so that’s one thing I’m working on
today.

arist concept of Enceladus flyby
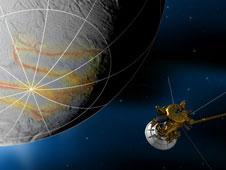
Speaking of propellant usage, there have been some questions about how
much propellant we will use in the maneuvers around Enceladus and for
the flyby itself.  As I mentioned in my prior blog entry, we were
actually able to cancel our approach maneuver, OTM-163.  In addition,
the next propulsive maneuver (OTM-164) is nearly two weeks off,
setting up Cassini for solar conjunction and yet another Enceladus
encounter (E5) in October.  OTM-164 will be rather large, however,
using roughly 10 kg of bipropellant, about 6 kg of nitrogen tetroxide
(oxidizer) and 4 kg of monomethylhydrazine (fuel).  For the E4
encounter itself, I don’t have a propellant-usage prediction handy,
but I can tell you it will be at most a few tens of grams of hydrazine
(the monopropellant fuel), for yet another RWA bias.

The bottom line is that we have plenty of propellant for our two-year
extended mission and beyond.  Thanks for that great question, and
we’ll see all of you on the other side of Enceladus!

Todd

Enceladus August Flyby Preview

Amanda Hendrix

Cassini Scientist on the Ultraviolet Imaging Spectrograph (bio)

Hi everybody,

Well, after the successful and exciting Enceladus flyby in March … we’re doing it again!!  Cassini is executing a close pass by the little active moon, on Monday, August 11. Woo hoo!


This is the 5th close Enceladus flyby we’ve done. The first was in February 2005 (that one was not an official “targeted” flyby), the 2nd was in March 2005, the 3rd was July 2005 and the 4th was in March 2008. This is the 4th targeted flyby, so it’s sometimes referred to as E4.


It’s super exciting, because we’ll pass just about 50 kilometers (30 miles) from the surface, and fly into the plume at the south pole. This is similar flyby geometry to the pass we did in March 2008 — but this time, the focus is on the imaging instruments.  (Recall in the March flyby – E3 – the spacecraft was oriented to optimize measurements by the fields and particles instruments, especially the INMS-Ion and Neutral Mass Spectrometer–so they could “taste” the plume as we flew through.) This time, the spacecraft will be oriented to optimize imaging of the south polar region – to get the highest possible resolution images of those tiger stripes, the primary sources of the jets that feed the plume.


Here’s a little overview of what’s going to happen during the flyby, focusing on the remote sensing measurements. Have a look at the accompanying cool movie (put together by navigator extraordinaire and all around heckuva guy Brent Buffington). Some of it goes by pretty fast, so you might want to go through it a few times to absorb what’s happening. I’ll talk you through it.


At the beginning of the Enceladus segment, Enceladus is still pretty far away and small. We start with a long (6.5 hr) observation where ISS (the Imaging Subsystem – the movie shows the Narrow Angle Camera, or NAC, as a white box) is the “prime” instrument (but all the other cameras — ultraviolet, infrared, long-wave infrared – are taking data too). So ISS scans around, to sort of map out the environment of Enceladus and probe into any visible plume material around Enceladus. We then turn to Earth for a short (3 hr) downlink. We want the solid-state recorders (SSRs, where the data are stored until downlink) to be as empty as possible before we get closer to Enceladus and want to really fill them up with a lot of bits of good data. After the short downlink, we turn back to Enceladus and this time VIMS (the Visual and Infrared Mapping Spectrometer – with the field-of-view indicated by the red box) is the “prime” instrument. Enceladus is still small so we’re just staring and building up signal as we get closer and closer, to get good signal-to-noise spectra to understand the composition of Enceladus. By the end of the VIMS observation, Enceladus is just about fills the NAC. By the way, we’re coming in over the northern hemisphere of Enceladus; this is a relatively old part of the moon, which is apparent from the amount of craters present. Still not nearly as many craters as the Earth’s moon or Rhea, but it’s pretty heavily cratered for Enceladus. (The south polar region has *no* craters – since all that geologic activity wipes them out.) But I digress! So after VIMS, we switch to UVIS (the Ultraviolet Imaging Spectrograph) as “prime” instrument. This is the long, skinny pink/magenta field-of-view that you see in the movie. UVIS does a slow scan of the space near Enceladus by orienting the slit several radii off the body and slowly scanning onto the bright limb. If there are neutral gases such as hydrogen or oxygen in the vicinity of Enceladus (and we expect there to be, since we know there’s H2O vapor in the plumes), this is a possible way to detect those species and map them out. So after UVIS, ISS is prime again. And now we get into the really cool part.


ISS starts off with a two-panel mosaic of the northern hemisphere. Since the trajectory is pretty similar to the E3 trajectory, these images will be pretty similar to the ones obtained back in March – but still neat. Then the spacecraft does a large turn to get ready and oriented for closest approach. The flyby is so close and fast that it isn’t possible to make observations throughout the pass – we simply can’t keep up. The plan since the beginning was to orient the spacecraft, just prior to closest approach, so that the cameras will observe the active south pole region at the highest resolution possible. Notice in the movie that the spacecraft does the big turn, and then the boresights are actually pointed away from Enceladus for just a little while — so that as we zip by the moon, we’ll capture the south pole. So the imaging team (and I think Paul Helfenstein was primarily responsible) came up with this “skeet shoot” plan to execute 7 NAC frames across the tiger stripes, with resolutions between just 7 and 28 meters per pixel! Such high resolution images, combined with context frames, will really help in understanding the cracks and jets, and will provide clues to the origin of the plume. So the 7 frames are taken in under 3.5 min, and then 7 more are taken at resolutions up to 140 meters per pixel over the next 20 minutes or so. (The other instruments are “riding along” to get compositional and temperature information.) Note that the south pole is partly in darkness, and we’re moving fast, so the images and exposure times are carefully planned to balance light and smear. Images close to the terminator will really bring out the topography of the region, so they should be pretty spectacular.


After ISS is finished, CIRS takes over. CIRS is the Composite Infrared Mapping Spectrometer – the instrument that can “see in the dark” and map surface temperatures. CIRS becomes “prime” and does a few scans with their FP1 slit (the red circle) and their FP3 slits (the two little red rectangles). These observations will complement the *great* measurements made by CIRS on the last flyby in March (E3). Note that at about 21:41, Enceladus goes into Saturn eclipse – so there’ll be very little reflected solar light off Enceladus, which creates ideal conditions for measuring heat coming from within Enceladus. Enceladus comes out of eclipse at ~00:07. At ~01:06, or 4 hours after closest approach, VIMS is prime again for 1 hour, to get more compositional information on the south pole. We then turn to Earth for a 5 hour downlink. Then we turn back to Enceladus for a final stare with UVIS as prime instrument.


Recall that equinox is coming up in a year — Aug. 11, 2009 – and as we approach equinox (and solstice after that) the south pole is dominated more and more by darkness. So it’s really important that we get as many good looks at this wild south pole while we can! Of course, CIRS can do a lot of science even if the pole is in complete darkness – and later in the mission those will be important measurements to make, in case there is any seasonal input to the plume activity.


Whew! I’ve written a lot and hopefully haven’t bored you all completely to tears … I’m obviously very excited about this flyby and hope that you are too! Thanks for reading and coming along with us to explore Enceladus.


Amanda


Prepare to be Amazed!

Carolyn PorcoCarolyn Porco

Cassini Imaging Team Leader


So here we are, getting ready to bear down … again … on one of the most remarkable places in the solar system. Only this time, our encounter with Enceladus could be the best of them all for us imaging scientists, who are hoping to peer deep into the fractures at the surface sources of Enceladus’ spectacular jets. (see image below and read more about it here.)

  Enceladus

In fact, there have only been a few times during this whole mission when I was more anxious and sleepless with anticipation than I am now:  on approach to Saturn and waiting for the first sighting of landforms on the surface of Titan, anticipating the Saturn Orbit Insertion imaging sequence and wondering what the finest looks we would have of the rings might show us, and waiting for the first close-up high-phase image of the Enceladus jets around Thanksgiving 2005 … the image that has been seared into the minds of all of us.


This upcoming flyby holds that kind of fascination for me, because we have the chance of seeing those very special locales on the tiger stripe fractures that we now know are active, warm eruption vents and because of the daring targeting technique of `skeet shooting’ that has been employed to make it happen.  Estimates of the tidal stresses across the south polar region indicate that over the course of an Enceladus’ orbit, the vents could open by as much as 1/2 meter (about 2 feet). We won’t see such openings even in our highest resolution images, but maybe … just maybe … we might see other evidence of eruption, either something geologically unusual or banks of snow where icy particles in the jets fall back to the ground. Whatever we see, this will definitely be a first and very unusual event. We all are so very privileged to be here, alive, now, and living the dream of so many who came before us   …. to fly, to explore, to learn.


sout pole of Enceladus, stars indicate vent locationsI will say what I said four years ago as we were first entering the Saturn system and about to begin our explorations of this mysterious and far-away place … a time that now seems like a lifetime ago:  Prepare to be amazed!


Image left: Heat radiating from the entire length of 150 kilometer (95 mile)-long fractures is seen in this best-yet heat map of the active south polar region of Saturn’s ice moon Enceladus. The stars indicate the location of vents. More about the image 

Spilling the Beans

John SpencerJohn Spencer, Cassini Scientist on the Composite Infrared Spectrometer (bio)

Well, now it can be told!  It’s frustrating for me to sit on exciting
new results – when we’ve found something cool in our data I want to
tell everyone all about it right away.  But it’s important to present
mission results in a coherent and coordinated way, and of course we
have to take the time to be sure we have our facts straight.  So
we’ve waited till today, Wednesday 26th March, 2 weeks after the
close Enceladus flyby, to spill the beans.

The days after the Wednesday March 12th Enceladus flyby were a blur
of frenzied activity for me as I worked to find the goodies in the
tens of megabytes of data that Cassini’s Composite Infrared
Spectrometer (CIRS) instrument had gathered during the flyby.  My
first peek at the uncalibrated data the next day, on Thursday
afternoon, was already thrilling – the glow of the tiger stripes was
visible not just at the usual 9 – 16 micron wavelength range where
we’d seen them before, but at wavelengths as short as 7 microns.  
Shorter wavelengths mean hotter temperatures (in the same way that
white-hot is hotter than red-hot), so it looked like the fractures
might be warmer than we had thought.  By the time I got all the files
I needed for the full analysis, from CIRS’s home at the Goddard
Spaceflight Center, it was time for dinner.  Precious ones and zeros
that had been flying through the Saturn system onboard Cassini 24
hours earlier, and squirted overnight across the solar system at the
speed of light, made the final leg of their journey to analysis by
bicycle, as I cycled home with my laptop.

After dinner I got comfortable on the sofa and dived in.  By bedtime
I had a preliminary map of the heat radiation from the south pole, at
four times the resolution of our previous best map.  Each of the four
tiger stripe fractures, clearly resolved in the thermal infrared for
the first time, lit up with the bright glow of internal heat.  A
couple of other fractures, not previously suspected to be active,
were warm too.  By Friday afternoon I also had preliminary
temperature estimates for the fractures- yes, they were pretty warm,
at least 180 Kelvin!  That’s -135 Fahrenheit, which isn’t exactly
toasty until you consider that the surrounding terrain is at around
65 Kelvin or -342 Fahrenheit.  The highest temperatures we’d seen on
the previous flyby in July 2005 were much lower, around 145 Kelvin
(-198 Fahrenheit)- not because Enceladus’s fractures were cooler
then, but because the older, more distant, scans were less
sensitive.  If it’s 180 K on the surface it must be even warmer down
below, perhaps approaching the magic number of 273 Kelvin or +32
Fahrenheit, where Enceladus’ ubiquitous ice can melt to form the holy
grail of astrobiology, liquid water.

Since that initial frenzy I’ve been checking calibration and refining
details, preparing graphics for today’s press briefing, and hearing
by e-mail and telecons about all the great data that was gathered by
the rest of Cassini’s arsenal of science instruments during the
flyby, some of which will be revealed by Hunter Waite at today’s
telecon.  We’ve also been modifying plans for upcoming flybys based
on the new data- we now know the hottest and most interesting parts
of the south polar region and can zero in on them next time.  Already
the theoretically-inclined members of the Cassini science team are
honing their models of the south polar plumes based on the new
findings, and the rest of the planetary science community will soon
be following suit.  And this is just the beginning- there are seven
more Enceladus flybys to come in the next two years.

I’ll end this blog with a big thank you to the rest of the CIRS
team.  I’ve been doing the fun job of analyzing these data, but there
would be no CIRS data to analyze without the tireless efforts of the
many folks at Goddard Spaceflight Center who designed and built CIRS
back in the 1990s, keep it running, design the observations, and
calibrate the data.  Special thanks are due to my CIRS colleagues
John Pearl and Marcia Segura, and CIRS Principal Investigator Mike
Flasar.

Culling Through It All!

Linda SpilkerLinda Spilker, Cassini Deputy Project Scientist
 
It’s been a whirlwind here at JPL as the data from the Enceladus flyby comes pouring in, and we scientists have been doing our thing . . . culling through it all! Sometimes there’s so much to choose from that I feel like a kid in a candy story.  There is much excited email chatter among the many Cassini teams, all suggesting awesome findings.  These first-looks are being matured by the team members, and we have begun to share and compare results. 

You may have already seen the press release from JPL explaining that the
Cosmic Dust Analyzer (CDA) had an unfortunate software hiccup at closest approach to Enceladus and their data was not recorded. The CDA instrument measures the composition of small particles that hit the instrument, which is an important thing to do at Enceladus to understand its geyser-like jets.  But like all small bumps on the road to discovery, we will find out what happened, fix it and get on with our business about the Saturn system.  And what an amazing system it is. 
 
On the very bright side, all of the other fields and particles instruments and remote sensing instruments, worked perfectly at Enceladus.  They are returning fantastic data and providing an incredible look around and inside the plume, and of the surface.  The fields and particles instruments are complementary to CDA and provide information on particle composition and characteristics, among other things.   
 
As soon as possible in the week or two ahead, we will be able to announce the preliminary results to the world.  Until then, I’m waiting like the rest of you are for these data sets to be analyzed, since the first-looks are looking so great!  Stay tuned for some Earth-shaking — I mean moon-shaking — results!
 
–Linda
 

A First Peek at the Data

John SpencerJohn Spencer, Cassini Scientist on the Composite Infrared Spectrometer (bio

Yesterday was a long day of waiting for our Composite Infrared
Spectrometer (CIRS) data from Wednesday’s Enceladus flyby.  CIRS’s
most important job on this encounter was to map the temperatures in
the active south polar region, to learn more about what warms the
“tiger stripe” fractures and measure the total amount of heat that
Enceladus is generating (the current estimate, based on earlier CIRS
data, is a whopping 6 GigaWatts).  Before I and others could do much
with the new data, they had to be calibrated, and calibration of CIRS
data, which is done by the CIRS team at Goddard Spaceflight Center in
Maryland, is pretty complicated.  It turned out there were some
hiccups in the calibration process, and though the team was working
as fast as they could, everything took longer than expected.

So all through the morning I was reading excited e-mails from members
of other instrument teams, enthusiastically describing their first
look at their data, without being able to contribute any news from
CIRS.  I *did* copy over some files early in the day, but when I
learned that they were only partially calibrated, I decided to wait
for the good stuff – I concentrated on getting my software ready instead.

Marcia Segura at Goddard, who did the detailed designs for these
observations, kept me posted on the progress of the work at Goddard,
and by mid-afternoon it looked like the final calibration was still a
couple of hours away.   So I broke down and took a quick-and-dirty
look at the preliminary files I’d downloaded in the morning.  And
they showed …  well, I can’t tell you, because we still need to
properly calibrate and check everything, and make sure we don’t
announce any results that turn out to be wrong on closer inspection.
But I’m pretty happy with what I saw, and we (and the other
instrument teams) hope to have some cool findings to release in the
next few weeks.

Greetings From Houston

                             
Amanda HendrixAmanda Hendrix, Cassini Scientist on the Ultraviolet Imaging Spectrograph
(bio)

So here I am in Houston at the Lunar and Planetary Science Conference (aka LPSC). It’s Tuesday morning and yesterday was an interesting day, filled mainly with results from the first MESSENGER flyby of Mercury. Thursday afternoon there’s a session dedicated to Enceladus with talks on topics such as the possibility of a near-surface ocean, frictional heating, and crater chains. So I’ll be yawning my way through that session — not that it won’t be interesting, but I’m planning to stay up most of Wednesday night to watch my science data come in from tomorrow’s exciting Enceladus flyby! I’m super excited about it, and crossing my fingers that everything goes as planned.  Also, tomorrow at noon, Alan Stern (Associate Administrator of the Science Mission Directorate at NASA HQ) will give a talk — I’m hoping he’ll mention the Enceladus flyby!

More soon from LPSC …

–Amanda

Waiting for Hidden Treasures

Linda SpilkerLinda Spilker, Cassini Deputy Project Scientist

I just got the good news that the playback has ended.  Now for the fun part!   I am eagerly waiting to see what new discoveries are buried in the bits streaming back from Cassini.

All sorts of questions are running through my head.  I wonder if the Ion and Neutral Mass Spectrometer (INMS) will find more exotic hydrocarbons in the gases it samples deeper in Enceladus’ geysers.  Will the magnetometer find an induced magnetic field that points to an ocean just under Enceladus’ crust?  If there is a water ocean, what are the chances that life might exist in it?

As a Composite Infrared Spectrometer (CIRS) co-investigator, I am especially interested in the new thermal maps of the south polar region.  I am eager to find out if any of the hot spots that our instrument saw back in July 2005 disappeared or if any new hot spots appeared, indicating that the geysers might change locations.  Given the golden opportunity to observe Enceladus up close during an eclipse, I wonder how quickly the surface of Enceladus warms up once sunlight hits it again.  With Enceladus’ fluffy surface, will it warm up faster than any other moon circling Saturn?
 
You’d think that being a veteran of icy satellite flybys this would be old hat for me by now, but each flyby is just as exciting as the one before it!