|
Ames scientist Kimberly Ennico wrote this blog entry on July 20, 2012 while working on a field test for RESOLVE, the Regolith and Environment Science and Oxygen and Lunar Volatile Extraction.
|
43rd anniversary of “One small step, One giant leap”
I write this after the conclusion of our multi-day field demo of the RESOLVE payload. Prior to any activity, as with all organized operational tests, a clear set of success criteria is identified. RESOLVE, having being defined by NASA’s exploration and technology divisions, has the following goals:
CAT 1 Objectives (Mandatory):
1. Travel at least 100m on-site to map the horizontal distribution of volatiles
CAT 2 Objectives (Highly Desirable):
1. Perform at least 1 coring operation. Process all regolith in the drill system acquired during the coring operation
2. Perform at least 1 water droplet demo during volatile analysis.
CAT 3 Objectives (Desirable):
1. Map the horizontal distribution of volatiles over a point to point distance of 500m.
* Surface exploration objective is 1km
2. Perform coring operations and process regolith at a minimum of 3 locations.
3. Volatile analysis will be performed on at least 4 segments from each core to achieve a vertical resolution of 25cm or better.
4. Perform a minimum of 3 augering (drilling) operations
* Surface exploration objective is 6 augers
5. Perform at least 2 total water droplet demos. Perform 1 in conjunction with hydrogen reduction and perform 1 during low temperature volatile analysis.
CAT 4 Objectives (Goals):
1. Perform 2 coring operations separated by at least 500m straight line distance
* Surface exploration is 1km
2. Travel 3km total regardless of direction
3. Travel directly to local areas of interest associated with possible retention of hydrogen
4. Process regolith from 5 cores
5. Perform hardware activities that can be used to further develop surface exploration technologies
At first glance, they are pretty much very operations based: 100 m (328 ft) here, 1 km (3,281 ft) there, three locations, three auger (drilling) ops, etc. They were the driving forces of this demo, no pun intended. Our main focus was to demonstrate the technology and the operations. However, as each day went on, you could hear on the voice loop the engineers asking more and more about what we scientists – those on site or in our “Ames science backroom” – were discussing and observing with each new scan, spectra, and image. Also, we actually found ourselves demonstrating science in this activity. That was the whole beauty of this project: science enabling exploration and exploration enabling science. Each team member, excited about roles played by others, united by our shared excitement in the concept of pushing our ability to explore beyond our home planet.
At the end of our field demo, we clocked 1,140 m (3,740 ft.) total in-simulation roving distance, 475 m (1,558 ft.) separation travel distance between hot spots, with total separation of traverses greater than 500 m. (1,640 ft.) We located nine hot spots, completed four auger operations, four drill operations, and four core segment transfers to the crucible (oven) for volatile analysis and characterization. We had seven remote operations centers plugged in to our central system. We logged 185,918 rover positions, collected 227,880 near-infrared spectra, 136,273 neutron spectrometer measurements, 139,703 drill measurements, 3,630 image data products, and wrote 2,446 console log entries.

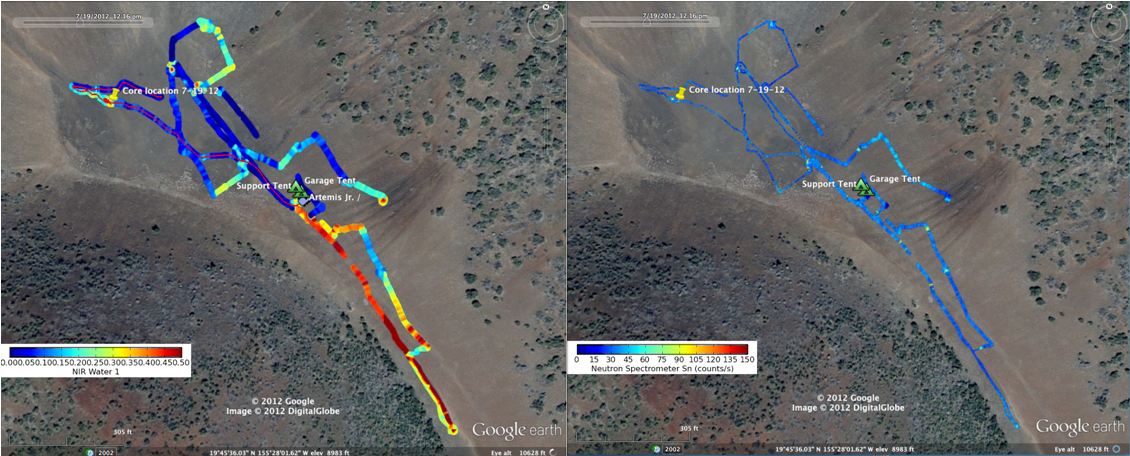
Band-depth (a measurement of abundance) for a water band (at 1.5 microns) plotted for the whole simulation. Most of the water detected this way turned out to be “grass” in the spectrometer’s field of view, but we did rove over some pretty “dry areas.” Variety indeed. The red line shows our traverse path on July 19. (Right) Counts for the neutron spectrometer for the simulation. This aerial photo shows how we traversed over a range of geological features, a mixture of glacial (old outwash) and volcanic (olivine basalt) deposits. Image credit: NASA
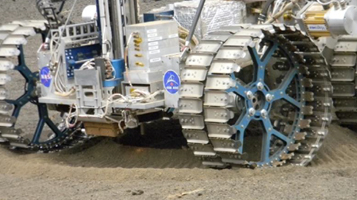
While some of the ISRU technology demonstrations focused on pre-arranged drill tubes filled with pre-planned test materials, we were particularly excited to drill into the native tephra. Its saturated soil (up to 20%) is more consistent with the Mars surface rather than the lunar surface. If successful, this test also would show practical drill performance parameters for future Mars drill missions. The approved procedures allowed us to core down to a maximum of 50 cm (19.6 inches). We reached 45 cm in about 56 minutes. Then, instead of putting the sample into the oven, the core tube was “tapped” out onto the surface while the rover moved forward to lay out the sample for evaluation by the near infrared and neutron spectrometers. This was a new procedure developed jointly by the rover, drill, and science teams, which demonstrated a new way of extracting material and quickly evaluating it.

Artemis Jr rover DESTIN (drill) acquiring sample from native soil. Image credit: NASA

The Ames science backroom team, clockwise from top left: Erin Fritzler, project manager; Bob McMurray, system engineer; Kayla La France, intern; Ted Roush, scientist; Carol Stoker standing, scientist; and Jen Heldmann, scientist. Not shown: Stephanie Morse, system engineer; Josh Benton, electrical engineer; and me – Kim Ennico, scientist. With our team of nine people we staffed three consoles in two shifts, for eight-days.

Ames science team members in Hawaii. They were our main interface for the Ames backroom to the Flight, Rover and Drill teams, whose leads were in Hawaii, but whose support teams were at KSC in Florida, JSC in Texas, and CSA in Canada. Left to right: Rick Elphic, Real Time Science and Tony Colaprete, Spec. Photo by Matt Deans.
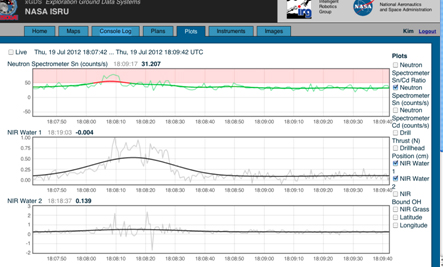
To end on a fun note: mid-way through the sim, I got my updated console request so I could monitor the neutron spectrometer and near infrared spectrometer simultaneously to look for correlations (this combination of techniques had never been done before). I spotted this one (image below) as we were roving about. Camera imagery had been down, so we were “in the dark” from visual clues. Upon seeing the two signals, I called out a strong hydrogen and water signal to the Science team in Hawaii over the voice loop.

Screengrab of one of my console screens. Top trace is the neutron spectrometer Sn counts showing a modest signal. Bottom traces are two different near-infrared water spectral regions that showed changes at the same time.
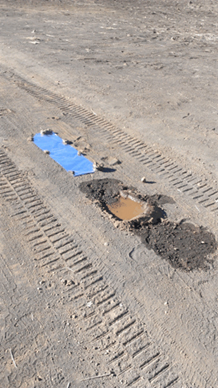
And it turns out we roved over this, a trench of water and a piece of aluminum foil reflecting the clear blue Hawaiian skies. The neutron spectrometer is designed to detect hydrogen at depth, whereas our near infrared spectrometer is more suited for surface water.

A test target along traverse path for July 19. Image credit: NASA
This target, like others we traversed over the past week (buried pieces of plastic, netting, etc.) had been dug out in the wee hours of the morning by other members of the RESOLVE operations team. Good way to get a few hours exercise after being cooped up behind monitors!
So what’s next? A “lessons learned” exercise is called out for next week. The different teams wrote down our learning points daily when they were fresh in our minds. We will review them as a team and move forward with the next steps – building a version that works in a vacuum. And our Ames backroom science team has identified a few science papers to write. We are excited!
For more information about the In-Situ Resource Utilization analog field test and the RESOLVE experiment package, visit www.nasa.gov/exploration/analogs/isru
