NASA Prepares for Hurricane Zeta

A natural-color image of Hurricane Zeta (above) was acquired in the late morning on October 28, 2020, by the Moderate Resolution Imaging Spectroradiometer (MODIS) on NASA’s Terra satellite. Cameras mounted on the International Space Station captured video footage of the storm (below) just before 1 p.m. that day. Credit: NASA’s Earth Observatory

By Jacob Reed, NASA Earth Applied Sciences Disaster Program

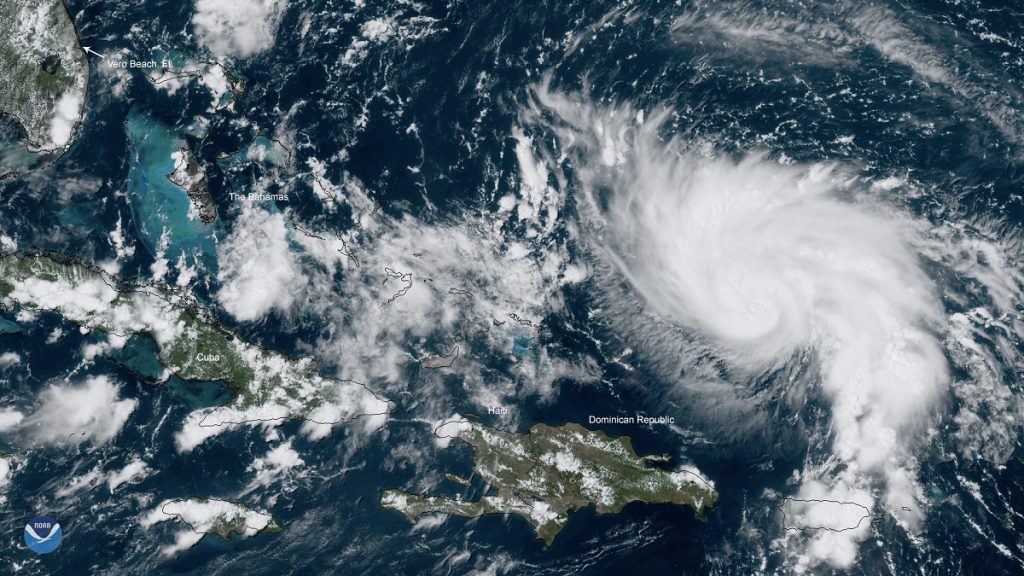
As Tropical Storm Zeta makes landfall on the U.S. Gulf Coast, NASA has eyes on the storm with an array of Earth-observing instruments and stands ready to aid affected communities with critical data and analysis.

Zeta is following a path similar to Hurricane Delta, which after crossing the Yucatan Peninsula made its way across the Gulf of Mexico and struck the Louisiana coast as a Category 2 hurricane on October 9. As Zeta makes landfall along the northern Gulf Coast, it’s the 7th named storm to do so in this record-breaking season, following Tropical Storm Cristobal, Hurricane Laura, Tropical Storm Marco, Hurricane Sally, Tropical Storm Beta, and Hurricane Delta.

Tropical Storm Zeta is the 27th named storm of 2020, which ties the record with 2005 for the most named storms. The 2020 season is also only the second time in recorded history (the other being 2005) that the Greek alphabet has been used because the number of named storms has exceeded the number of regular names on the list. With several weeks still left in the 2020 hurricane season, 2020 is expected to surpass this previous record for most named storms in one season.

Mapping Rainfall Rates and Structure

Zeta originated in the western Caribbean from a broad area of low pressure. Originally inhibited by changes in wind speeds and directions – also known as wind shear – the system was slow to develop. But by the late afternoon of Saturday October 24, the National Hurricane Center (NHC) reported that a tropical depression had formed, the 28th of the season. Nine hours later the system was upgraded to a tropical storm and given the name Zeta. Over the next twelve hours, Zeta remained nearly stationary and unable to intensify further. It was at about this time that the Global Precipitation Measurement Mission (GPM) Core Observatory satellite flew over Zeta at 2:15pm CDT (19:15 UTC), as shown in the animation.

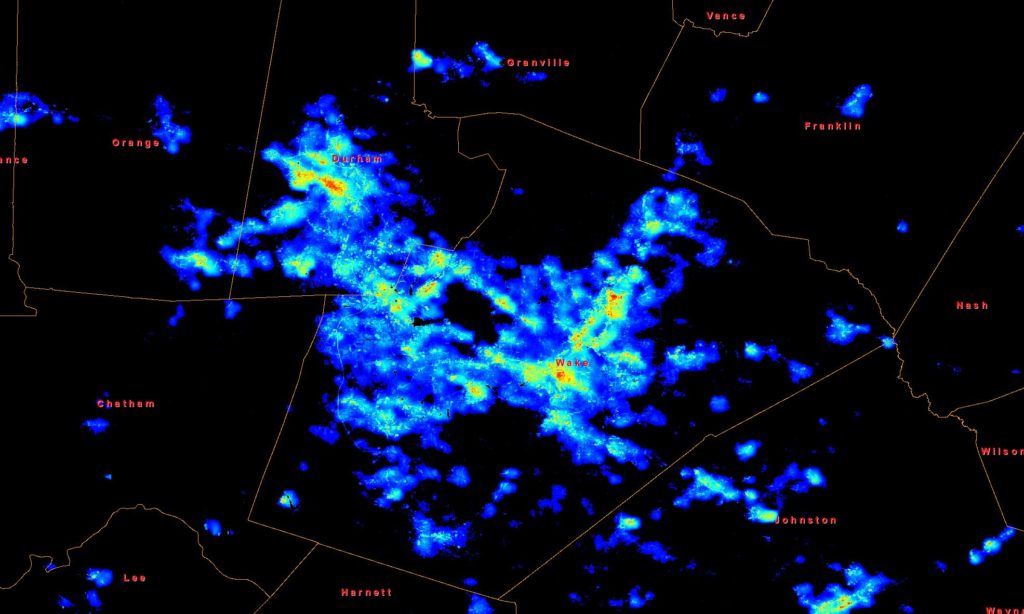
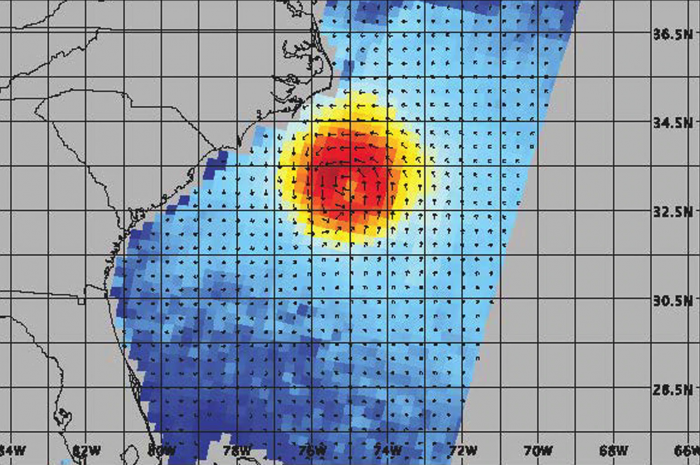
GPM overpass of Tropical Storm Zeta on October 25 at approximately 2:15pm CDT (19:15 UTC). Half-hourly rainfall estimates from NASA’s multi-satellite IMERG dataset are shown in 2D on the ground, while rainfall rates from GPM’s DPR instrument are shown as a 3D point cloud, with liquid precipitation shown in green, yellow and red, and frozen precipitation shown in blue and purple. Credit: NASA Goddard Scientific Visualization Studio

Here, rainfall rates derived from the GPM Microwave Imager (GMI) and Dual-frequency Precipitation Radar (DPR) instruments provide a detailed look at Zeta. While broad bands of rain circle the storm, GPM shows that the center itself is ragged and the eye of the storm is asymmetric. Warm, moist air rising up through the atmosphere (shown by the blue surface indicating the top heights of rain clouds) is producing very heavy rainfall (shown in dark red and magenta) near the center. These processes release heat near the center of the circulating storm, helping to consolidate it. At the time of the overpass, Zeta was still classified as a weak tropical storm with maximum sustained winds reported at 40 mph by the National Hurricane Center.

Zeta began to slowly but steadily strengthen, becoming a strong tropical storm overnight with sustained winds just below hurricane intensity early the next morning. Finally, at 2:10pm CDT on the October 26, Zeta reached hurricane intensity.

At this time Zeta was about 105 miles southeast of Cozumel, Mexico and moving northwest. Zeta would go on to make landfall near Tulum at 11:10pm CDT as a Category 1 storm with maximum sustained winds reported at 80 mph by the National Hurricane Center. After crossing the Yucatan Peninsula, Zeta weakened back down to a tropical storm, but re-emerged over the southern Gulf of Mexico. Surface water temperatures were running slightly above normal in this area – still at or above ~82.4 F (28 C), which is well above the ~78.8 F (26 C) typically needed to allow for intensification.

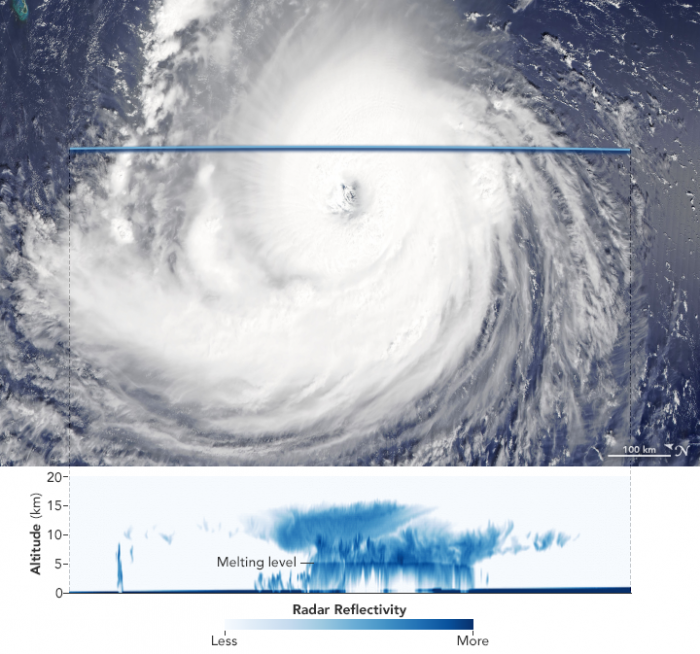
GPM Core Observatory overpass of Tropical Storm Zeta on October 28 at approximately 3:25am CDT (8:25 UTC). Credit: NASA Goddard Scientific Visualization Studio

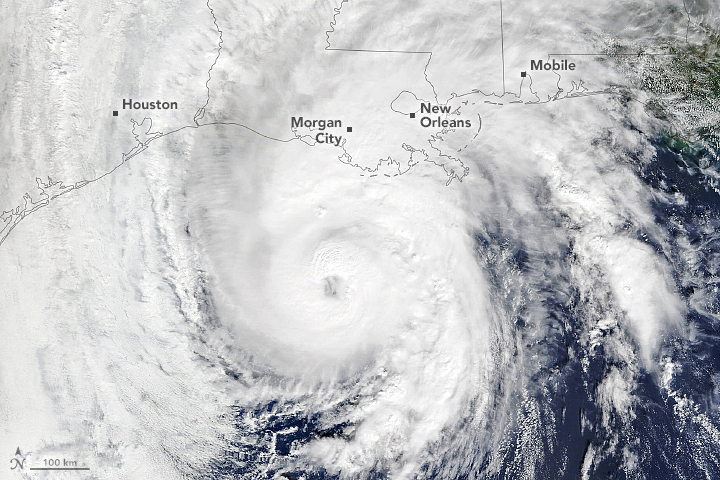
GPM flew over Zeta again early the morning of October 28, around 3:25am CDT (8:25 UTC) as it was strengthening in the Gulf of Mexico and headed for landfall in southeastern Louisiana. Data captured by the DPR show a symmetric storm, with a clear eye surrounded by tall thunderstorms—an indicator that the storm was strengthening after encountering the Yucatan Peninsula a day earlier.

Shortly after this overpass, the National Hurricane Center reported that Zeta had re-intensified to a Category 1 hurricane, and the NHC currently says Zeta is a Category 2 hurricane as it makes landfall along the southern coast of Louisiana Wednesday evening.

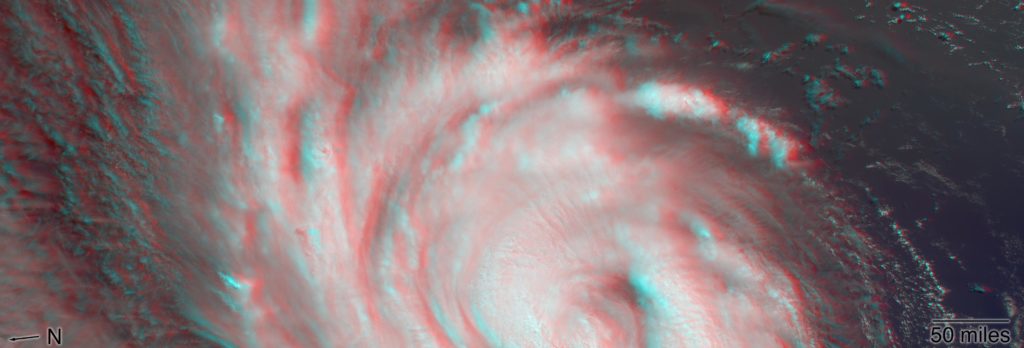
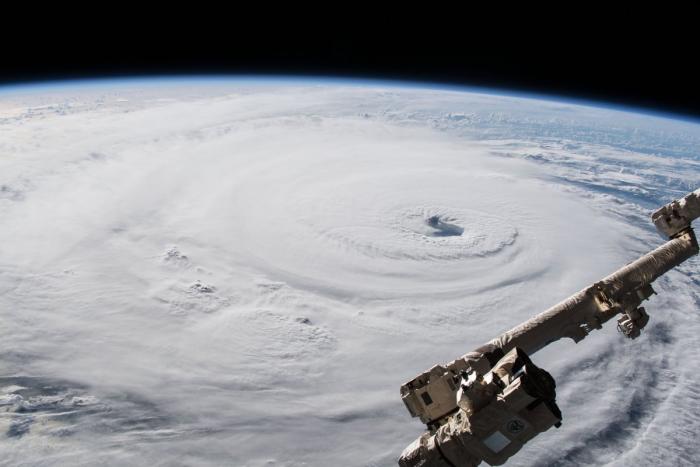
Cameras outside the International Space Station captured dramatic views of Hurricane Zeta at 12:50 pm ET October 28, as it churned 200 miles south-southwest of New Orleans packing winds of 90 miles an hour. Credit: NASA

Aiding Risk Reduction, Response and Recovery

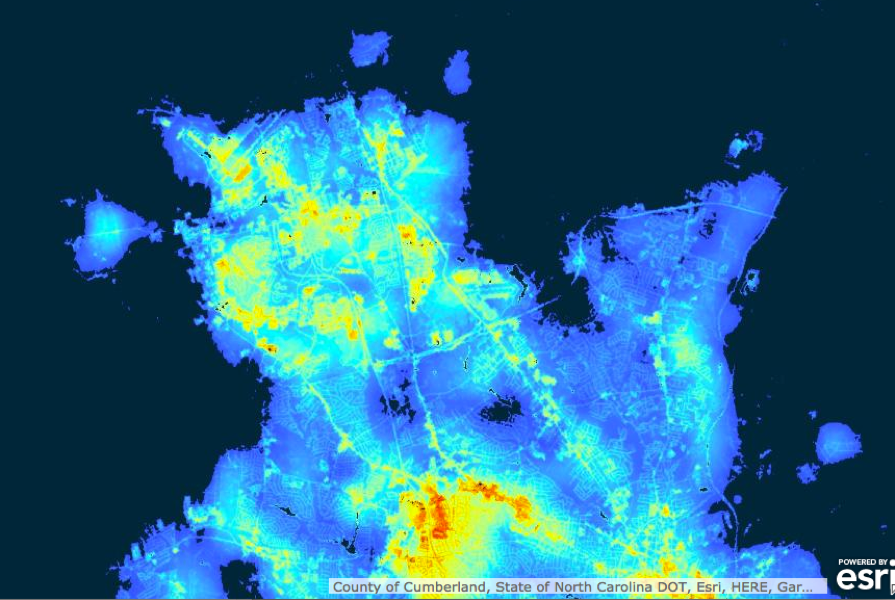
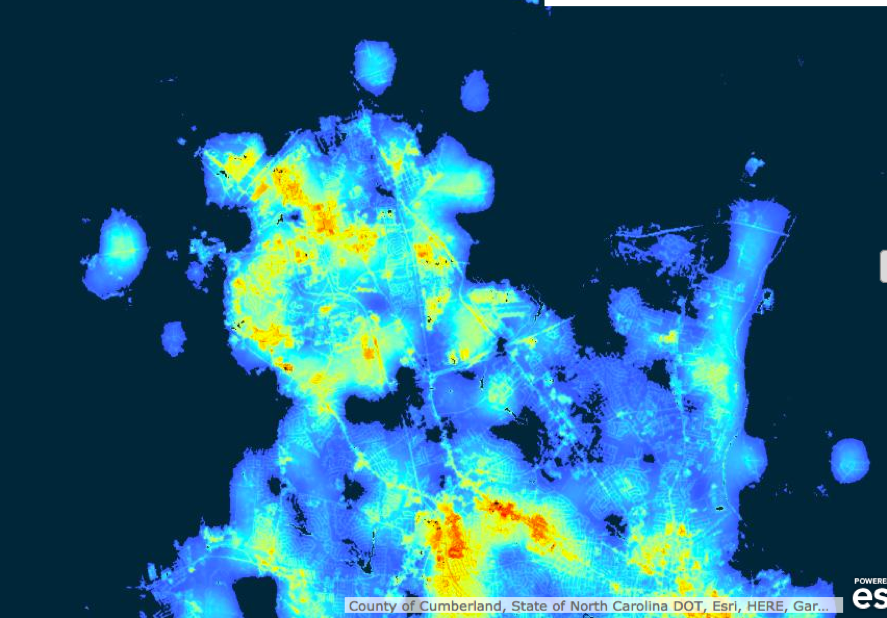
To aid local communities in preparing for and recovering from hurricanes and other disasters, the NASA Earth Applied Sciences Disasters Program coordinates a team of experts across NASA centers to provide vital Earth-observing data and analysis. For Hurricanes Laura, Sally, and Delta, the program worked closely with stakeholders from the Federal Emergency Management Agency (FEMA), the Louisiana National Guard, and the Alabama Emergency Management Agency to provide guidance and analysis both in meetings and through data distributed on the NASA Disasters Mapping Portal. Near real-time data for tracking the storm is also made available on the portal’s Tropical Cyclone Dashboard. The program stands ready to continue to work with these agencies and provide assistance for Hurricane Zeta should the need arise.

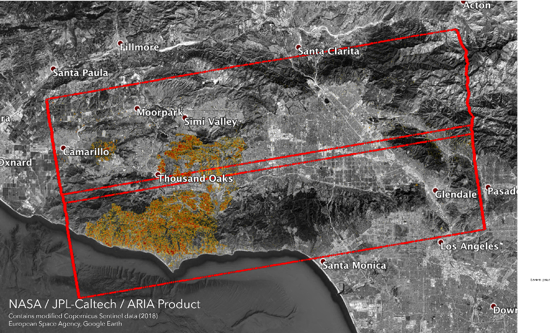
Combining multiple datasets and tools allows NASA to see the big picture of a storm and its impacts, and helps answer broader questions about how communities can better prepare for, and recover from, the storms of the future. For Hurricane Zeta, researchers will have a unique opportunity to gauge the vulnerability or resilience of a region that was recently impacted by several destructive storms, and to study their compounding effects. Attempting to determine what damage was caused by which storm will be a challenging task on its own. However, attempting to answer these tough questions can provide critical guidance to help communities build back better and strengthen them for the disasters and challenges that lie ahead.

Mapping Burned Areas From Southern California’s Bobcat Fire

A damage assessment map showing areas in Angeles National Forest that were likely damaged from the Bobcat Fire on September 7th, 8th, 13th, and 14th. Credits: Alaska Satellite Facility, NASA-JPL/Caltech, European Space Agency, NASA Earth Applied Sciences Disasters Program.
A damage assessment map showing areas in Angeles National Forest that were likely damaged from the Bobcat Fire on September 7th, 8th, 13th, and 14th. Credits: Alaska Satellite Facility, European Space Agency, NASA Earth Applied Sciences Disasters Program. The image contains modified Copernicus Sentinel data (2020), processed by ESA and analyzed by the NASA-JPL/Caltech ARIA team.

As wildfires continue to rage in the western U.S., NASA’s satellites are helping to track the burned areas and map damage in California and beyond.

One of those fires is the Bobcat Fire in Southern California, which has burned over 100,000 acres – making it one of the largest fires in Los Angeles County’s history. The Damage Proxy Map above shows areas in Angeles National Forest that were likely burned from the Bobcat Fire, ranging from moderate (yellow) to severe fire damage (red). Comparing the maps from September 7th, 8th, 13th and 14th shows how the fire spread over the course of the week, and how close the Bobcat Fire came to roads and other infrastructure.

NASA scientists with the Advanced Rapid Imaging and Analysis (ARIA) team at NASA’s Jet Propulsion Laboratory and California Institute of Technology created the maps using satellite data collected before and during the fires.

The NASA Earth Applied Sciences Disasters Program is working to provide maps like this one and other materials to regional agencies – including the California State Guard and the Federal Emergency Management Agency – to improve understanding of the impacts from the western U.S. fires and the potential risks to people, infrastructure, and the environment. Learn more about NASA’s efforts supporting the western U.S. fires on the NASA Disasters Mapping Portal and NASA Disasters website. – Sofie Bates


NASA Aids in Mapping Michigan Floods

A preliminary Flood Proxy Map shows in light blue areas that are likely flooded as of May 20 in Midland City, Michigan. Credits: NASA/ARIA-JPL/NCU/Planet Labs

Heavy rainfall starting on May 17 caused significant flooding in Michigan’s Midland County. The governor of Michigan declared a state of emergency and ordered more than 10,000 residents to evacuate. The floods resulted in the failure of the Edenville Dam the evening of May 19 and the Sanford Dam several hours later, causing additional flooding around the Tittabawassee River region.

A team with NASA’s Earth Science Disasters Program supplied a “flood proxy map” (above) based on satellite observations to the U.S. Air Force and the Swiss Re Group insurance company to aid in their assessments. The map shows the area on May 20 and provides information on flooding and likely areas of additional flooding.

The Disasters Program continues to monitor the situation to determine which additional NASA resources and capabilities may be available to support the risk management of this event.

NASA regularly leverages the power of our views of Earth from space and research aircraft to assist communities around the world as they plan for and recover from severe, often life-threatening, disasters. Data from NASA’s robust constellation of satellites and airborne and ground sensors are used to assess, predict and describe disaster impacts to inform the actions of leaders, first responders, and those providing relief.

The Advanced Rapid Imaging and Analysis team at NASA’s Jet Propulsion Laboratory in Pasadena, California, collaborated on the map, which was generated by the National Central University of Taiwan. The map includes optical satellite data acquired by Planet Labs, a private Earth-imaging company. – Aries Keck

NASA Responds to Puerto Rico Quakes

Starting Dec. 28, 2019, Puerto Rico was shaken by a series of hundreds of small earthquakes that culminated on Jan. 7 with a powerful 6.4 magnitude earthquake. This earthquake caused widespread damage to infrastructure, leaving more than 2,000 people in shelters, nearly 1 million without power, and hundreds of thousands without water.

NASA quickly mobilized to provide its expertise and satellite Earth-observing data in support of the response and recovery for this disaster. A team in the agency’s Earth Science Disasters Program began collecting information and coordinating with stakeholders, university partners, and the federal agencies leading the response effort. Agencies included the Federal Emergency Management Agency, the U.S. Geological Survey, the U.S. Department of Health and Human Services, and the Earthquake Engineering Research Institute.

Damage proxy maps show structures that were likely damaged by the earthquake in red and yellow. The Ponce region of Puerto Rico is shown on Jan. 9 (above). The Guanica region is shown on Jan. 14 (below). Credit: NASA, JPL-Caltech, ESA


Several data products in support of the disaster response are posted in geographic information system (GIS) format on the NASA Disasters Mapping Portal, which allows the data to be more easily analyzed by other agencies and researchers.

The Advanced Rapid Imaging and Analysis team at NASA’s Jet Propulsion Laboratory and California Institute of Technology in Pasadena, California, have used Synthetic Aperture Radar data from several recent European Space Agency-operated Copernicus Sentinel-1 satellite overpasses of the region to identify potential damage to structures and displacement of the surface. Damage proxy maps can be used to identify damaged structures. Displacement maps show shifts in land surface due to the tectonic activity.


Surface displacement maps highlight the change in elevation caused by the Puerto Rico earthquakes between Jan. 2 and 14. This displacement map from Jan. 14 estimates around 6 inches of surface lowering centered on the Guayanilla Bay in the southern region of Puerto Rico. (Gray area is ocean.) Credit: NASA, JPL-Caltech, ESA


Scientists have conducted preliminary mapping of landslides inferred to have occurred during the period of strong ground shaking related to the Jan. 7 earthquake. One hundred twenty landslides were mapped. They are widely dispersed across the affected area, with the highest concentration in the southwestern portion of the island nearest the epicenter. The landslide team is coordinating directly with the USGS Landslide Hazard program to provide relevant information for site analyses and assessments.

Scientists at the University Space Research Association collaborating with NASA have used satellite data to assess power outage maps. These “Black Marble” maps are being provided to FEMA Region II’s Geospatial Resource Center by USRA’s Earth from Space Institute and are being used to inform response efforts on the ground.


The preliminary map of co-landslides caused by the Jan. 7 earthquake shows the location of 120 landslides with the USGS Peak Ground Acceleration Contours that indicate areas of greatest shaking. Credit: Knoper, Clark, Medwedeff, Townsend, Gong (University of Michigan), Zekkos (University of California Berkeley, Kirschbaum (NASA GSFC)


Preliminary assessment of outdoor illumination conditions before and after the Jan. 7 earthquake are shown in this series of maps. The Jan. 8 map tracks the initial outages after the earthquake. The Jan. 9 and 10 maps show some recovery, particularly in densely populated areas of San Juan, Ponce, and Arecibo. Credit: Universities Space Research Association

Mapping Dorian’s Damage to the Bahamas

A damage assessment map derived from satellite data shows conditions on one island in the Bahamas on Sept. 2. Red and yellow areas are likely the most damaged. Credit: NASA-JPL, Caltech, Earth Observatory of Singapore

NASA has created and provided to emergency response organizations a detailed damage assessment map of the Bahamas based on satellite data after Hurricane Dorian hit the islands earlier this week.

For over a week, a response team from NASA’s Earth Science Disasters Program has worked to create maps of impacts and potential impacts from the storm and make them available to decision makers.

The new damage assessment map used satellite data from the European Union’s Sentinel-1 Copernicus instrument to identify areas (shown in red and yellow) that were likely most affected by the storm’s Category 5 winds and storm surge. The map was created by the Advanced Rapid Imaging and Analysis team at NASA’s Jet Propulsion Laboratory in collaboration with the European Space Agency, the California Institute of Technology and the Earth Observatory of Singapore.

The region shown in the map is Marsh Harbour, a town in the Abaco Islands, a group of Bahamian islands and cays that form a 120-mile–long chain. Marsh Harbour is the commercial center of the Abacos.

NASA’s Disasters Program has also been contacted by the Caribbean Disaster Emergency Management Agency for assistance in providing high-resolution flood maps. That agency’s disaster response teams are attempting to reach inundated areas, many of which remain inaccessible. This type of map will give Bahamian officials a better understanding of flood impacts and where the help is most urgently needed. – Jim Schultz

Getting Florida Ready for Hurricane Dorian

Satellite view of Hurricane Dorian on Thursday, Aug. 29. (Credit: NOAA Environmental Visualization Laboratory)

As Hurricane Dorian slowly approaches Florida’s Atlantic coast, NASA personnel have engaged with federal, state and local emergency responders in preparation for landfall as soon as Labor Day.

A team of NASA disaster coordinators from the Earth Science Division’s Disasters Program has been activated to work with emergency agencies to determine what NASA information assets derived from satellite data can be provided to help decision makers direct resources and help communities likely to be affected by the storm.

NASA has already created a map of Florida showing current soil moisture conditions to help scientists and response agencies predict the impact of heavy rainfall from Hurricane Dorian on flooding and runoff across the state. The map uses data from the NASA-NOAA Suomi NPP satellite. This and other data products are made available from the program’s mapping portal.

Program specialists cull and analyze a wide range of data derived from space-borne instruments to produce visualizations and maps of anything from power outages to the extent of flood waters and damage to ecosystems. Such information can be particularly important for remote areas where on-the-ground observations are difficult to obtain.


NASA Helped to Keep Soldiers Safe During Hurricane Florence

Black Marble imagery before the lights went out in Fort Bragg, North Carolina. Credits: NASA
Black Marble imagery after the lights went out in Fort Bragg, North Carolina. Credits: NASA

Soldiers in Fort Bragg found [NASA’s Black Marble product] useful for locating power outages on the army base. “And soldiers could see any information they needed right from their cell phones…

In September, Hurricane Florence barreled toward the U.S. East Coast bringing powerful wind, rain and catastrophic flooding that devastated cities, towns, and military bases. The U.S. Army’s Fort Bragg, just west of Fayetteville, North Carolina, was one of the hardest-hit areas. During the storm, soldiers at Fort Bragg used NASA’s Disasters Mapping Portal to identify hazardous areas and to assess power outages and residential flooding.

“The Disasters GIS [Geographic Information System] portal was a very effective way to display and disseminate information for those living in an area that was facing a major disaster,” said Chief Jason Feser of the Army Geospatial Center.

The NASA Disasters Mapping Portal hosts collective geospatial data from NASA scientists to hand off through GIS-based tools to emergency managers, first responders, and the public before, during, and after a disaster in a specific location. The use of GIS allows the Disasters Program to provide free and publicly available scientific data in a more user-friendly environment, thus bridging the gap between science and application. Emergency managers are also able to bring in NASA data and combine it with their own national, state, or local datasets to gain a better understanding of potential hazards and inform disaster response.

“The Disasters Portal allows everyone to focus on what they do best,” said Jeremy Kirkendall, NASA Disasters Mapping Portal lead. “NASA’s scientists create the products, we host them, and other agencies can easily find them in a ready-to-use format.”

Among the products Fort Bragg personnel used was NASA’s Black Marble product. Using nighttime imagery from NASA’s Suomi satellite, NASA’s Black Marble provides important information for pre-event and post-event mapping and monitoring of power outages. Black Marble has been used to assess disruptions in energy infrastructure and utility services following major disasters. Soldiers in Fort Bragg found it useful for locating power outages on the army base. “And soldiers could see any information they needed right from their cell phones,” Feser said.

The NASA Disasters Program began coordinating efforts prior to September 11, 2018, before Hurricane Florence’s landfall, and continued monitoring the disaster after the storm made landfall on September 14, 2018. Aside from the U.S. Army, the NASA Disasters program engaged with partners and stakeholders such as FEMA, National Guard Bureau, NOAA, U.S. Forest Service, U.S. Geological Survey, and U.S. Department of Interior.

To learn more about the Disasters Program please visit: https://disasters.nasa.gov to learn more about the Disasters Portal please visit: https://maps.disasters.nasa.gov

To view Black Marble imagery from Fort Bragg, North Carolina, in the Disasters GIS Portal please visit: https://maps.disasters.nasa.gov/arcgis/apps/webappviewer/index.html?id=f8bd16575eb7495ca1edb09ea0d31d67

NASA Is Monitoring California Wildfires From Space

November’s California wildfires, including the Woolsey Fire near Los Angeles and the Camp Fire in Northern California, are now one of the most destructive and deadliest in the state’s history. NASA satellites are observing these fires – and the damage they’re leaving behind – from space.

Credits: NASA

The Advanced Rapid Imaging and Analysis (ARIA) team at NASA’s Jet Propulsion Laboratory in Pasadena, California, produced new damage maps using synthetic aperture radar images from the Copernicus Sentinel-1 satellites. The first map shows areas likely damaged by the Woolsey Fire as of Sunday, Nov. 11. These maps are provided to various agencies to aid in disaster response. It covers an area of about 50 miles by 25 miles (80 kilometers by 40 kilometers) – framed by the red polygon. The color variation from yellow to red indicates increasing ground surface change, or damage. This ARIA damage proxy map was provided to agencies like FEMA, the California National Guard, California Department of Forestry and Fire Protection, San Jose Water, California Earthquake Clearinghouse and the California Governor’s Office of Emergency Services to provide an overall damage assessment in the state.

NASA’s Fire Information for Resource Management System (FIRMS) distributes near real-time (NRT) active fire data within 3 hours of a satellite overpass from both the Moderate Resolution Imaging Spectroradiometer (MODIS) and the Visible Infrared Imaging Radiometer Suite (VIIRS). Natural resource managers need to know where a fire is quickly to be able to prepare for and respond to a wildfire event. NASA FIRMS NRT helps to visualize the location of a fire in a timely manner for individuals like Natural Resource Managers or others who are directly impacted by wildfires.

Highlights of How NASA’s Disasters Team Helps Reduce Risk

The International Day of Disaster Reduction 2018 is on October 13, and NASA is marking the occasion by sharing highlights of how we provide data to support disaster reduction and help improve recovery efforts. The NASA Disasters Team, a part of the Applied Sciences Program within NASA’s Earth Science Division, promotes the use of streamed data to prepare for, respond to and recover from natural and technological disasters. The NASA Disasters team targets a spectrum of disasters including floods, earthquakes, volcanoes, landslides, and oil spills, as well as assesses hazards to vulnerable populations and livelihoods.

Here’s a few ways in which the Disasters Team is working to reduce risk:

The Atmospheric Infrared Sounder (AIRS) onboard NASA's Aqua satellite shows Hurricane Michael on October 10, 2018.
The Atmospheric Infrared Sounder (AIRS) onboard NASA’s Aqua satellite shows Hurricane Michael on October 10, 2018. Credit: NASA JPL-Caltech

NASA’s AIRS instrument was used to support disaster risk reduction by providing critical information to Florida emergency managers on the impact of wind direction and speed before Hurricane Michael made landfall.

The Advanced Rapid Imaging and Analysis (ARIA) team created a damage proxy map (close-up right) for Palu, Indonesia. Credit: NASA JPL-Caltech

NASA’s ARIA team created damage proxy maps after the Palu, Indonesia earthquake. These images help governments and responders identify areas that experienced significant damage and allocate resources accordingly to reduce risk.

Radar view of floodwaters in the Carolinas from Hurricane Florence. Credit: NASA
Floodwaters in the Carolinas from Hurricane Florence. Credit: NASA

To support disaster risk reduction NASA developed an airborne radar mission to give agencies like FEMA and the U.S. Forest Service a much-needed view of floodwaters that threatened areas in North Carolina and South Carolina.

Night light show San Juan, Puerto Rico, before Hurricane Maria, 2017. Credit: NASA Goddard
Night lights show San Juan, Puerto Rico, before Hurricane Maria, 2017. Credit: NASA Goddard

NASA used its Black Marble technology to pinpoint where the lights went out after Hurricane Maria devastated Puerto Rico. Knowing where the power is out-and how long the power has been out-allowed first responders to better deploy rescue and repair crews and to distribute life-saving supplies.


NASA Tracking Florence From Every Angle and Wavelength

The VIIRS instrument on the joint NASA/NOAA Suomi NPP satellite observed Hurricane Florence as it developed in the Atlantic Ocean and made landfall in North Carolina on Sept. 14, 2018. Credits: NASA Worldview

NASA has been tracking Florence since it began moving toward the East Coast of the United States and continued to monitor the storm as it inched across the Carolinas and farther inland. The space agency’s Earth Science Disasters Program is sparing no available resource in working to keep disaster responders and agencies such as FEMA and the National Guard informed with the latest information to assist in decisions on everything from evacuations to supply routes and recovery estimates. Products can be found on the NASA Disasters Mapping Portal.

Here’s a snapshot of some of the ways NASA has been monitoring the storm and its repercussions:

LAND, ATMOSPHERE NEAR REAL-TIME CAPABILITY FOR EOS

LANCE imagery of water vapor, precipitation, and wind speed in Hurricane Florence from Sept. 15, 2018, viewed in NASA Worldview. Credits: NASA

NASA’s Land, Atmosphere Near real-time Capability for EOS (Earth Observing System) (LANCE) provides data and imagery from Terra, Aqua, Aura, Suomi NPP, and GCOM-W1 satellites in less than three hours from satellite observation to meet the needs of the near real-time applications community. LANCE leverages existing satellite data processing systems in order to provide such products from select EOS instruments. These data meet the timely needs of applications such as numerical weather and climate prediction, forecasting and monitoring natural hazards, agriculture, air quality, and disaster relief.

ARIA FLOOD EXTENT MAPS

These images, derived from synthetic aperture radar (SAR) images from the Copernicus Sentinel-1 satellites, operated by the European Space Agency, were taken before Florence, on September 02, 2016, and 12 hours after the storm’s landfall at 7:06 PM local time on September 14, 2018. Credits: NASA

The Advanced Rapid Imaging and Analysis (ARIA) team at NASA’s Jet Propulsion Laboratory in Pasadena, California, created a flood extent map from Sentinel-1 synthetic aperture radar data acquired 12 hours after Hurricane Florence made landfall. The map, which was pushed to FEMA’s SFTP server (and is available to download), depicts areas of the Carolinas in light blue pixels that are likely flooded.

Media reports provided anecdotal preliminary validation. This map was cross-validated with ARIA’s earlier flood proxy map. This flood proxy map should be used as guidance to identify areas that are likely flooded, and may be less reliable over urban and vegetated areas.

To overcome that limitation, NASA’s Uninhabited Aerial Vehicle Synthetic Aperture Radar (UAVSAR) instrument aboard NASA’s C-20A aircraft is slated to fly over flooded areas to validate and improve these maps as well as provide near real-time imagery to assist local, state and federal partners.

For example, barrier islands and the immediate coastlines have borne the brunt of the storm surge and wind damage, resulting in the destruction of property along the coastline. UAVSAR imagery will help to clarify areas that have been impacted. Rapid acquisition of UAVSAR imagery revealing damaged homes and infrastructure provides higher spatial resolution details to complement “damage proxy maps” and other change detection approaches applied from routinely collected imagery or special collections from international partners.

VISIBLE INFRARED IMAGING RADIOMETER SUITE

This pre-Florence image in Raleigh and Durham, North Carolina, is based on composite Black Marble images gathered between August 10 and Sep 11, 2018. The image shows areas in high-light condition in red, while areas in low-light condition are in black. The Black Marble Level 3 and HD data are continuously being produced and delivered for the latest day available. Credits: NASA

The Day/Night Band sensor of the Visible Infrared Imaging Radiometer Suite (VIIRS) aboard the Suomi-National Polar-orbiting Partnership and Joint Polar Satellite System satellite platforms (both NOAA partnerships) provide global daily measurements of nocturnal visible and near-infrared light. The VIIRS Black Marble product suite detects light in a range of wavelengths from green to near-infrared, including city lights and lights from other activity.

On September 14, 2018 North Carolina officials said the number of power outages due to Florence was more than half a million. The NASA Black Marble product suite has been used to assess disruptions in energy infrastructure and utility services following major disasters. The night-time imageries are useful for pre-event and post-event mapping and monitoring of power outages in cloud-free conditions.

SATELLITES MAKE WEATHER MONITORING POSSIBLE

NASA relies heavily on its fleet of Earth-orbiting satellites as well as satellites from partner institutions for data that feeds into critical weather and climate models. Below is a summary of a few of those assets:

ATMOSPHERIC INFRARED SOUNDER

This image, taken at 1:35pm EDT on Tuesday, September 11, 2018, by the Atmospheric Infrared Sounder (AIRS) aboard NASA’s Aqua satellite, shows Hurricane Florence, which, at the time, had maximum sustained winds of 140 mph (225 kph). Credits: NASA

Aboard the Aqua satellite, the agency’s Atmospheric Infrared Sounder (AIRS), in conjunction with the Advanced Microwave Sounding Unit (AMSU),  was able to capture three-dimensional images of the storm’s approach by sensing emitted microwave and infrared radiation. Warm colors in the infrared image (red, orange, yellow) show areas with little cloud cover, while cold colors (blue, purple) show areas covered by clouds at high, cold altitudes. The darker the color, the colder and higher the clouds and the stronger the thunderstorms. In partnership with the National Oceanic and Atmospheric Administration, these atmospheric observations are assimilated into operational prediction centers around the world to improve hurricane path prediction and other forecasts.

MODERATE RESOLUTION IMAGING SPECTRORADIOMETER & CLOUDSAT

This natural-color image shows Hurricane Florence as captured by the Moderate Resolution Imaging Spectroradiometer (MODIS) instrument on the Aqua satellite on Sept. 11, 2018. The second image, acquired by the CloudSat satellite on the same day, shows a cross-section of how the storm would look if it had been sliced near the middle and viewed from the side. Credits: NASA

Another powerful instrument aboard the Aqua satellite (the same instrument is also aboard Aqua’s “twin” satellite, Terra) is the Moderate Resolution Imaging Spectroradiometer (MODIS). Aqua and Terra work in tandem to image the entire globe once every one to two days, which allows MODIS to capture a sweeping picture of any number of Earth dynamics, including storms, through its 36 spectral bands, or groups of wavelengths.

Here, a MODIS image of Florence is shown with a cross-section of the storm taken on the same day by NASA’s Cloudsat satellite. The CloudSat pass offers a unique view of Florence’s asymmetrical structure, the intense convection and rainfall churning inside the storm, and a complex vertical cloud structure that is not visible from above. The storm’s clouds reached an altitude of about 15 kilometers (9 miles) at their highest point—fairly high for a tropical cyclone. The darkest blues represent areas where clouds and raindrops reflected the strongest signal back to the satellite radar. These areas had the heaviest precipitation and the largest water droplets. The blue horizontal line across the data is the melting level; ice particles were present above it, raindrops below it.

MULTI-ANGLE IMAGING SPECTRORADIOMETER

NASA’s Multi-angle Imaging SpectroRadiometer (MISR) passed over Hurricane Florence as it approached the eastern coast of the United States on Thursday, Sept. 13, 2018. Credits: NASA

Global multi-angle imagery of the sunlit Earth is the specialty of the Multi-angle Imaging Spectroradiometer (MISR) aboard NASA’s Terra satellite. The  instrument takes seven minutes to capture images from all nine of its cameras to observe the same location. MISR can reveal areas of high cloud cover associated with strong thunderstorms as well as spot powerful outer rain bands, which can sometimes spawn tornadoes.

SOIL MOISTURE ACTIVE PASSIVE

SMAP wind estimates over Hurricane Florence on Sept. 12, 2018 at 10:49 UTC and on Sept. 13, 2018 at 11:25 UTC. Credits: NASA

Managed by the Jet Propulsion Laboratory in Pasadena, California, and in coordination with NASA’s Goddard Space Flight Center in Greenbelt, Maryland, the polar-orbiting Soil Moisture Active Passive (SMAP) satellite plays a key role in forecasting flooding conditions. SMAP measures the amount of water in the top 5 centimeters (2 inches) of soil everywhere on Earth’s surface every 2 to 3 days. This permits changes of soil moisture around the world to be observed over time scales ranging from the life cycles of major storms to repeated measurements of changes over entire seasons. SMAP is also capable of estimating wind speeds over the ocean, as shown in the image above.

INTERNATIONAL SPACE STATION ASSIST

An astronaut’s photograph of Hurricane Florence as seen from the International Space Station on Sept. 12, 2018, as it was then situated about 600 miles from Southeast U.S. coastline. Credits: NASA

Astronauts aboard the International Space Station (ISS) have been snapping images of Florence with handheld digital cameras throughout the storm’s progression. Once the storm has passed and cloud cover lessens, requests to document flooding and changes to the land surface will be sent to the crew as part of ongoing NASA ISS response to the International Disaster Charter activation for Hurricane Florence. Imagery of this type is then georeferenced by the Earth Science and Remote Sensing Unit at NASA’s Johnson Space Center in Houston.

Also aboard the ISS is the Lightning Imaging Sensor (LIS), which detects the distribution and variability of total lightning day and night in order to improve severe weather forecasting and further scientific study on the relationship between lightning, clouds, and precipitation. Over a 12-hour period, LIS observed an average of more than 5 lightning flashes every 90 seconds in the vicinity of Hurricane Florence on September 14, 2018.