Just over a month into its mission, Parker Solar Probe has returned first-light data from each of its four instrument suites. These early observations – while not yet examples of the key science observations Parker Solar Probe will take closer to the Sun – show that each of the instruments is working well. The instruments work in tandem to measure the Sun’s electric and magnetic fields, particles from the Sun and the solar wind, and capture images of the environment around the spacecraft.
“All instruments returned data that not only serves for calibration, but also captures glimpses of what we expect them to measure near the Sun to solve the mysteries of the solar atmosphere, the corona,” said Nour Raouafi, Parker Solar Probe project scientist at the Johns Hopkins University Applied Physics Lab in Laurel, Maryland.
The mission’s first close approach to the Sun will be in November 2018, but even now, the instruments are able to gather measurements of what’s happening in the solar wind closer to Earth. Let’s take a look at what they’ve seen so far.
WISPR (Wide-field Imager for Solar Probe)
As the only imager on Parker Solar Probe, WISPR will provide the clearest-yet glimpse of the solar wind from within the Sun’s corona. Comprising two telescopes, WISPR sits behind the heat shield between two antennae from the FIELDS instrument suite. The telescopes were covered by a protective door during launch to keep them safe.
WISPR was turned on in early September 2018 and took closed-door test images for calibration. On Sept. 9, WISPR’s door was opened, allowing the instrument to take the first images during its journey to the Sun.

Download these images in HD formats from NASA’s Scientific Visualization Studio.
Russ Howard, WISPR principal investigator from the Naval Research Laboratory, studied the images to determine the instrument was pointing as expected, using celestial landmarks as a guide.
“There is a very distinctive cluster of stars on the overlap of the two images. The brightest is the star Antares-alpha, which is in the constellation Scorpius and is about 90 degrees from the Sun,” said Howard.
The Sun, not visible in the image, is far off to the right of the image’s right edge. The planet Jupiter is visible in the image captured by WISPR’s inner telescope — it’s the bright object slightly right of center in the right-hand panel of the image.
“The left side of the photo shows a beautiful image of the Milky Way, looking at the galactic center,” said Howard.
The exposure time – i.e. the length of time that light was gathered for this image, an interval which can be shortened or lengthened to make the image darker or brighter – is on the lower end, and there’s a reason: “We intentionally wanted to be on the low side in case there was something very bright when we first turned on, but it is primarily because we are looking so far from the Sun,” explains Howard.
As the spacecraft approaches the Sun, its orientation will change, and so will WISPR’s images. With each solar orbit, WISPR will capture images of the structures flowing out from the corona. While measurements have been made before by other instruments at a distance of 1 AU – or approximately 93 million miles – WISPR will get much closer, about 95% of the way to the Sun from Earth, dramatically increasing the ability to see what’s occurring in that region with a much finer scale than ever before and providing a more pristine picture of the solar corona.
ISʘIS (Integrated Science Investigation of the Sun)

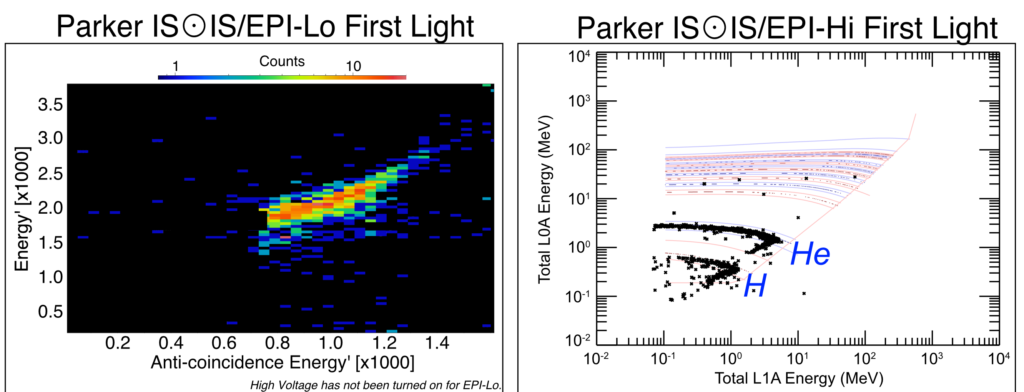
ISʘIS (pronounced “ee-sis” and including the symbol for the Sun in its acronym) measures high-energy particles associated solar activity like flares and coronal mass ejections. (The mission’s other particle instrument suite, SWEAP, focuses on low-energy particles that make up the solar wind.) ISʘIS’ two Energetic Particle Instruments cover a range of energies for these activity-driven particles: EPI-Lo focuses on the lower end of the energy spectrum, while EPI-Hi measures the more energetic particles. Both instruments have gathered data under low voltage, making sure their detectors work as expected. As Parker Solar Probe approaches the Sun, they will be fully powered on to measure particles within the Sun’s corona.
EPI-Lo’s initial data, on the left, shows background cosmic rays, particles that were energized and came rocketing into our solar system from elsewhere in the galaxy. As EPI-Lo’s high voltage is turned on and Parker Solar Probe gets closer to the Sun, the particles measured will shift toward solar energetic particles, which are accelerated in bursts and come streaming out from the Sun and corona.
On the right, data from EPI-Hi shows detections of both hydrogen and helium particles from its lower-energy telescopes. Nearer to the Sun, scientists expect to see many more of these particles — along with heavier elements — as well as some particles with much higher energies, especially during solar energetic particle events.
“The ISʘIS team is delighted with instrument turn-on so far,” said David McComas, Professor of Astrophysical Sciences at Princeton University and principal investigator of the ISʘIS instrument suite. “There are a few more steps to go, but so far everything looks great!”
FIELDS
The FIELDS instrument suite aboard Parker Solar Probe captures the scale and shape of electric and magnetic fields in the Sun’s atmosphere. These are key measurements to understanding why the Sun’s corona is hundreds of times hotter than its surface below.

FIELDS’ sensors include four two-meter electric field antennas — mounted at the front of the spacecraft, extending beyond the heat shield and exposed to the full brunt of the solar environment — as well as three magnetometers and a fifth, shorter electric field antenna mounted on a boom that extends from the back of the spacecraft.
The data above, gathered during the boom deployment shortly after the spacecraft’s launch in August, shows how the magnetic field changes as the boom swung away from Parker Solar Probe. The early data is the magnetic field of the spacecraft itself, and the instruments measured a sharp drop in the magnetic field as the boom extended away from the spacecraft. Post-deployment, the instruments are measuring the magnetic field in the solar wind — illustrating the very reason such sensors need to be held out far from the spacecraft.

In early September, the four electric field antennas on the front of the spacecraft were successfully deployed — and almost immediately observed the signatures of a solar flare.
“During its commissioning time, FIELDS measured its first radio burst from a solar flare,” said principal investigator Stuart Bale, of the Space Sciences Laboratory at the University of California, Berkeley. Such bursts of radio waves can be detected during solar flares — enormous eruptions of energy and light — and are associated with the energetic electrons that flares release. This radio burst was captured by the FIELDS electric field antennas, shown above with measurements from NASA’s Wind spacecraft (on the top) for comparison.
“FIELDS is one of the most comprehensive fields and waves suites ever flown in space, and it is performing beautifully,” said Bale.
SWEAP (Solar Wind Electrons Alphas and Protons)

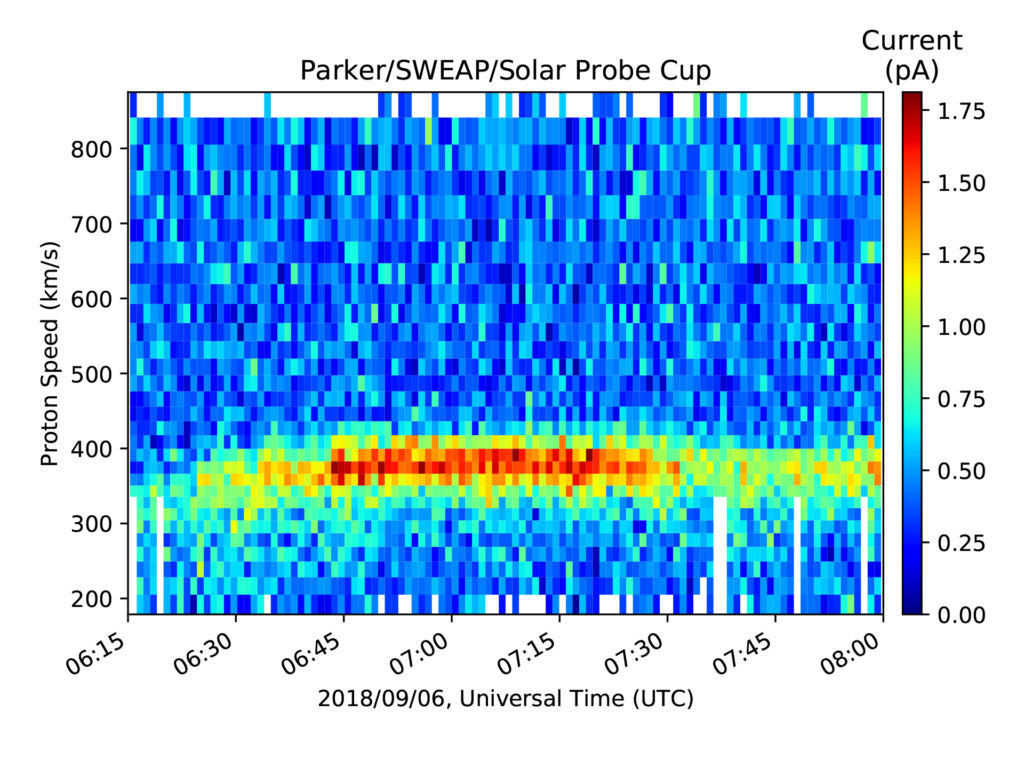
The SWEAP suite includes three instruments: Two Solar Probe Analyzers measure electrons and ions in the solar wind, while the Solar Probe Cup sticks out from behind Parker Solar Probe’s heat shield to measure the solar wind directly as it streams off the Sun. After opening covers, turning on high voltages and running internal diagnostics, all three instruments caught glimpses of the solar wind itself.
Because of Parker Solar Probe’s position and orientation, the science team expected that Solar Probe Cup would mostly measure background noise at first, without picking up the solar wind. But just after the instrument was powered on, a sudden, intense gust of solar wind blew into the cup, visible in the data as the red streak. As the spacecraft approaches the Sun, such observations will be Solar Probe Cup’s bread and butter — and will hopefully reveal new information about the processes that heat and accelerate the solar wind.

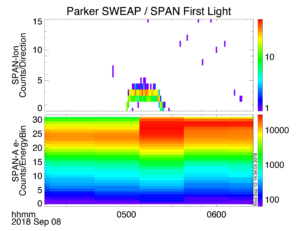
The two Solar Probe Analyzers (SPAN) also caught early peeks of the solar wind. During commissioning, the team turned the spacecraft so that SPAN-A — one of the two SPAN instruments — was exposed to the solar wind directly. It captured about 20 minutes’ worth of data (right), including measurements of solar wind ions (top) and electrons (bottom). While SPAN-A and its sister instrument, SPAN-B, will measure solar wind electrons throughout the mission, the spacecraft’s orientation now means that SPAN-A will likely go several more years before it captures such ion measurements again. This is because solar wind electrons can be measured from any direction, as their low mass and high temperature make their motion much more random, while the much heavier solar wind ions follow a relatively direct path out from the Sun.
“SWEAP’s solar wind and corona plasma instrument performance has been very promising,” said Justin Kasper, principal investigator of the SWEAP instrument suite at University of Michigan. “Our preliminary results just after turn-on suggest we have a set of highly sensitive instruments that will allow us to do amazing science close to the Sun.”
Download these images in HD formats from NASA’s Scientific Visualization Studio.
By Sarah Frazier (NASA) & Justyna Surowiec (APL)
NASA’s Goddard Space Flight Center, Greenbelt, Md.
Johns Hopkins University Applied Physics Lab, Laurel, Md.
