NASA Aids Response to Widespread Flooding in Japan

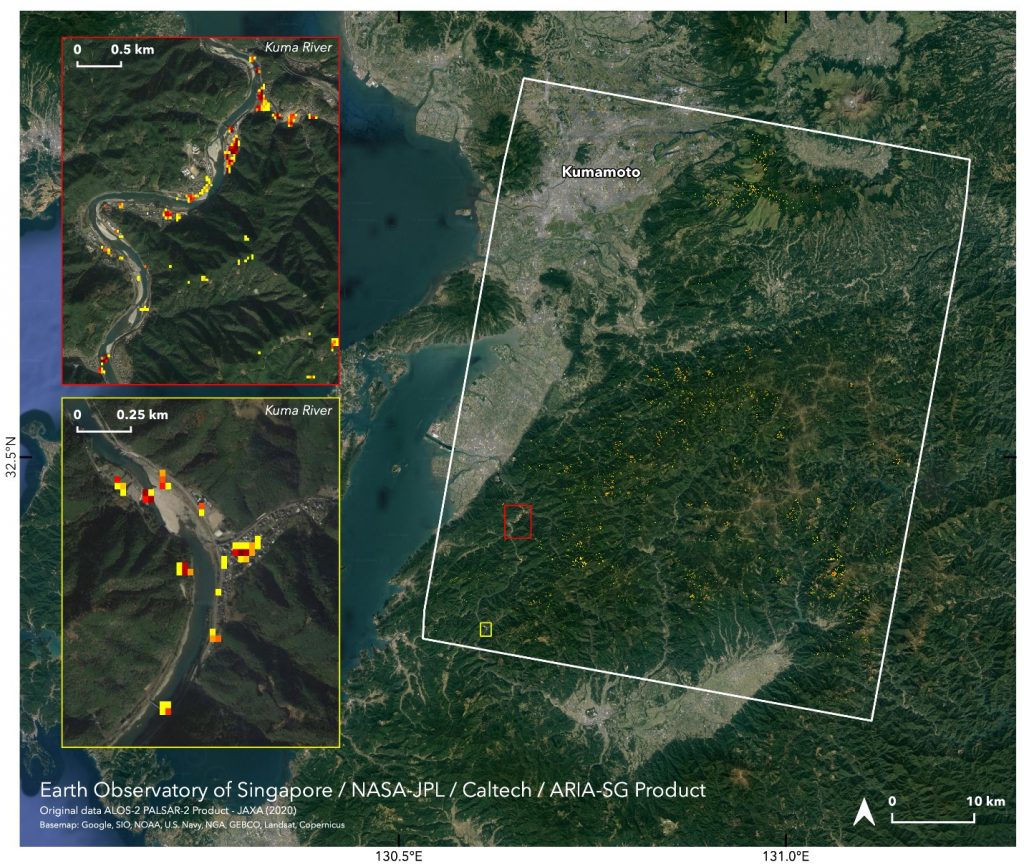
Map showing areas which are likely damaged in Kumamoto Prefecture, Japan, as of July 6 due to heavy rains. Credits: Earth Observatory of Singapore/NASA-JPL/Caltech/ARIA-SG team

A team working with NASA’s Earth Science Disasters Program has used satellite data to identify hard-hit areas in southern Japan, where days of pounding rain triggered massive floods and mudslides in early July. The map (above, left) shows areas of likely damaged in Kumamoto Prefecture, where rivers burst their banks and swept away homes, bridges, cars, and trees. Color pixels of 30 meters, from yellow to red, indicate increasing ground surface change before and after the event.

The Disasters Program regularly harnesses NASA’s expertise in Earth and space science to help communities around the world plan for and recover from severe disasters. The program is currently working with stakeholders from Sentinel Asia and the Asian Disaster Reduction Center through the International Disasters Charter to quantify flood depth, flood extent, and to identify areas damaged by the flooding.

The Advanced Rapid Imaging and Analysis (ARIA) team at NASA’s Jet Propulsion Lab in Pasadena, California, collaborated with the Earth Observatory of Singapore on the map using synthetic aperture radar data acquired by the Japan Aerospace Exploration Agency’s ALOS-2 satellites.


NASA Aids in Mapping Michigan Floods

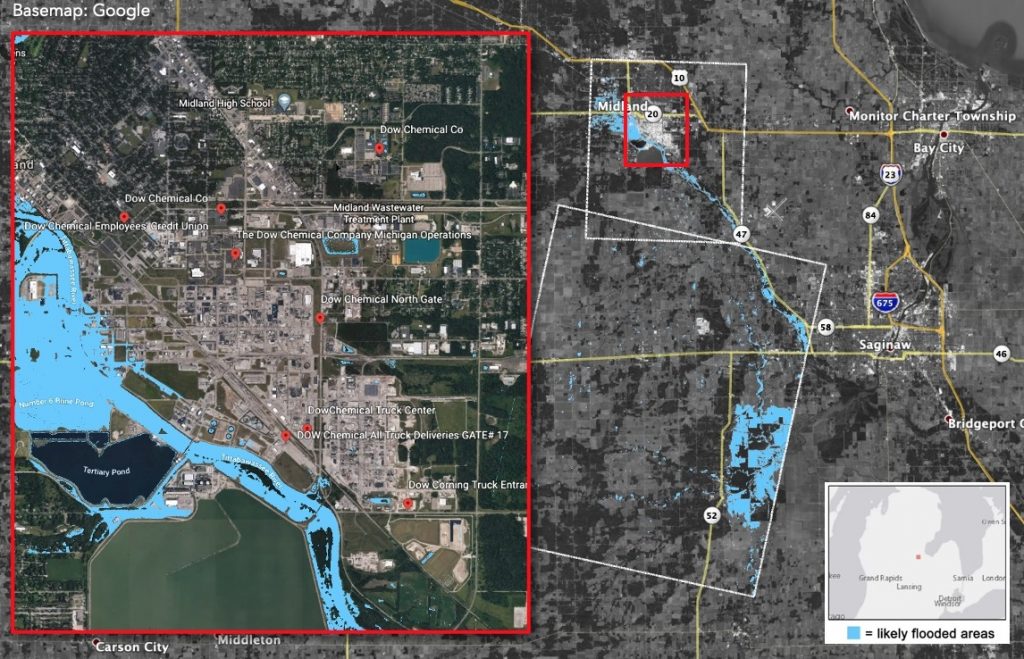
A preliminary Flood Proxy Map shows in light blue areas that are likely flooded as of May 20 in Midland City, Michigan. Credits: NASA/ARIA-JPL/NCU/Planet Labs

Heavy rainfall starting on May 17 caused significant flooding in Michigan’s Midland County. The governor of Michigan declared a state of emergency and ordered more than 10,000 residents to evacuate. The floods resulted in the failure of the Edenville Dam the evening of May 19 and the Sanford Dam several hours later, causing additional flooding around the Tittabawassee River region.

A team with NASA’s Earth Science Disasters Program supplied a “flood proxy map” (above) based on satellite observations to the U.S. Air Force and the Swiss Re Group insurance company to aid in their assessments. The map shows the area on May 20 and provides information on flooding and likely areas of additional flooding.

The Disasters Program continues to monitor the situation to determine which additional NASA resources and capabilities may be available to support the risk management of this event.

NASA regularly leverages the power of our views of Earth from space and research aircraft to assist communities around the world as they plan for and recover from severe, often life-threatening, disasters. Data from NASA’s robust constellation of satellites and airborne and ground sensors are used to assess, predict and describe disaster impacts to inform the actions of leaders, first responders, and those providing relief.

The Advanced Rapid Imaging and Analysis team at NASA’s Jet Propulsion Laboratory in Pasadena, California, collaborated on the map, which was generated by the National Central University of Taiwan. The map includes optical satellite data acquired by Planet Labs, a private Earth-imaging company. – Aries Keck

NASA Responds to Puerto Rico Quakes

Starting Dec. 28, 2019, Puerto Rico was shaken by a series of hundreds of small earthquakes that culminated on Jan. 7 with a powerful 6.4 magnitude earthquake. This earthquake caused widespread damage to infrastructure, leaving more than 2,000 people in shelters, nearly 1 million without power, and hundreds of thousands without water.

NASA quickly mobilized to provide its expertise and satellite Earth-observing data in support of the response and recovery for this disaster. A team in the agency’s Earth Science Disasters Program began collecting information and coordinating with stakeholders, university partners, and the federal agencies leading the response effort. Agencies included the Federal Emergency Management Agency, the U.S. Geological Survey, the U.S. Department of Health and Human Services, and the Earthquake Engineering Research Institute.
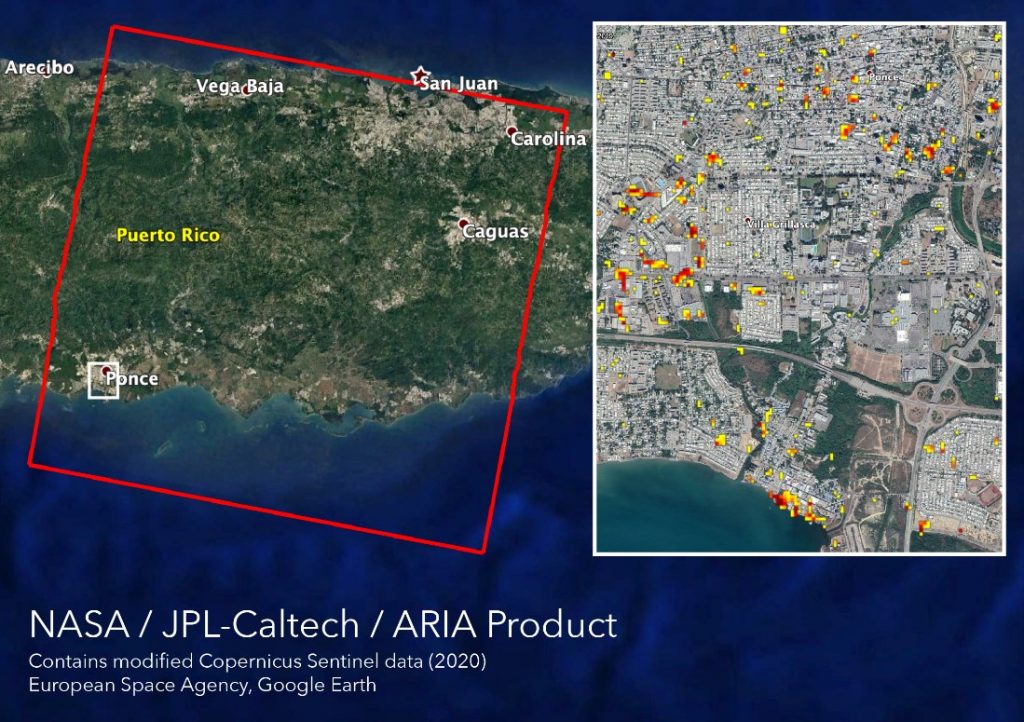
Damage proxy maps show structures that were likely damaged by the earthquake in red and yellow. The Ponce region of Puerto Rico is shown on Jan. 9 (above). The Guanica region is shown on Jan. 14 (below). Credit: NASA, JPL-Caltech, ESA
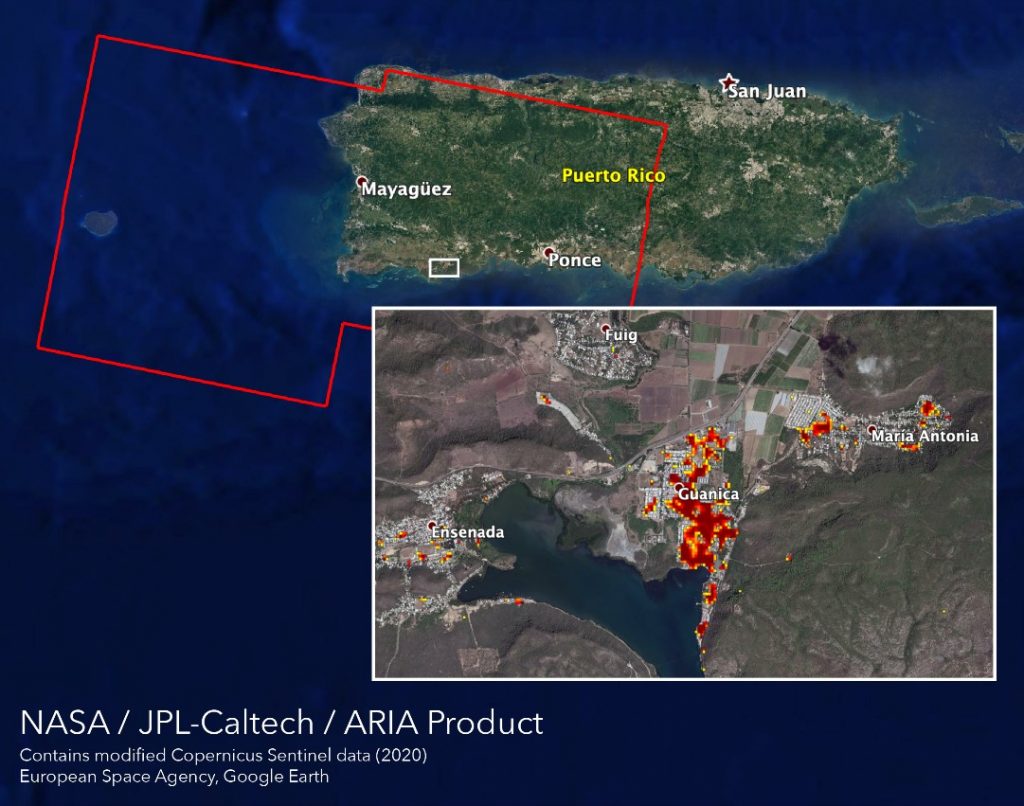
 

Several data products in support of the disaster response are posted in geographic information system (GIS) format on the NASA Disasters Mapping Portal, which allows the data to be more easily analyzed by other agencies and researchers.

The Advanced Rapid Imaging and Analysis team at NASA’s Jet Propulsion Laboratory and California Institute of Technology in Pasadena, California, have used Synthetic Aperture Radar data from several recent European Space Agency-operated Copernicus Sentinel-1 satellite overpasses of the region to identify potential damage to structures and displacement of the surface. Damage proxy maps can be used to identify damaged structures. Displacement maps show shifts in land surface due to the tectonic activity.
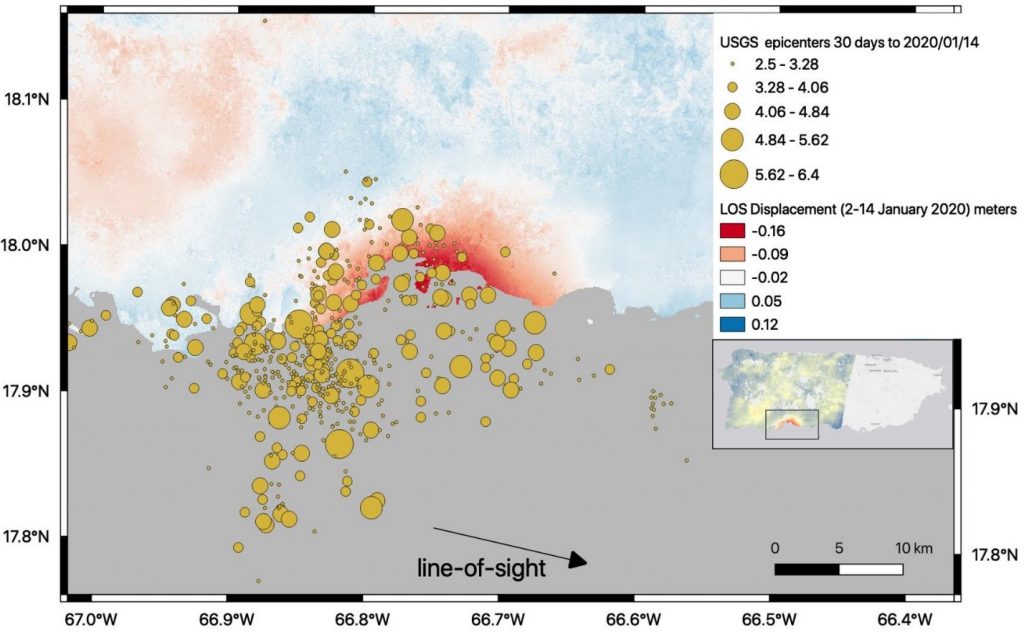
 

Surface displacement maps highlight the change in elevation caused by the Puerto Rico earthquakes between Jan. 2 and 14. This displacement map from Jan. 14 estimates around 6 inches of surface lowering centered on the Guayanilla Bay in the southern region of Puerto Rico. (Gray area is ocean.) Credit: NASA, JPL-Caltech, ESA


Scientists have conducted preliminary mapping of landslides inferred to have occurred during the period of strong ground shaking related to the Jan. 7 earthquake. One hundred twenty landslides were mapped. They are widely dispersed across the affected area, with the highest concentration in the southwestern portion of the island nearest the epicenter. The landslide team is coordinating directly with the USGS Landslide Hazard program to provide relevant information for site analyses and assessments.

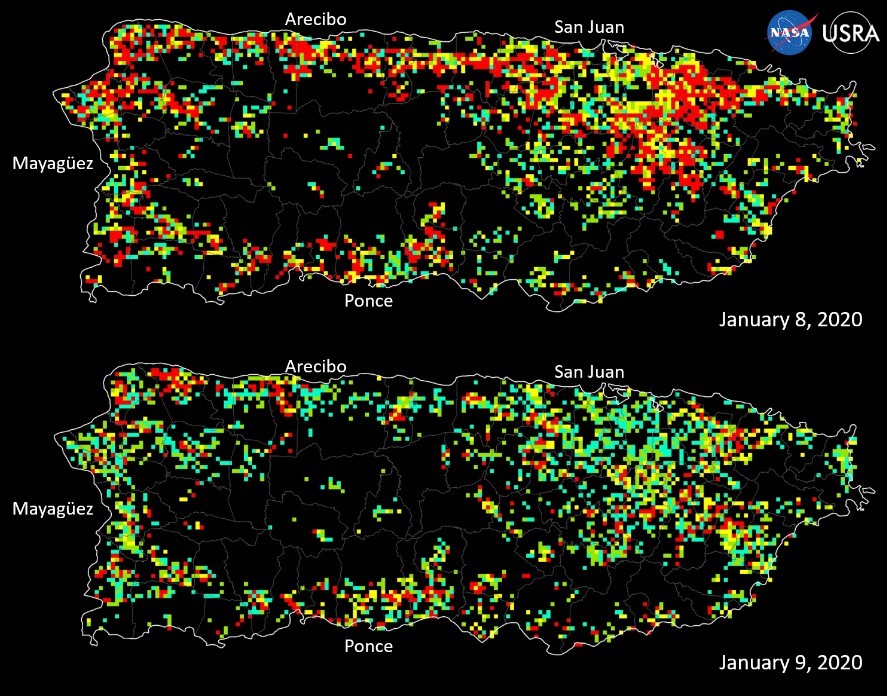
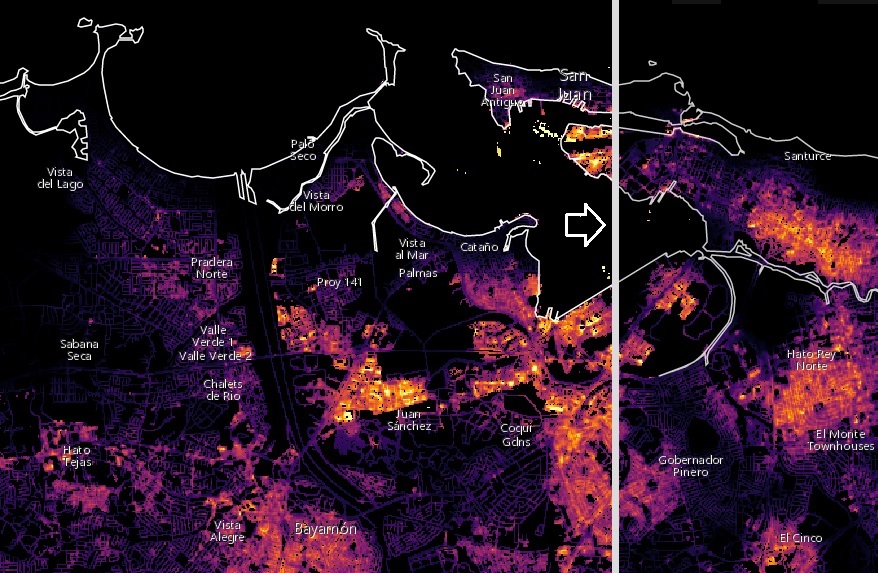
Scientists at the University Space Research Association collaborating with NASA have used satellite data to assess power outage maps. These “Black Marble” maps are being provided to FEMA Region II’s Geospatial Resource Center by USRA’s Earth from Space Institute and are being used to inform response efforts on the ground.
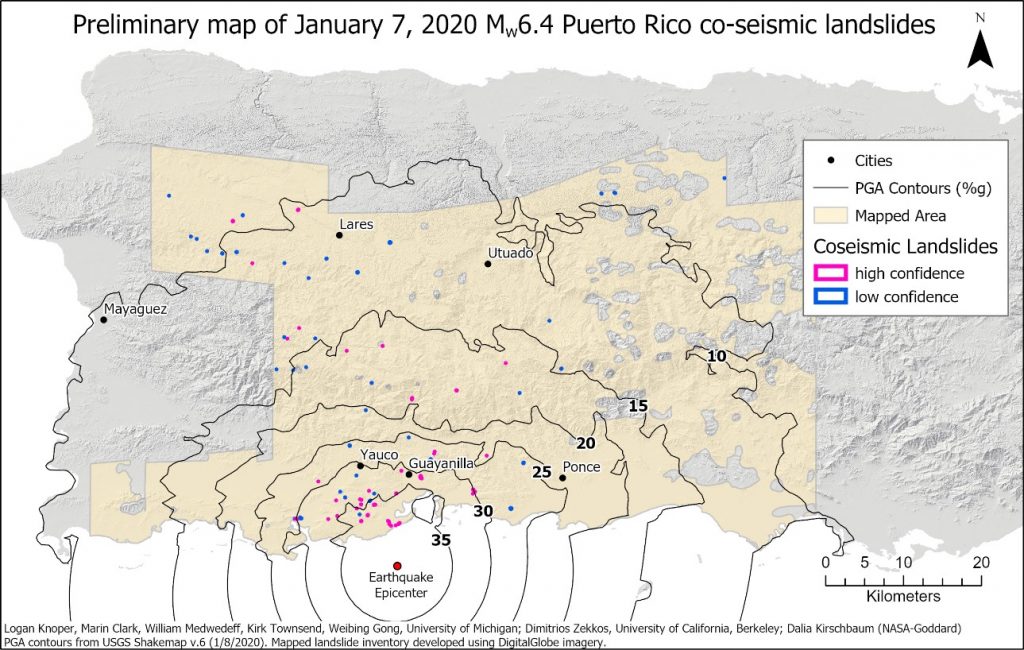
 

The preliminary map of co-landslides caused by the Jan. 7 earthquake shows the location of 120 landslides with the USGS Peak Ground Acceleration Contours that indicate areas of greatest shaking. Credit: Knoper, Clark, Medwedeff, Townsend, Gong (University of Michigan), Zekkos (University of California Berkeley, Kirschbaum (NASA GSFC)
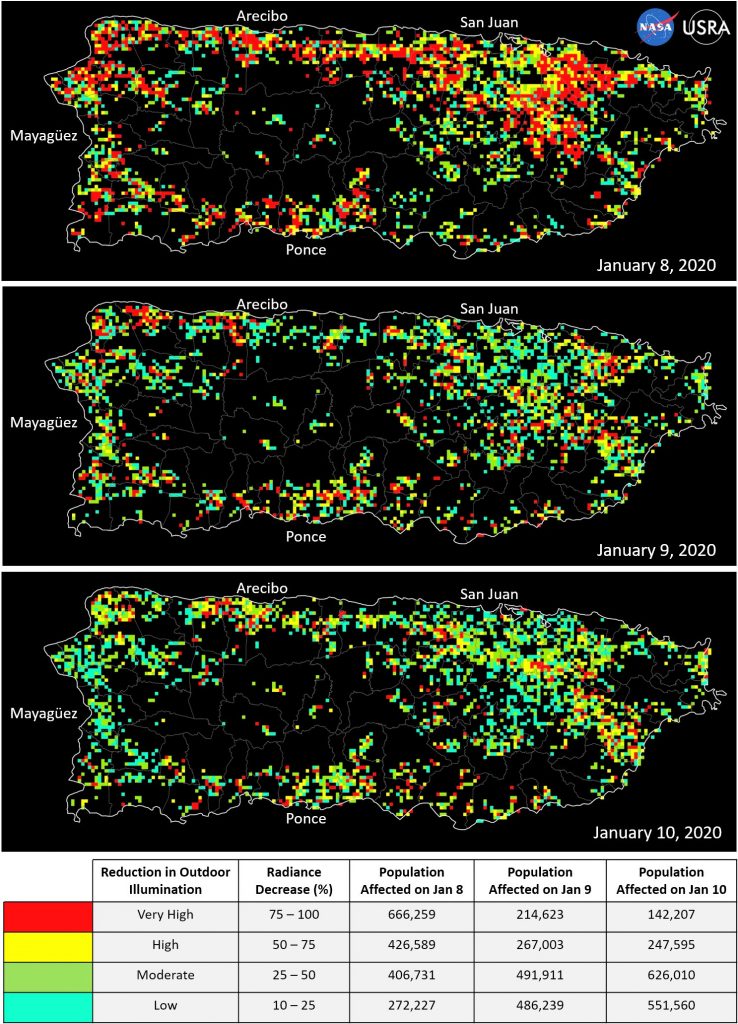
 

Preliminary assessment of outdoor illumination conditions before and after the Jan. 7 earthquake are shown in this series of maps. The Jan. 8 map tracks the initial outages after the earthquake. The Jan. 9 and 10 maps show some recovery, particularly in densely populated areas of San Juan, Ponce, and Arecibo. Credit: Universities Space Research Association
Mapping Dorian’s Damage to the Bahamas

A damage assessment map derived from satellite data shows conditions on one island in the Bahamas on Sept. 2. Red and yellow areas are likely the most damaged. Credit: NASA-JPL, Caltech, Earth Observatory of Singapore

NASA has created and provided to emergency response organizations a detailed damage assessment map of the Bahamas based on satellite data after Hurricane Dorian hit the islands earlier this week.

For over a week, a response team from NASA’s Earth Science Disasters Program has worked to create maps of impacts and potential impacts from the storm and make them available to decision makers.

The new damage assessment map used satellite data from the European Union’s Sentinel-1 Copernicus instrument to identify areas (shown in red and yellow) that were likely most affected by the storm’s Category 5 winds and storm surge. The map was created by the Advanced Rapid Imaging and Analysis team at NASA’s Jet Propulsion Laboratory in collaboration with the European Space Agency, the California Institute of Technology and the Earth Observatory of Singapore.

The region shown in the map is Marsh Harbour, a town in the Abaco Islands, a group of Bahamian islands and cays that form a 120-mile–long chain. Marsh Harbour is the commercial center of the Abacos.

NASA’s Disasters Program has also been contacted by the Caribbean Disaster Emergency Management Agency for assistance in providing high-resolution flood maps. That agency’s disaster response teams are attempting to reach inundated areas, many of which remain inaccessible. This type of map will give Bahamian officials a better understanding of flood impacts and where the help is most urgently needed. – Jim Schultz

Getting Florida Ready for Hurricane Dorian

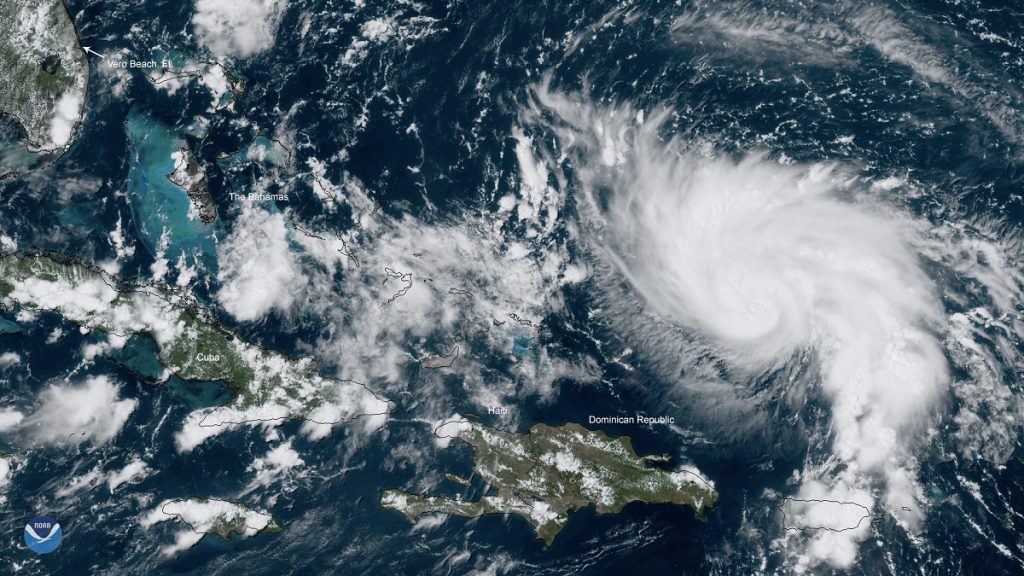
Satellite view of Hurricane Dorian on Thursday, Aug. 29. (Credit: NOAA Environmental Visualization Laboratory)

As Hurricane Dorian slowly approaches Florida’s Atlantic coast, NASA personnel have engaged with federal, state and local emergency responders in preparation for landfall as soon as Labor Day.

A team of NASA disaster coordinators from the Earth Science Division’s Disasters Program has been activated to work with emergency agencies to determine what NASA information assets derived from satellite data can be provided to help decision makers direct resources and help communities likely to be affected by the storm.

NASA has already created a map of Florida showing current soil moisture conditions to help scientists and response agencies predict the impact of heavy rainfall from Hurricane Dorian on flooding and runoff across the state. The map uses data from the NASA-NOAA Suomi NPP satellite. This and other data products are made available from the program’s mapping portal.

Program specialists cull and analyze a wide range of data derived from space-borne instruments to produce visualizations and maps of anything from power outages to the extent of flood waters and damage to ecosystems. Such information can be particularly important for remote areas where on-the-ground observations are difficult to obtain.


Hurricane Season 2019: NASA Ready to Help

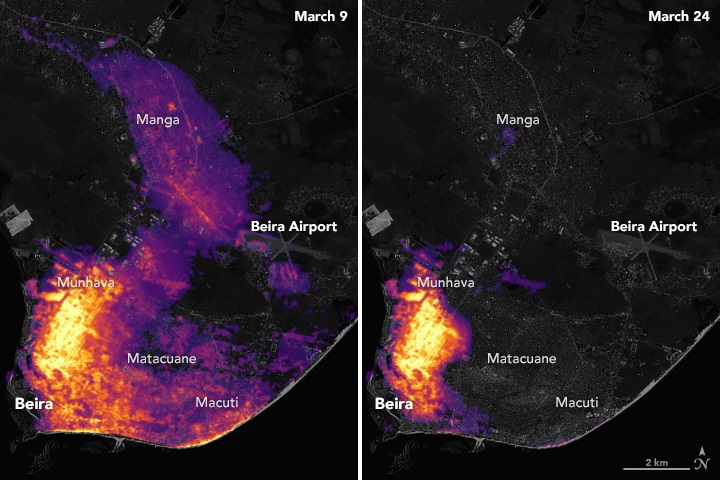
When Cyclone Idai made landfall in Mozambique on March 15, it had a major impact on the energy grid. This NASA visualization created with data from satellite observations shows nighttime lights before (left) and after landfall, revealing disruptions in energy infrastructure and utility services. Credit: NASA

On June 1, the 2019 Atlantic hurricane season begins. But worldwide there really is no off-season for these tropical storms; they affect the globe in one way or another year-round.

At NASA, we leverage the power of our views of Earth from space and research aircraft to assist communities around the world as they plan for — and recover from — these severe, often life-threatening, events. Data from NASA’s robust constellation of orbiting satellites and airborne and ground sensors are used to assess, predict and describe disaster impacts to inform the actions of leaders, first responders, and those providing relief.

For example, NASA data visualizations map storm-induced power outages and help responders monitor progress in power restoration. We’re able to supply near-real-time scans of inland surge and flood waters, allowing decision makers to deploy help to those who need it the most. We can also chart widespread damage to vegetation and help monitor ecosystem recovery. This type of information can be crucial, especially for remote areas where in-person observations are difficult.

This year, NASA has already aided in the response to cyclones Idai and Kenneth that hit Mozambique in March and April, respectively. Combined, the storms led to the deaths of more than 1,000 people and the displacement of nearly 180,000. To assist in recovery, we reached out to officials and responders to identify the kinds of information NASA could contribute. We then put together data packages specific to the needs of local officials and national decision makers.

In 2018 we used NASA data to help responders assess the threat of landslides as Hurricane Willa struck Mexico’s southwestern coast in October. Before and after Super Typhoon Yutu made landfall in the Northern Mariana Islands in October, we were able to craft pre- and post-event maps that helped officials analyze the damage across a wide stretch of the island chain.

Communities affected by disasters rely on the efforts of humanitarian aid and relief organizations, food and water system groups, weather and climate centers, and telecommunications and re-insurance partners. Because of the information NASA provides to decision makers, those most stricken can be reached and helped more quickly, lessening impacts and speeding the recovery process.

Our goal is to use NASA expertise to anticipate risk and help alleviate projected impacts. In so doing, we will play our part in helping communities improve readiness and sustain resilience.

David Green, Disasters Program Manager, NASA Earth Science Division

Puerto Rico Power Outages Tracked by Satellite

Using satellite data of Puerto Rico showing nighttime lights before Hurricane Maria and after, NASA scientists produced maps that show areas where electric power has been lost or reduced. A portion of San Juan is shown here. Credit: NASA

After Hurricane Maria tore across Puerto Rico, it quickly became clear that the destruction would pose daunting challenges for first responders. Most of the electric power grid and telecommunications network was knocked offline. In circumstances like this, quickly knowing where the power is out—and how long it has been out—allows first responders to better deploy rescue and repair crews and to distribute life-saving supplies.

Teams of scientists at NASA are working long days to make sure that groups like the National Guard and the Federal Emergency Management Agency (FEMA) get high-quality satellite maps of power outages in Puerto Rico.

These before-and-after images of Puerto Rico’s nighttime lights are based on data from the NASA-NOAA Suomi NPP satellite. The data detect light in a range of wavelengths from green to near-infrared, including reflected moonlight, light from fires and oil wells, lightning, and emissions from cities or other human activity.

The maps were provided to first responders in Puerto Rico by the NASA Disasters Program, part of the Earth Science Division. Dedicated teams of Earth-observation disaster specialists at NASA centers mobilize to assist in preparations for, responses to, and recovery from a wide range of natural and human-made hazards.

Click here for more information on these maps and to use an online tool to compare recent images of Puerto Rico at night with a baseline view acquired before Hurricane Maria. Click here to download high-resolution before-and-after images of the San Juan area.


Satellite Data of Puerto Rico Identifies Possible Damage Areas

NASA used satellite data to create this “damage proxy map” of locations in the San Juan, Puerto Rico, area that are likely damaged as a result of Hurricane Maria (red and yellow pixels). Credit: NASA

NASA’s Disasters Program has delivered to the Federal Emergency Management Agency (FEMA) a map of areas in eastern Puerto Rico that have likely been damaged as the result of the landfall of Hurricane Maria on Sept. 20.

The “damage proxy map” was created by the Advanced Rapid Imaging and Analysis team at NASA’s Jet Propulsion Laboratory in Pasadena, California, and Caltech, The map is derived from synthetic aperture radar images from the Copernicus Sentinel-1A and Sentinel-1B satellites, operated by the European Space Agency. The images were taken before and after the storm’s landfall. The map was delivered to responding agencies, including FEMA, which combined the map with building infrastructure data to estimate a damage density map. This information was sent to FEMA’s Urban Search and Rescue teams in the field in Puerto Rico.

The full map covers an area of 105 by 60 miles, with an inset showing the extent of damage in and around the capital city of San Juan. Each pixel in this image measures about 98 feet across. The color variation from yellow to red indicates increasingly more significant ground surface change. This damage proxy map can be used as guidance to identify damaged areas.

The NASA Disasters Program, part of the Earth Science Division in the Science Mission Directorate, works with international, regional, and local disaster management agencies to provide critical information using global environmental data from NASA’s fleet of Earth science satellites and other airborne and space-based assets. Dedicated teams of Earth-observation disaster specialists at NASA centers mobilize to assist in preparations for, responses to, and recovery from a wide range of natural and human-made hazards.

Click here for more information and to download the high-resolution image.


Damage Maps May Aid Mexico Quake Response

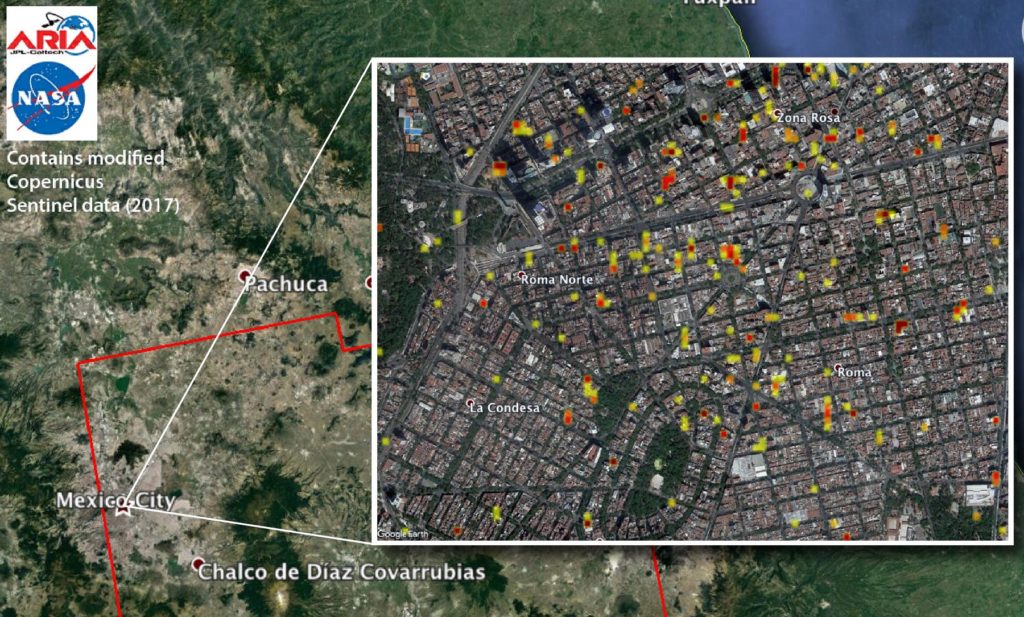
A NASA-produced map of areas likely damaged by the Sept. 19 magnitude 7.1 Raboso earthquake near Mexico City has been provided to Mexican authorities to help responders and groups supporting the response efforts. The quake, which struck 75 miles southeast of Mexico City, caused significant loss of life and property damage.

To assist in the disaster response efforts, scientists at NASA’s Jet Propulsion Laboratory and Caltech, both in Pasadena, California, obtained and used before-and-after interferometric synthetic aperture radar (InSAR) satellite imagery of areas of Central Mexico, including Mexico City, affected by the quake, to identify areas of damage and produce what is known as a Damage Proxy Map. The imagery — acquired before the quake on Sept. 8, and again on Sept. 20, 2017, just six-and-a-half hours after the earthquake — is from the radar instrument on the Copernicus Sentinel-1A and Sentinel 1-B satellites operated by the European Space Agency.

The NASA Disasters Program, part of the Earth Science Division in the Science Mission Directorate, works with international, regional, and local disaster management agencies to provide critical information using global environmental data from NASA’s fleet of Earth science satellites and other airborne and space-based assets. Dedicated teams of Earth-observation disaster specialists at NASA centers mobilize to assist in preparations for, responses to, and recovery from a wide range of natural and human-made hazards.

Click here for more information and download of this map.


A Very Tough Month for Natural Disasters

When major disasters strike, NASA mobilizes to aid disaster response and recovery efforts by bringing the power of space – data from science satellites circling the globe or from the International Space Station – to responders on the ground.

Tapping the terabytes of global environmental data streaming down every day from NASA’s fleet of Earth-orbiting satellites and other airborne and space-based assets, the NASA Earth Science Disasters Program works with international, regional, and local natural disaster response agencies and other Earth-observing space agencies around the world to quickly deliver critical information.

The program has been particularly active over the past month since Hurricane Harvey formed in late August, followed by Hurricanes Irma and Maria and two major earthquakes in Mexico. NASA provided an array of information products in support of disaster responses to each of these events.

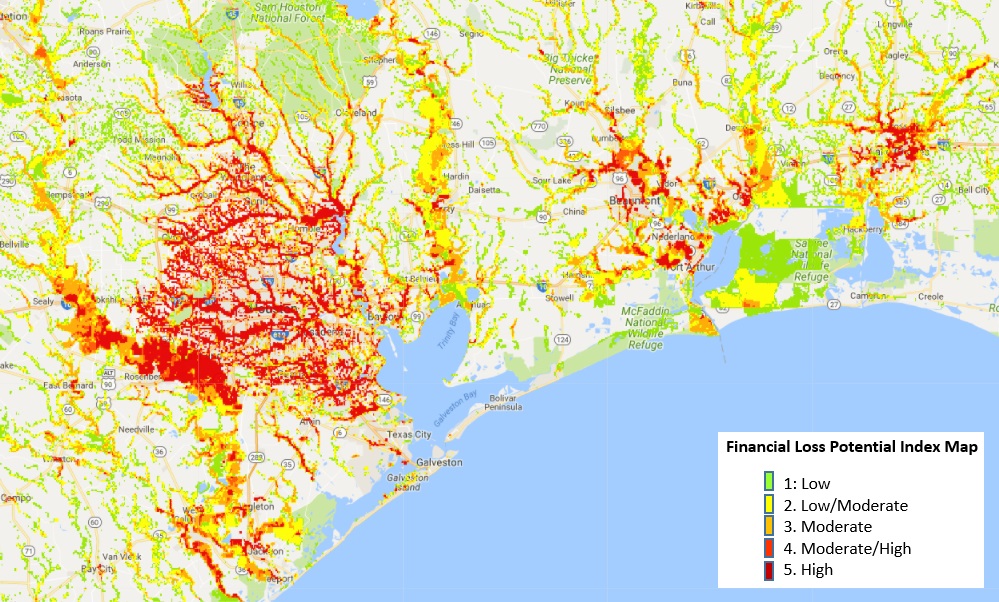
In the aftermath of Hurricane Harvey, NASA produced a map (below) of “financial loss potential” in Texas and Louisiana by combining data on the extent of flooding with property values in affected areas.

The program created a collection of georeferenced digital camera images taken by astronauts on the International Space Station in mid-September that detail the flooding in Florida caused by Hurricane Irma.

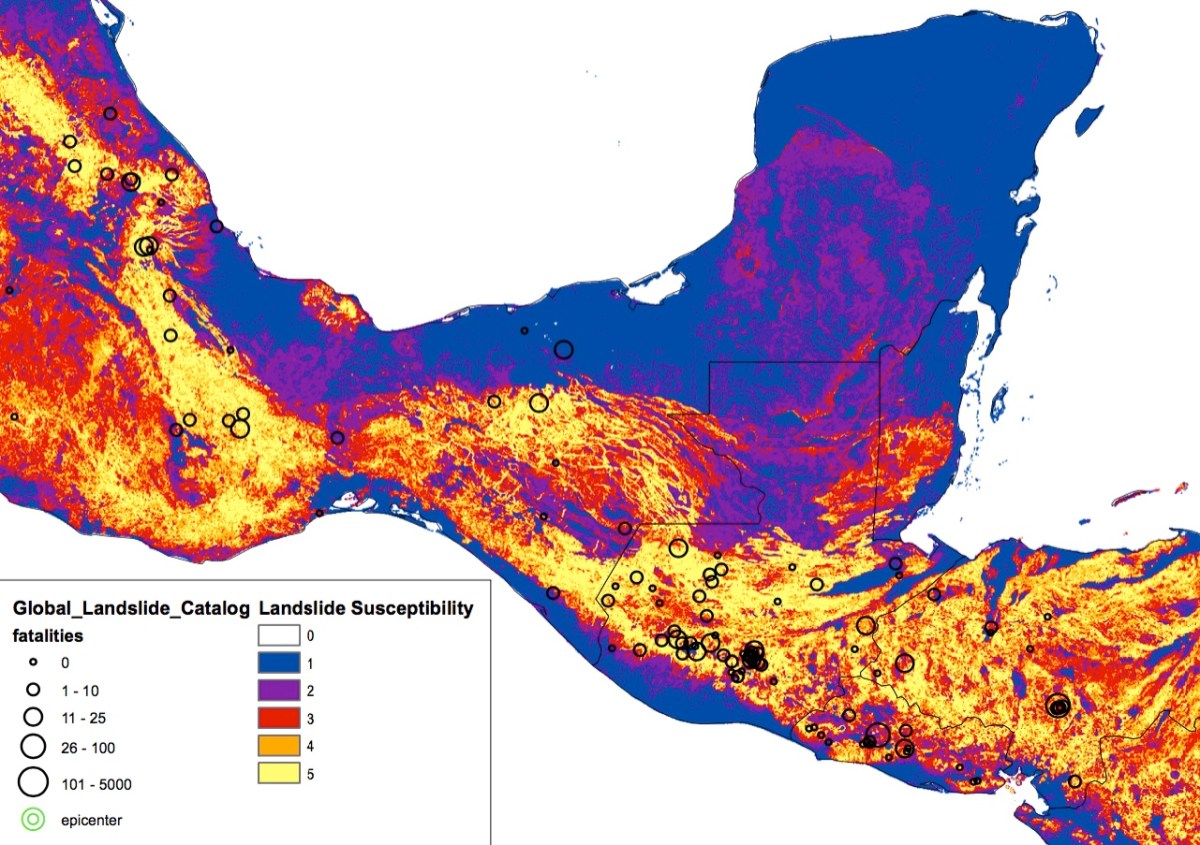
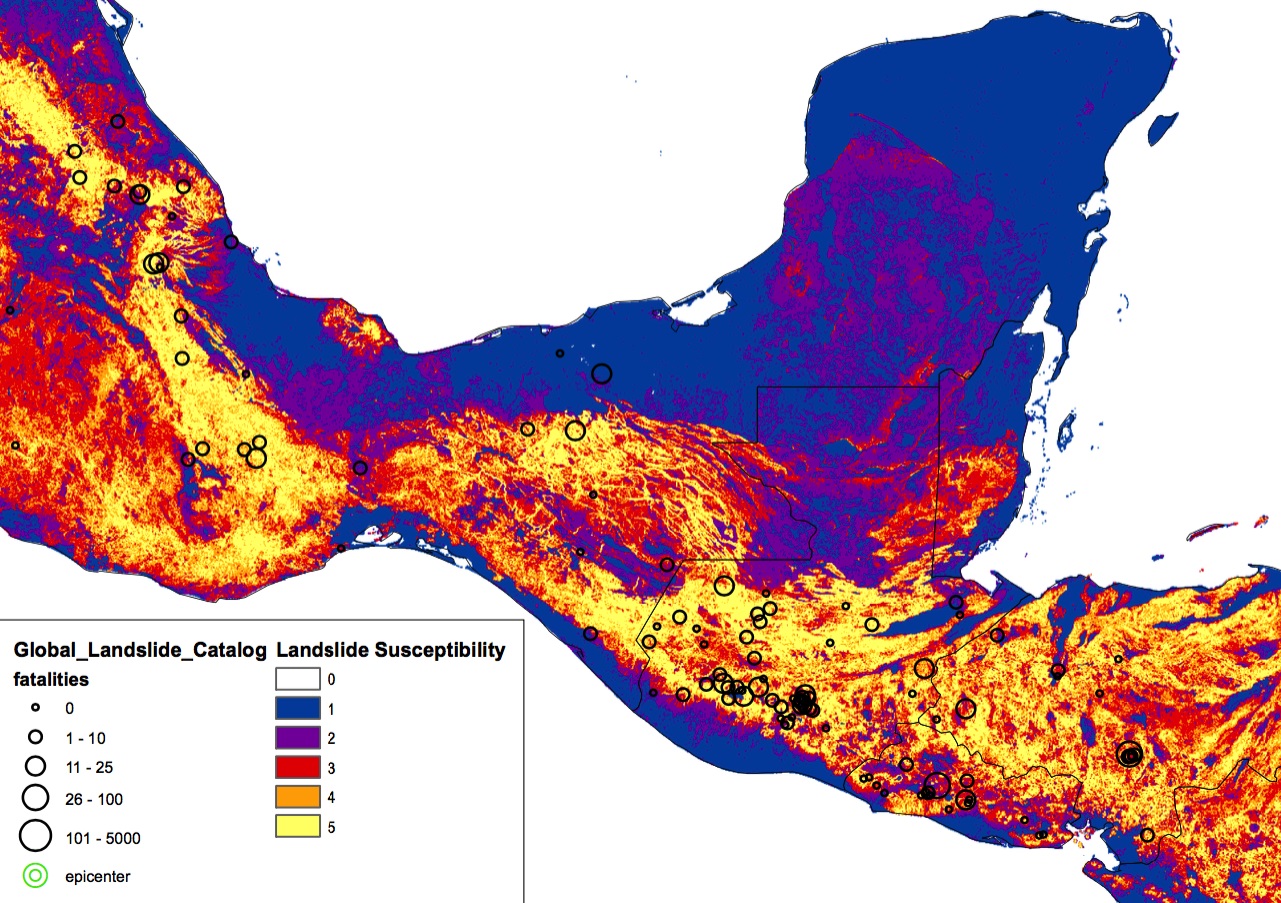
Using historical and current satellite data on rainfall, the program provided disaster managers with a map showing areas at risk of landslides after the major Sept. 7 earthquake offshore of Chiapas, Mexico.

In 2016 NASA responded to nearly 100 events, enabling coordination and information support for a wide range of global incidents.

“Our program is like a think tank with the technical expertise and strong relationships that we draw on to provide useful products to disaster managers,” said David Green, manager of NASA’s Disasters Program, part of the Earth Science Division in the agency’s Science Mission Directorate in Washington. “When disasters occur, our researchers become providers and distributors of images, data, and damage assessments.”

Dedicated teams of Earth-observation disaster specialists at seven NASA centers respond to events in real-time and work with partner agencies to get them the information they need. The program mobilizes for intensive risk events that span a range of natural hazards – earthquakes, tsunamis, wildfires, floods, landslides, severe weather, winter storms, tropical cyclones, and volcanoes – plus manmade events such as oil spills and industrial accidents.

Related link:

NASA Feature: “When Disaster Strikes, NASA Brings the Power of Space