The International Day of Disaster Reduction 2018 is on October 13, and NASA is marking the occasion by sharing highlights of how we provide data to support disaster reduction and help improve recovery efforts. The NASA Disasters Team, a part of the Applied Sciences Program within NASA’s Earth Science Division, promotes the use of streamed data to prepare for, respond to and recover from natural and technological disasters. The NASA Disasters team targets a spectrum of disasters including floods, earthquakes, volcanoes, landslides, and oil spills, as well as assesses hazards to vulnerable populations and livelihoods.
Here’s a few ways in which the Disasters Team is working to reduce risk:
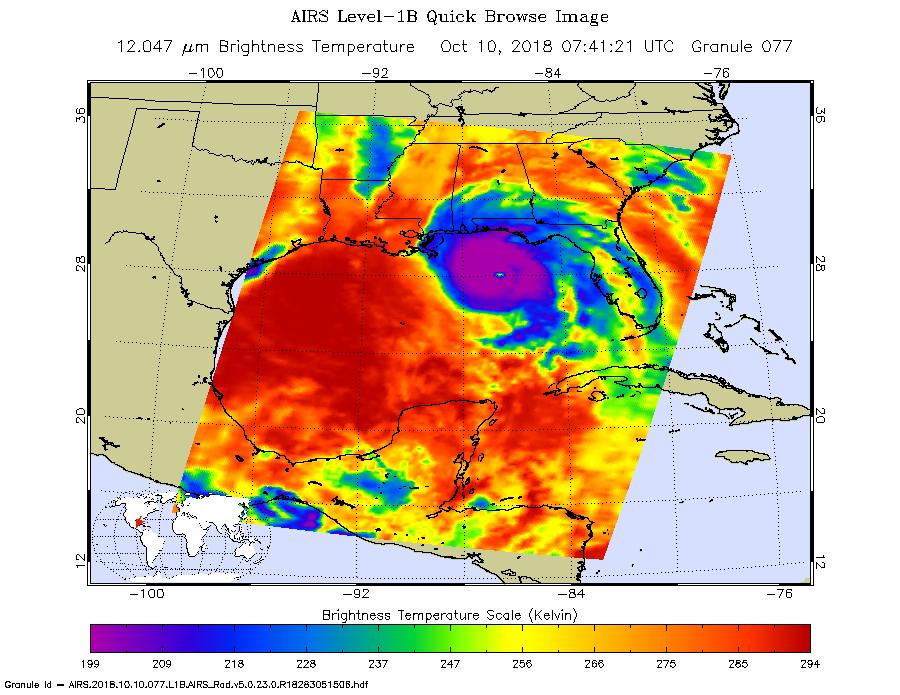
The Atmospheric Infrared Sounder (AIRS) onboard NASA’s Aqua satellite shows Hurricane Michael on October 10, 2018. Credit: NASA JPL-Caltech
NASA’s AIRS instrument was used to support disaster risk reduction by providing critical information to Florida emergency managers on the impact of wind direction and speed before Hurricane Michael made landfall.
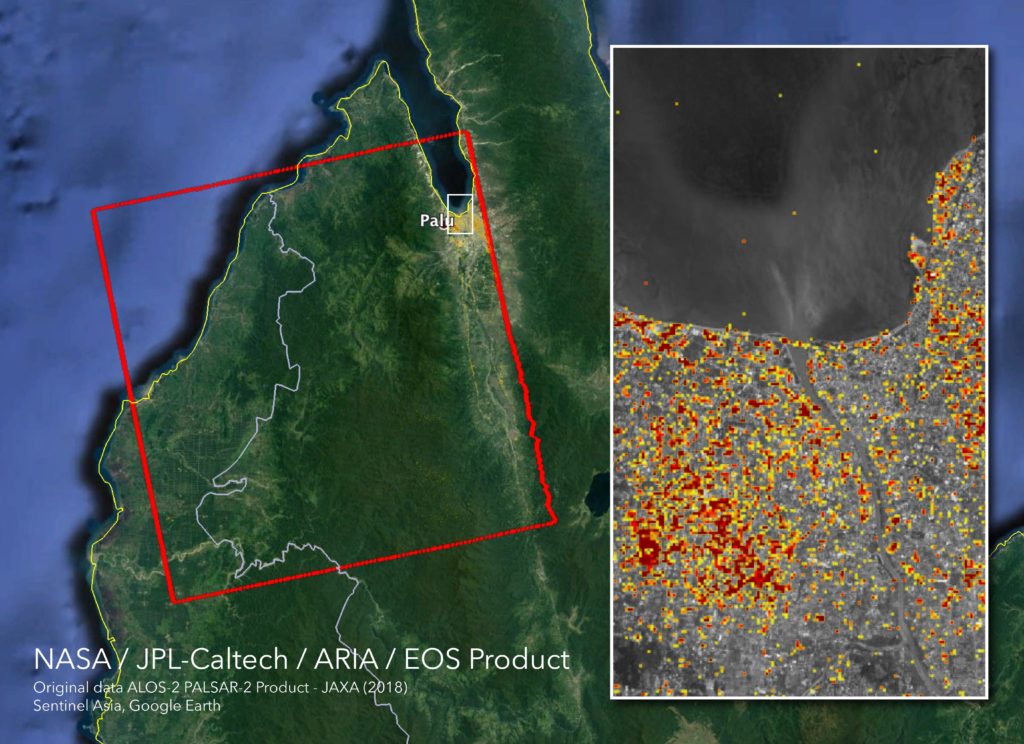
The Advanced Rapid Imaging and Analysis (ARIA) team created a damage proxy map (close-up right) for Palu, Indonesia. Credit: NASA JPL-Caltech
NASA’s ARIA team created damage proxy maps after the Palu, Indonesia earthquake. These images help governments and responders identify areas that experienced significant damage and allocate resources accordingly to reduce risk.
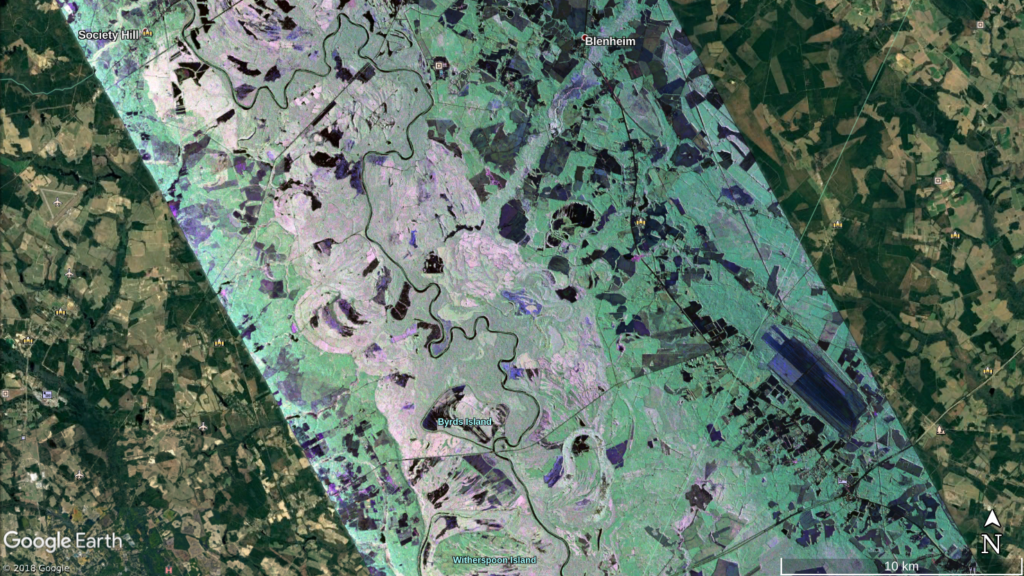
Floodwaters in the Carolinas from Hurricane Florence. Credit: NASA
To support disaster risk reduction NASA developed an airborne radar mission to give agencies like FEMA and the U.S. Forest Service a much-needed view of floodwaters that threatened areas in North Carolina and South Carolina.
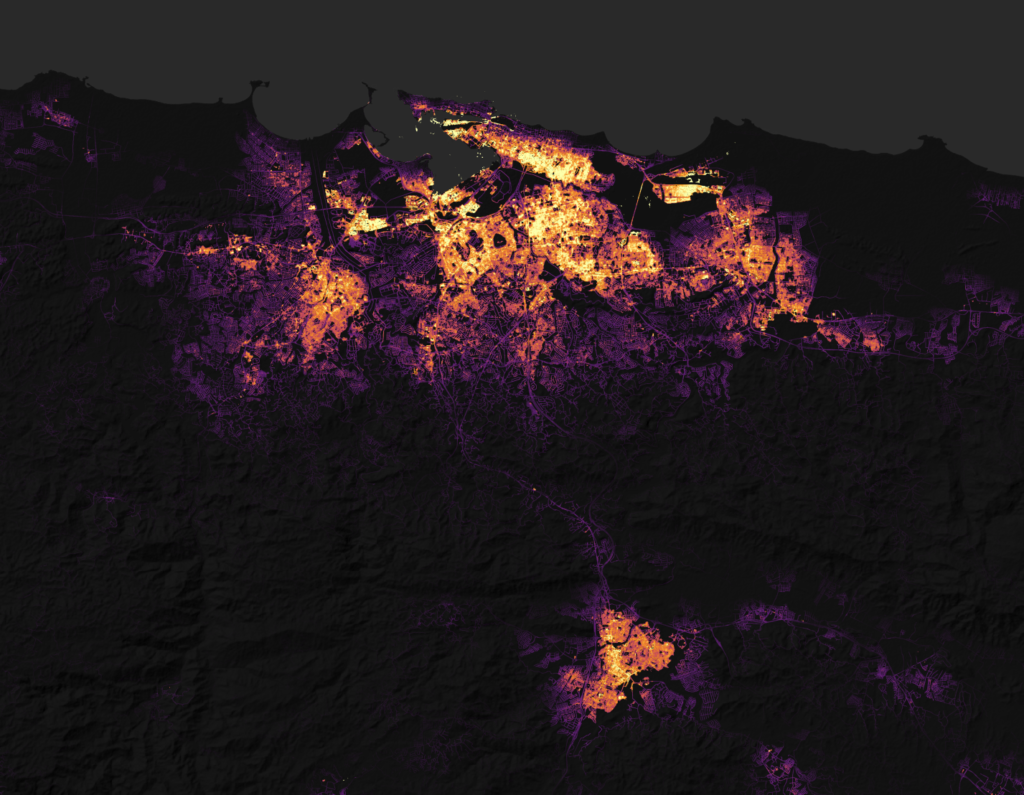
Night lights show San Juan, Puerto Rico, before Hurricane Maria, 2017. Credit: NASA Goddard
NASA used its Black Marble technology to pinpoint where the lights went out after Hurricane Maria devastated Puerto Rico. Knowing where the power is out-and how long the power has been out-allowed first responders to better deploy rescue and repair crews and to distribute life-saving supplies.
The VIIRS instrument on the joint NASA/NOAA Suomi NPP satellite observed Hurricane Florence as it developed in the Atlantic Ocean and made landfall in North Carolina on Sept. 14, 2018. Credits: NASA Worldview
NASA has been tracking Florence since it began moving toward the East Coast of the United States and continued to monitor the storm as it inched across the Carolinas and farther inland. The space agency’s Earth Science Disasters Program is sparing no available resource in working to keep disaster responders and agencies such as FEMA and the National Guard informed with the latest information to assist in decisions on everything from evacuations to supply routes and recovery estimates. Products can be found on the NASA Disasters Mapping Portal.
Here’s a snapshot of some of the ways NASA has been monitoring the storm and its repercussions:
LAND, ATMOSPHERE NEAR REAL-TIME CAPABILITY FOR EOS
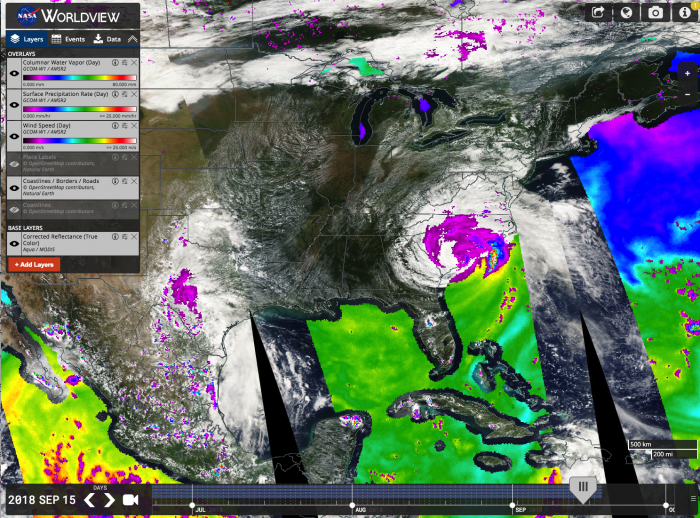
LANCE imagery of water vapor, precipitation, and wind speed in Hurricane Florence from Sept. 15, 2018, viewed in NASA Worldview. Credits: NASA
NASA’s Land, Atmosphere Near real-time Capability for EOS (Earth Observing System) (LANCE) provides data and imagery from Terra, Aqua, Aura, Suomi NPP, and GCOM-W1 satellites in less than three hours from satellite observation to meet the needs of the near real-time applications community. LANCE leverages existing satellite data processing systems in order to provide such products from select EOS instruments. These data meet the timely needs of applications such as numerical weather and climate prediction, forecasting and monitoring natural hazards, agriculture, air quality, and disaster relief.
ARIA FLOOD EXTENT MAPS
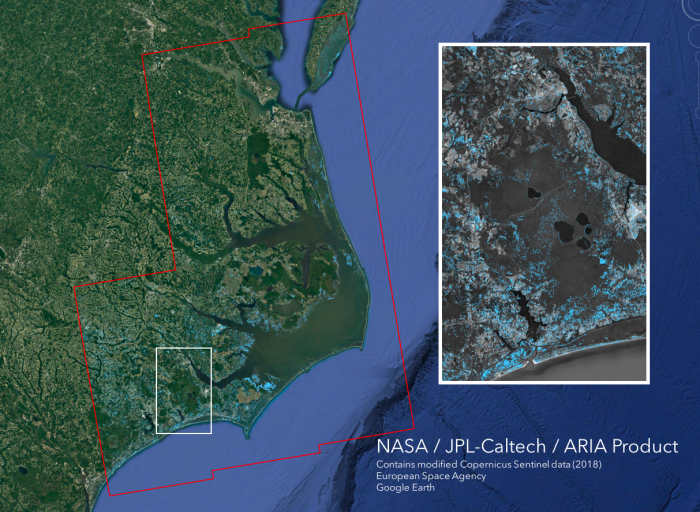
These images, derived from synthetic aperture radar (SAR) images from the Copernicus Sentinel-1 satellites, operated by the European Space Agency, were taken before Florence, on September 02, 2016, and 12 hours after the storm’s landfall at 7:06 PM local time on September 14, 2018. Credits: NASA
The Advanced Rapid Imaging and Analysis (ARIA) team at NASA’s Jet Propulsion Laboratory in Pasadena, California, created a flood extent map from Sentinel-1 synthetic aperture radar data acquired 12 hours after Hurricane Florence made landfall. The map, which was pushed to FEMA’s SFTP server (and is available to download), depicts areas of the Carolinas in light blue pixels that are likely flooded.
Media reports provided anecdotal preliminary validation. This map was cross-validated with ARIA’s earlier flood proxy map. This flood proxy map should be used as guidance to identify areas that are likely flooded, and may be less reliable over urban and vegetated areas.
To overcome that limitation, NASA’s Uninhabited Aerial Vehicle Synthetic Aperture Radar (UAVSAR) instrument aboard NASA’s C-20A aircraft is slated to fly over flooded areas to validate and improve these maps as well as provide near real-time imagery to assist local, state and federal partners.
For example, barrier islands and the immediate coastlines have borne the brunt of the storm surge and wind damage, resulting in the destruction of property along the coastline. UAVSAR imagery will help to clarify areas that have been impacted. Rapid acquisition of UAVSAR imagery revealing damaged homes and infrastructure provides higher spatial resolution details to complement “damage proxy maps” and other change detection approaches applied from routinely collected imagery or special collections from international partners.
VISIBLE INFRARED IMAGING RADIOMETER SUITE
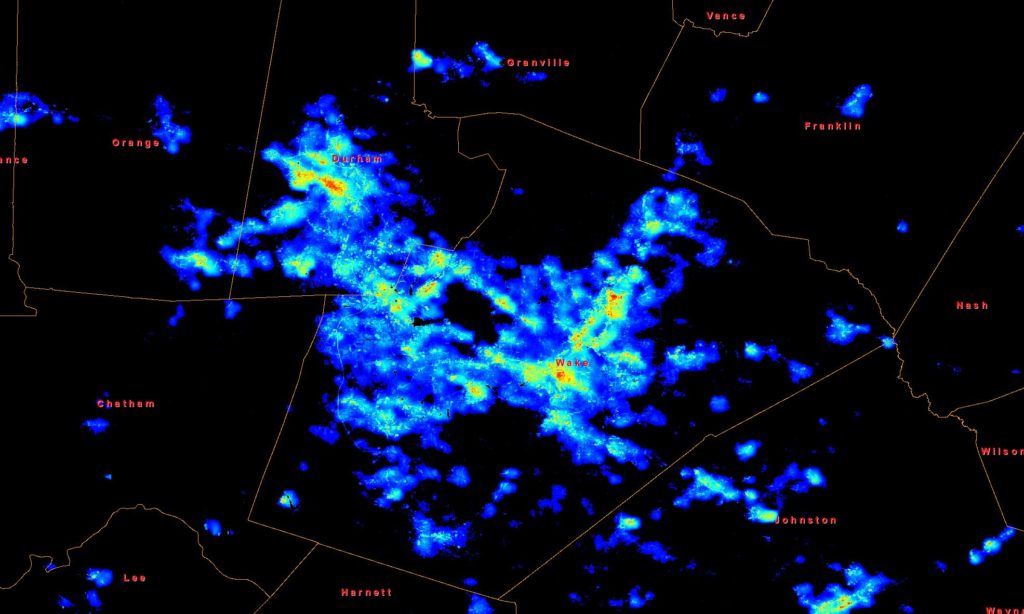
This pre-Florence image in Raleigh and Durham, North Carolina, is based on composite Black Marble images gathered between August 10 and Sep 11, 2018. The image shows areas in high-light condition in red, while areas in low-light condition are in black. The Black Marble Level 3 and HD data are continuously being produced and delivered for the latest day available. Credits: NASA
The Day/Night Band sensor of the Visible Infrared Imaging Radiometer Suite (VIIRS) aboard the Suomi-National Polar-orbiting Partnership and Joint Polar Satellite System satellite platforms (both NOAA partnerships) provide global daily measurements of nocturnal visible and near-infrared light. The VIIRS Black Marble product suite detects light in a range of wavelengths from green to near-infrared, including city lights and lights from other activity.
On September 14, 2018 North Carolina officials said the number of power outages due to Florence was more than half a million. The NASA Black Marble product suite has been used to assess disruptions in energy infrastructure and utility services following major disasters. The night-time imageries are useful for pre-event and post-event mapping and monitoring of power outages in cloud-free conditions.
SATELLITES MAKE WEATHER MONITORING POSSIBLE
NASA relies heavily on its fleet of Earth-orbiting satellites as well as satellites from partner institutions for data that feeds into critical weather and climate models. Below is a summary of a few of those assets:
ATMOSPHERIC INFRARED SOUNDER
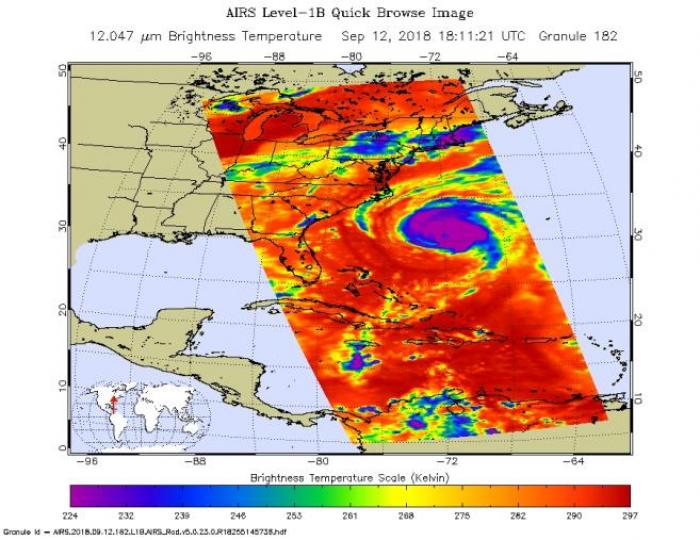
This image, taken at 1:35pm EDT on Tuesday, September 11, 2018, by the Atmospheric Infrared Sounder (AIRS) aboard NASA’s Aqua satellite, shows Hurricane Florence, which, at the time, had maximum sustained winds of 140 mph (225 kph). Credits: NASA
Aboard the Aqua satellite, the agency’s Atmospheric Infrared Sounder (AIRS), in conjunction with the Advanced Microwave Sounding Unit (AMSU), was able to capture three-dimensional images of the storm’s approach by sensing emitted microwave and infrared radiation. Warm colors in the infrared image (red, orange, yellow) show areas with little cloud cover, while cold colors (blue, purple) show areas covered by clouds at high, cold altitudes. The darker the color, the colder and higher the clouds and the stronger the thunderstorms. In partnership with the National Oceanic and Atmospheric Administration, these atmospheric observations are assimilated into operational prediction centers around the world to improve hurricane path prediction and other forecasts.
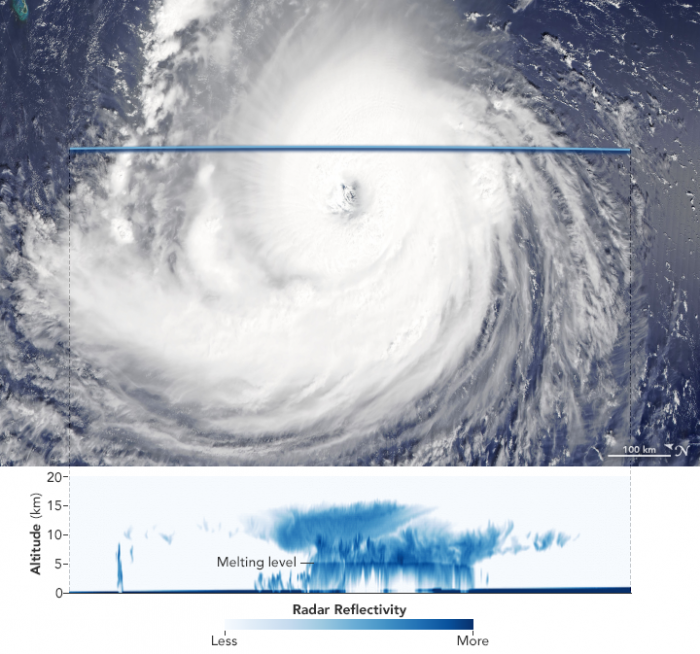
This natural-color image shows Hurricane Florence as captured by the Moderate Resolution Imaging Spectroradiometer (MODIS) instrument on the Aqua satellite on Sept. 11, 2018. The second image, acquired by the CloudSat satellite on the same day, shows a cross-section of how the storm would look if it had been sliced near the middle and viewed from the side. Credits: NASA
Another powerful instrument aboard the Aqua satellite (the same instrument is also aboard Aqua’s “twin” satellite, Terra) is the Moderate Resolution Imaging Spectroradiometer (MODIS). Aqua and Terra work in tandem to image the entire globe once every one to two days, which allows MODIS to capture a sweeping picture of any number of Earth dynamics, including storms, through its 36 spectral bands, or groups of wavelengths.
Here, a MODIS image of Florence is shown with a cross-section of the storm taken on the same day by NASA’s Cloudsat satellite. The CloudSat pass offers a unique view of Florence’s asymmetrical structure, the intense convection and rainfall churning inside the storm, and a complex vertical cloud structure that is not visible from above. The storm’s clouds reached an altitude of about 15 kilometers (9 miles) at their highest point—fairly high for a tropical cyclone. The darkest blues represent areas where clouds and raindrops reflected the strongest signal back to the satellite radar. These areas had the heaviest precipitation and the largest water droplets. The blue horizontal line across the data is the melting level; ice particles were present above it, raindrops below it.
MULTI-ANGLE IMAGING SPECTRORADIOMETER
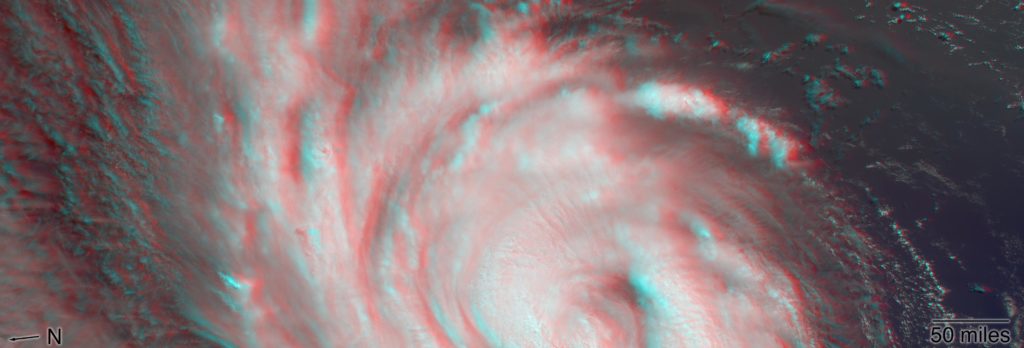
NASA’s Multi-angle Imaging SpectroRadiometer (MISR) passed over Hurricane Florence as it approached the eastern coast of the United States on Thursday, Sept. 13, 2018. Credits: NASA
Global multi-angle imagery of the sunlit Earth is the specialty of the Multi-angle Imaging Spectroradiometer (MISR) aboard NASA’s Terra satellite. The instrument takes seven minutes to capture images from all nine of its cameras to observe the same location. MISR can reveal areas of high cloud cover associated with strong thunderstorms as well as spot powerful outer rain bands, which can sometimes spawn tornadoes.
SOIL MOISTURE ACTIVE PASSIVE
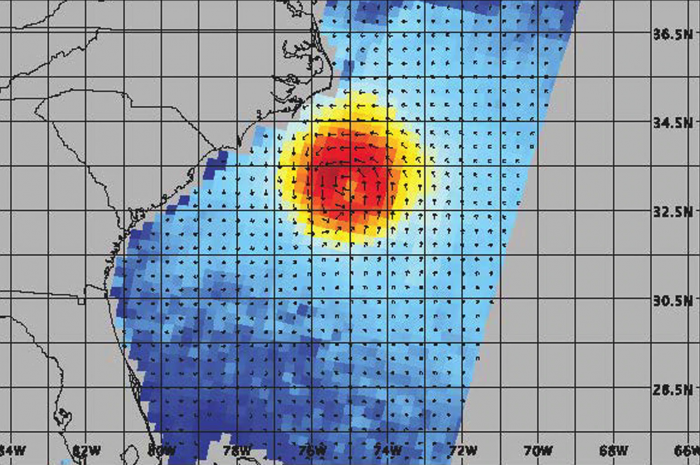
SMAP wind estimates over Hurricane Florence on Sept. 12, 2018 at 10:49 UTC and on Sept. 13, 2018 at 11:25 UTC. Credits: NASA
Managed by the Jet Propulsion Laboratory in Pasadena, California, and in coordination with NASA’s Goddard Space Flight Center in Greenbelt, Maryland, the polar-orbiting Soil Moisture Active Passive (SMAP) satellite plays a key role in forecasting flooding conditions. SMAP measures the amount of water in the top 5 centimeters (2 inches) of soil everywhere on Earth’s surface every 2 to 3 days. This permits changes of soil moisture around the world to be observed over time scales ranging from the life cycles of major storms to repeated measurements of changes over entire seasons. SMAP is also capable of estimating wind speeds over the ocean, as shown in the image above.
INTERNATIONAL SPACE STATION ASSIST
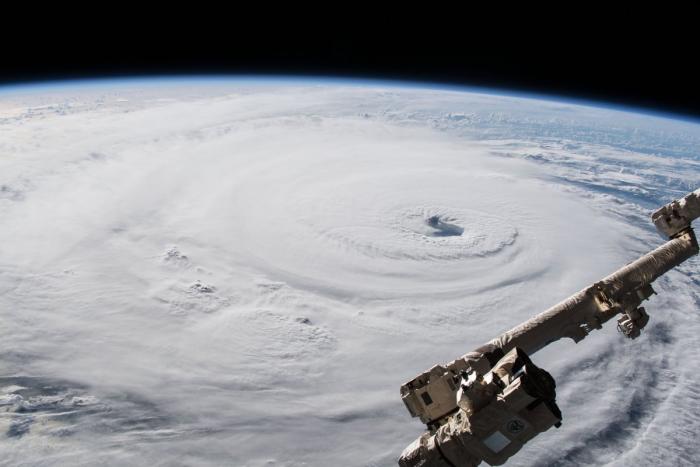
An astronaut’s photograph of Hurricane Florence as seen from the International Space Station on Sept. 12, 2018, as it was then situated about 600 miles from Southeast U.S. coastline. Credits: NASA
Astronauts aboard the International Space Station (ISS) have been snapping images of Florence with handheld digital cameras throughout the storm’s progression. Once the storm has passed and cloud cover lessens, requests to document flooding and changes to the land surface will be sent to the crew as part of ongoing NASA ISS response to the International Disaster Charter activation for Hurricane Florence. Imagery of this type is then georeferenced by the Earth Science and Remote Sensing Unit at NASA’s Johnson Space Center in Houston.
Also aboard the ISS is the Lightning Imaging Sensor (LIS), which detects the distribution and variability of total lightning day and night in order to improve severe weather forecasting and further scientific study on the relationship between lightning, clouds, and precipitation. Over a 12-hour period, LIS observed an average of more than 5 lightning flashes every 90 seconds in the vicinity of Hurricane Florence on September 14, 2018.
On Sept. 7, NASA’s Global Precipitation Measurement, or GPM, core observatory satellite flew over Hurricane Florence, capturing a 3D image as the storm’s clouds started to break apart before reforming. Credits: NASA
NASA’s Earth Science Disaster Program is using the vantage point of space to provide important information to disaster responders before and after Hurricane Florence approaches the Carolinas.
Before the storm makes landfall, the space agency is utilizing data from satellites, such as Soil Moisture Active Passive (SMAP) to home in on areas that are saturated with water and Global Precipitation Measurement (GPM) to track rainfall rates across the body of the storm, in order to help determine which areas are at greater risk for flooding. The potential for landslides is also evaluated by looking at those factors in addition to land topography.
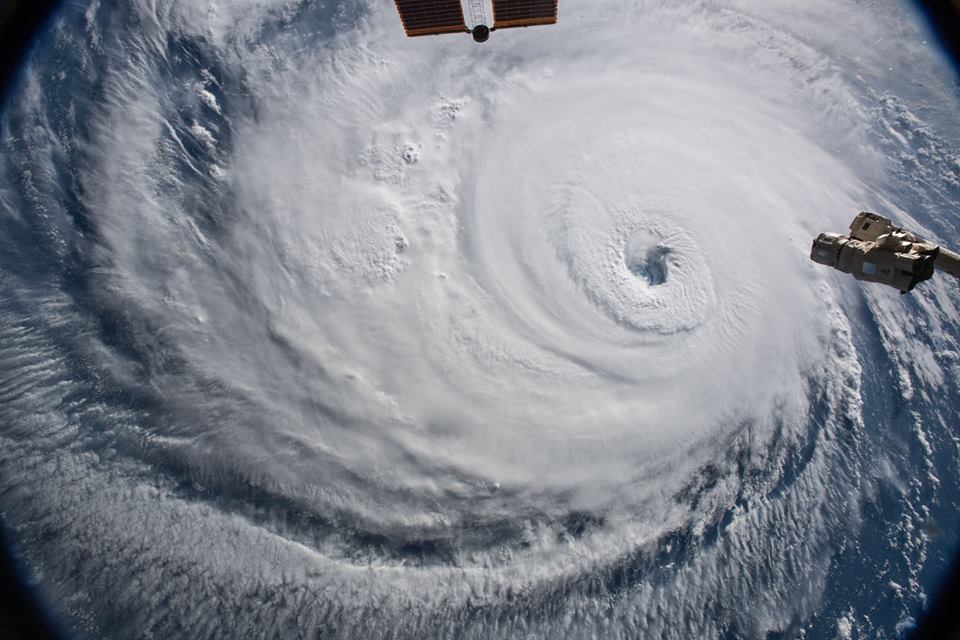
The crew aboard the International Space Station stared down the menacing eye of what was then Category 4 Hurricane Florence on Sept. 12 as it moved across the Atlantic Ocean and toward the East Coast of the United States. Credits: NASA
Astronauts aboard the International Space Station are also taking advantage of their one-of-a-kind vantage point a few hundred miles above Earth as they snap photos of the hurricane with handheld digital cameras. These wide-field, panoramic images help inform the size, scale, and location of the storm based on the ISS orbital ground track location, and multiple images taken over time relays important data on its evolution and life cycle.
As the storm hits the coasts and marches inland, NASA’s continually updated flood extent maps, derived from radar-based satellites that can “see through” clouds, will identify inundated areas, and the latest in flood modeling will anticipate for decision makers where flooding may occur next. This information is important for a number of decisions pertaining to evacuation routes, supply chains, and resource and relief allocation.
To provide situational awareness for first responders and other government authorities, in the storm’s aftermath NASA will maintain flood extent maps drawn from data collected by the Moderate Resolution Imaging Spectroradiometer (MODIS) aboard the Terra and Aqua satellites as well as the Landsat satellite, a joint mission of NASA and the U.S. Geological Survey.
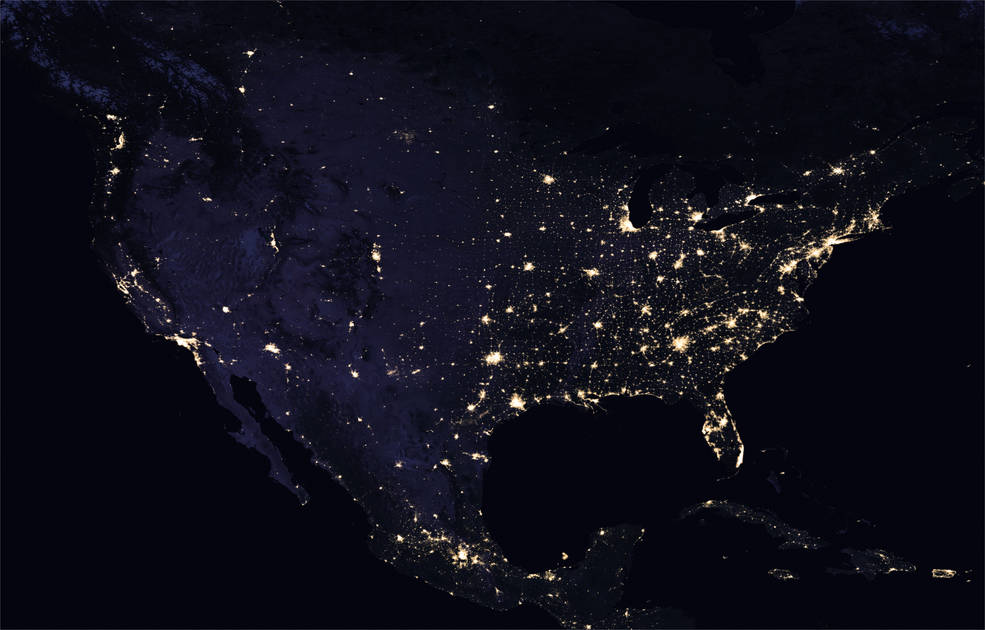
Composite image of the continental U.S. at night, 2016. Credits: NASA Earth Observatory images by Joshua Stevens, using Suomi NPP VIIRS data from Miguel Román, NASA’s Goddard Space Flight Center
Another tool in the recovery effort is NASA Goddard Space Flight Center’s Black Marble product suite, which can report daily on whether the power is on over over large swaths of land. Such information is important for understanding the extent of the damage, especially in remote and isolated areas that might not have robust communications systems in place. The technology was demonstrated during the response and recovery efforts following Hurricanes Irma and Maria in Puerto Rico, as it helped local communities strengthen their resilience by identifying preexisting infrastructure vulnerabilities across the island’s housing, transportation, and energy sectors.
Click here to watch NASA Administrator Jim Bridenstine and NASA Disasters Program Manager David Green discuss how the space agency is assisting federal and state partners in preparing for and responding to Hurricane Florence.
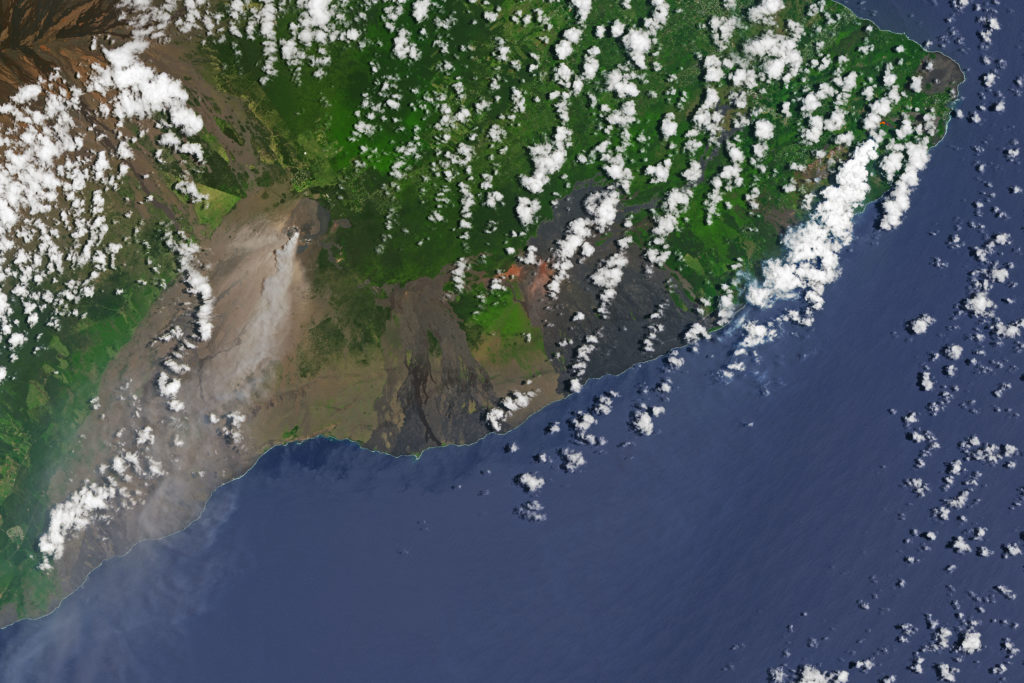
At 10:41 a.m. local time (20:41 Universal Time) on May 14, 2018, the Operational Land Imager (OLI) on Landsat 8 acquired a natural-color image of the volcano. Credit: NASA Earth Observatory
NASA is tracking lava flows from Hawaii Island’s Kilauea volcano as fissures erupt and lava makes its way to the ocean.
Using data from the Visible Infrared Imaging Radiometer, or VIIRS, instrument aboard the NASA-NOAA Suomi NPP satellite, NASA’s Disaster Program has been tracking thermal anomalies, or hot spots, indicative of lava flow. VIIRS is the only instrument from space that can track lava flows through hot spots, making it an important additional source of information for the U.S. Geological Survey as it monitors and informs the public of the ongoing volcanic activity, which has produced everything from earthquakes and giant rock projectiles from eruptions to blankets of ash clouds and volcanic smog, or vog.
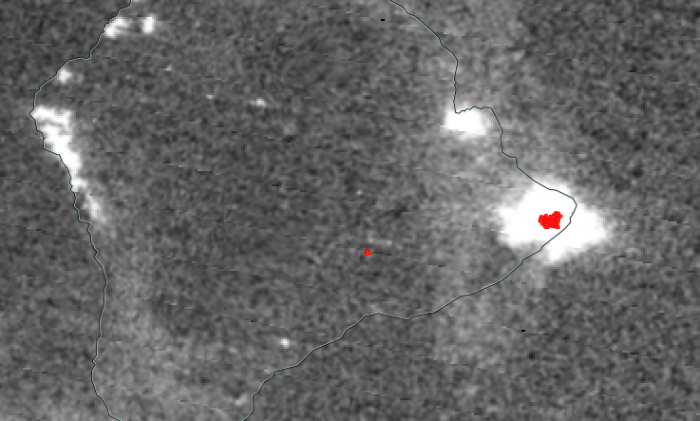
Credit: NASA
For example, VIIRS captured the above enhanced nighttime image on May 14, 2018, superimposed with hot spots highlighted in red. Multiple hot spots were observed on this satellite overpass near the southeast tip of Hawaii Island. Kilauea volcano is represented by the hot spot to the west.
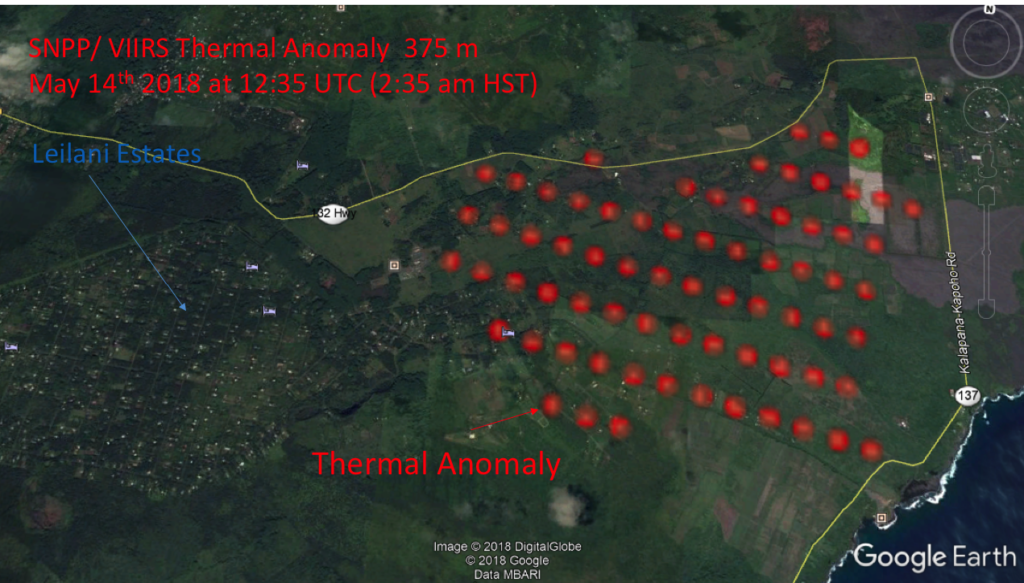
Credit: NASA
Zooming in over this area shows that those hot spots were located farther east from Leilani area and were consistent with new fissures observed on the ground.
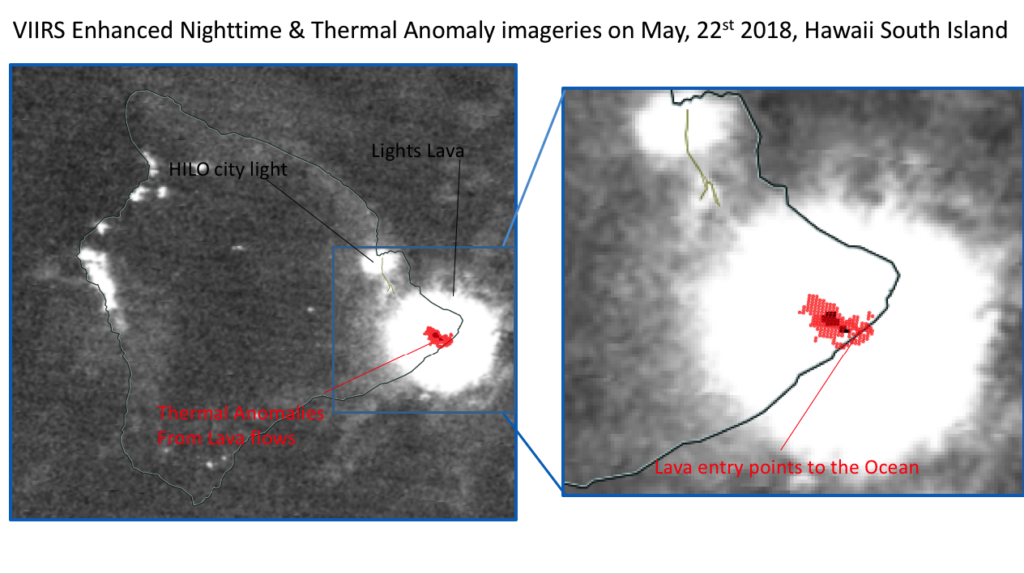
Credit: NASA
This VIIRS image from May 22, 2018, shows the extension of the hot spots toward the ocean, indicating that lava is moving toward and warming the ocean upon contact.
In addition to VIIRS, NASA provides other information on volcanic activity, including aerosol and sulfur dioxide measurements derived from the Ozone Monitoring Instrument (OMI) aboard NASA’s Aura satellite as well as the Ozone Mapping Profiler Suite aboard NASA-NOAA Suomi NPP satellite, and ground deformation and movement with synthetic aperture radar data.
NASA also organized a field mission with airborne radar to provide accurate digital elevation maps that USGS can use to predict lava path flows. Flown on the G-III research aircraft, the Jet Propulsion Laboratory’s Glacier and Ice Surface Topography Interferometer (GLISTIN) instrument is detecting changes in Kilauea’s topography associated with the new lava flows, with the goal of measuring the erupted volume as a function of time and ultimately the total volume of the event.
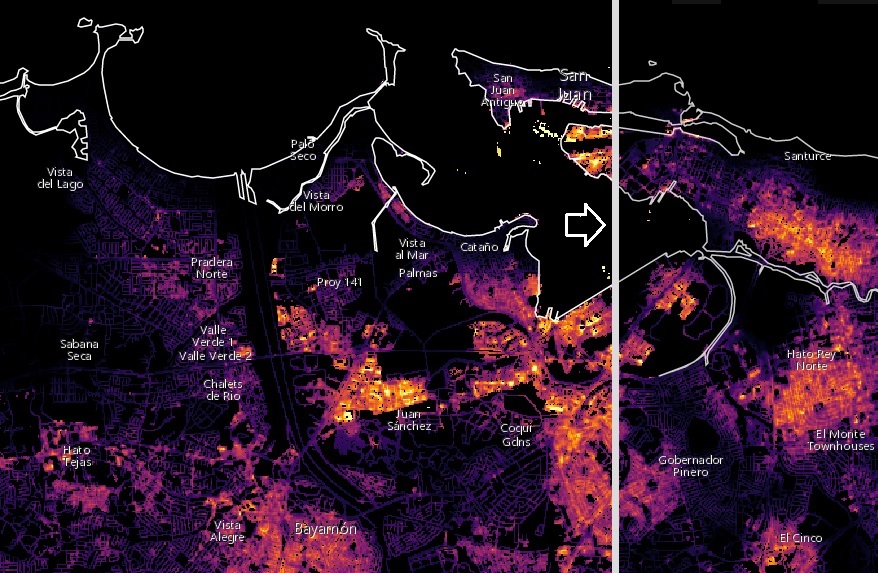
Using satellite data of Puerto Rico showing nighttime lights before Hurricane Maria and after, NASA scientists produced maps that show areas where electric power has been lost or reduced. A portion of San Juan is shown here. Credit: NASA
After Hurricane Maria tore across Puerto Rico, it quickly became clear that the destruction would pose daunting challenges for first responders. Most of the electric power grid and telecommunications network was knocked offline. In circumstances like this, quickly knowing where the power is out—and how long it has been out—allows first responders to better deploy rescue and repair crews and to distribute life-saving supplies.
Teams of scientists at NASA are working long days to make sure that groups like the National Guard and the Federal Emergency Management Agency (FEMA) get high-quality satellite maps of power outages in Puerto Rico.
These before-and-after images of Puerto Rico’s nighttime lights are based on data from the NASA-NOAA Suomi NPP satellite. The data detect light in a range of wavelengths from green to near-infrared, including reflected moonlight, light from fires and oil wells, lightning, and emissions from cities or other human activity.
The maps were provided to first responders in Puerto Rico by the NASA Disasters Program, part of the Earth Science Division. Dedicated teams of Earth-observation disaster specialists at NASA centers mobilize to assist in preparations for, responses to, and recovery from a wide range of natural and human-made hazards.
Click here for more information on these maps and to use an online tool to compare recent images of Puerto Rico at night with a baseline view acquired before Hurricane Maria. Click here to download high-resolution before-and-after images of the San Juan area.
NASA used satellite data to create this “damage proxy map” of locations in the San Juan, Puerto Rico, area that are likely damaged as a result of Hurricane Maria (red and yellow pixels). Credit: NASA
NASA’s Disasters Program has delivered to the Federal Emergency Management Agency (FEMA) a map of areas in eastern Puerto Rico that have likely been damaged as the result of the landfall of Hurricane Maria on Sept. 20.
The “damage proxy map” was created by the Advanced Rapid Imaging and Analysis team at NASA’s Jet Propulsion Laboratory in Pasadena, California, and Caltech, The map is derived from synthetic aperture radar images from the Copernicus Sentinel-1A and Sentinel-1B satellites, operated by the European Space Agency. The images were taken before and after the storm’s landfall. The map was delivered to responding agencies, including FEMA, which combined the map with building infrastructure data to estimate a damage density map. This information was sent to FEMA’s Urban Search and Rescue teams in the field in Puerto Rico.
The full map covers an area of 105 by 60 miles, with an inset showing the extent of damage in and around the capital city of San Juan. Each pixel in this image measures about 98 feet across. The color variation from yellow to red indicates increasingly more significant ground surface change. This damage proxy map can be used as guidance to identify damaged areas.
The NASA Disasters Program, part of the Earth Science Division in the Science Mission Directorate, works with international, regional, and local disaster management agencies to provide critical information using global environmental data from NASA’s fleet of Earth science satellites and other airborne and space-based assets. Dedicated teams of Earth-observation disaster specialists at NASA centers mobilize to assist in preparations for, responses to, and recovery from a wide range of natural and human-made hazards.
Click here for more information and to download the high-resolution image.
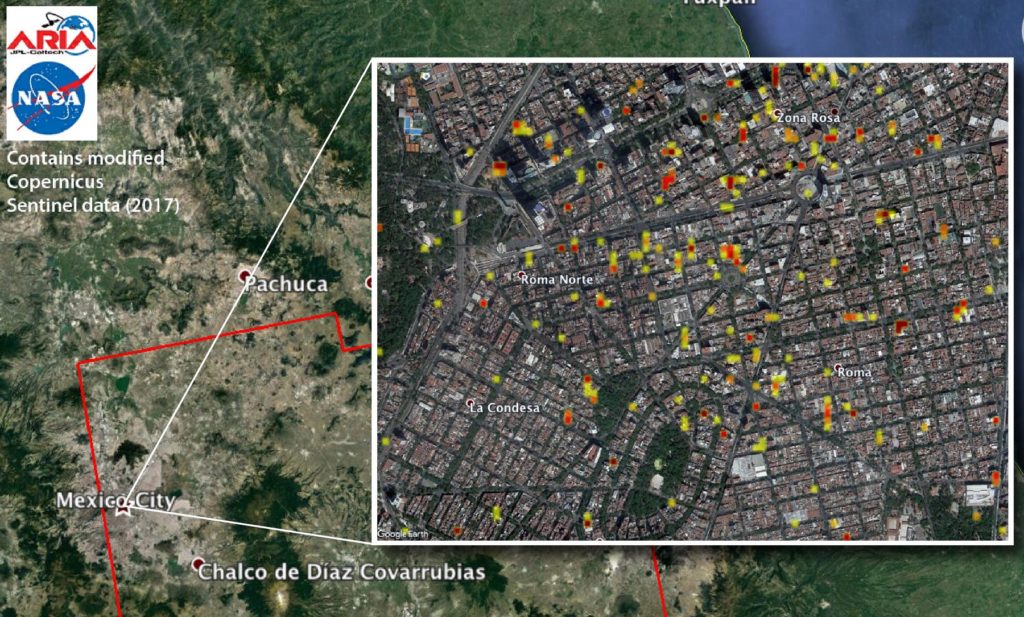
A NASA-produced map of areas likely damaged by the Sept. 19 magnitude 7.1 Raboso earthquake near Mexico City has been provided to Mexican authorities to help responders and groups supporting the response efforts. The quake, which struck 75 miles southeast of Mexico City, caused significant loss of life and property damage.
To assist in the disaster response efforts, scientists at NASA’s Jet Propulsion Laboratory and Caltech, both in Pasadena, California, obtained and used before-and-after interferometric synthetic aperture radar (InSAR) satellite imagery of areas of Central Mexico, including Mexico City, affected by the quake, to identify areas of damage and produce what is known as a Damage Proxy Map. The imagery — acquired before the quake on Sept. 8, and again on Sept. 20, 2017, just six-and-a-half hours after the earthquake — is from the radar instrument on the Copernicus Sentinel-1A and Sentinel 1-B satellites operated by the European Space Agency.
The NASA Disasters Program, part of the Earth Science Division in the Science Mission Directorate, works with international, regional, and local disaster management agencies to provide critical information using global environmental data from NASA’s fleet of Earth science satellites and other airborne and space-based assets. Dedicated teams of Earth-observation disaster specialists at NASA centers mobilize to assist in preparations for, responses to, and recovery from a wide range of natural and human-made hazards.
Click here for more information and download of this map.
When major disasters strike, NASA mobilizes to aid disaster response and recovery efforts by bringing the power of space – data from science satellites circling the globe or from the International Space Station – to responders on the ground.
Tapping the terabytes of global environmental data streaming down every day from NASA’s fleet of Earth-orbiting satellites and other airborne and space-based assets, the NASA Earth Science Disasters Program works with international, regional, and local natural disaster response agencies and other Earth-observing space agencies around the world to quickly deliver critical information.
The program has been particularly active over the past month since Hurricane Harvey formed in late August, followed by Hurricanes Irma and Maria and two major earthquakes in Mexico. NASA provided an array of information products in support of disaster responses to each of these events.
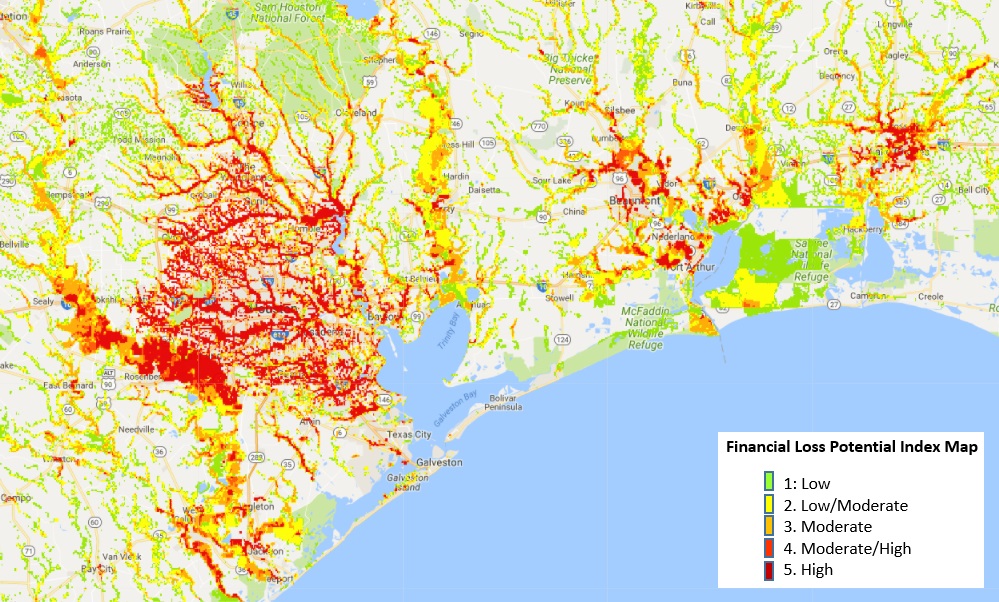
In the aftermath of Hurricane Harvey, NASA produced a map (below) of “financial loss potential” in Texas and Louisiana by combining data on the extent of flooding with property values in affected areas.
The program created a collection of georeferenced digital camera images taken by astronauts on the International Space Station in mid-September that detail the flooding in Florida caused by Hurricane Irma.
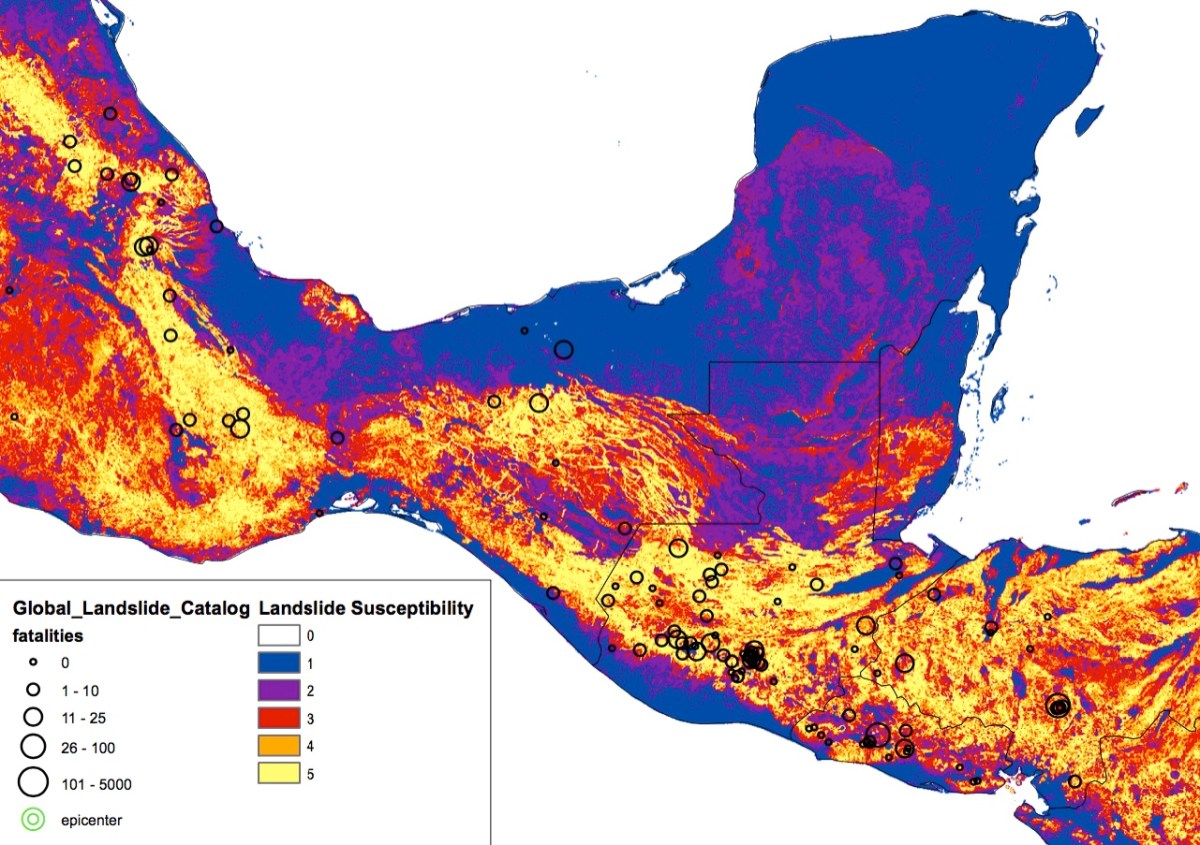
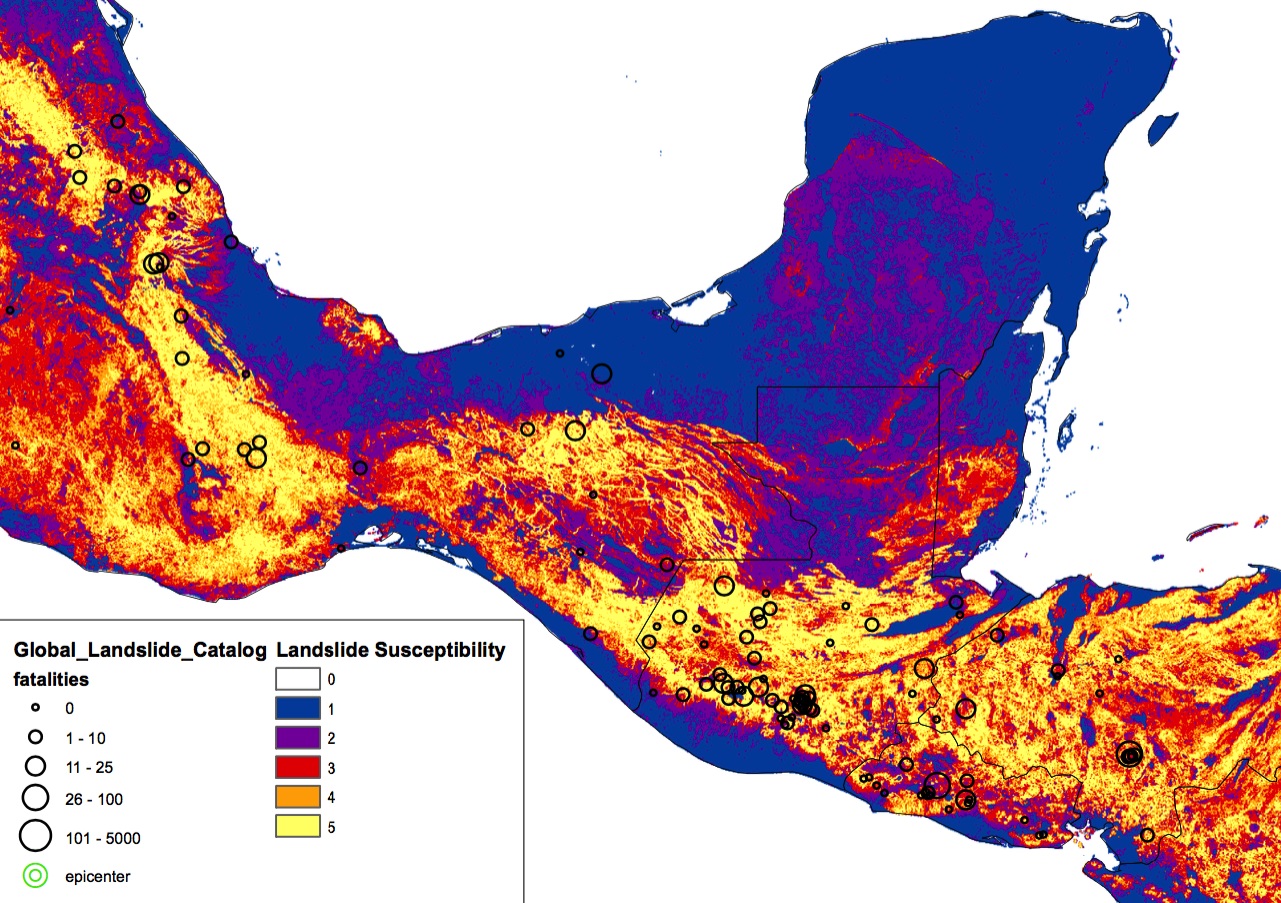
Using historical and current satellite data on rainfall, the program provided disaster managers with a map showing areas at risk of landslides after the major Sept. 7 earthquake offshore of Chiapas, Mexico.
In 2016 NASA responded to nearly 100 events, enabling coordination and information support for a wide range of global incidents.
“Our program is like a think tank with the technical expertise and strong relationships that we draw on to provide useful products to disaster managers,” said David Green, manager of NASA’s Disasters Program, part of the Earth Science Division in the agency’s Science Mission Directorate in Washington. “When disasters occur, our researchers become providers and distributors of images, data, and damage assessments.”
Dedicated teams of Earth-observation disaster specialists at seven NASA centers respond to events in real-time and work with partner agencies to get them the information they need. The program mobilizes for intensive risk events that span a range of natural hazards – earthquakes, tsunamis, wildfires, floods, landslides, severe weather, winter storms, tropical cyclones, and volcanoes – plus manmade events such as oil spills and industrial accidents.