T-22: Watching Levels of Sulfur Dioxide Pollution Drop

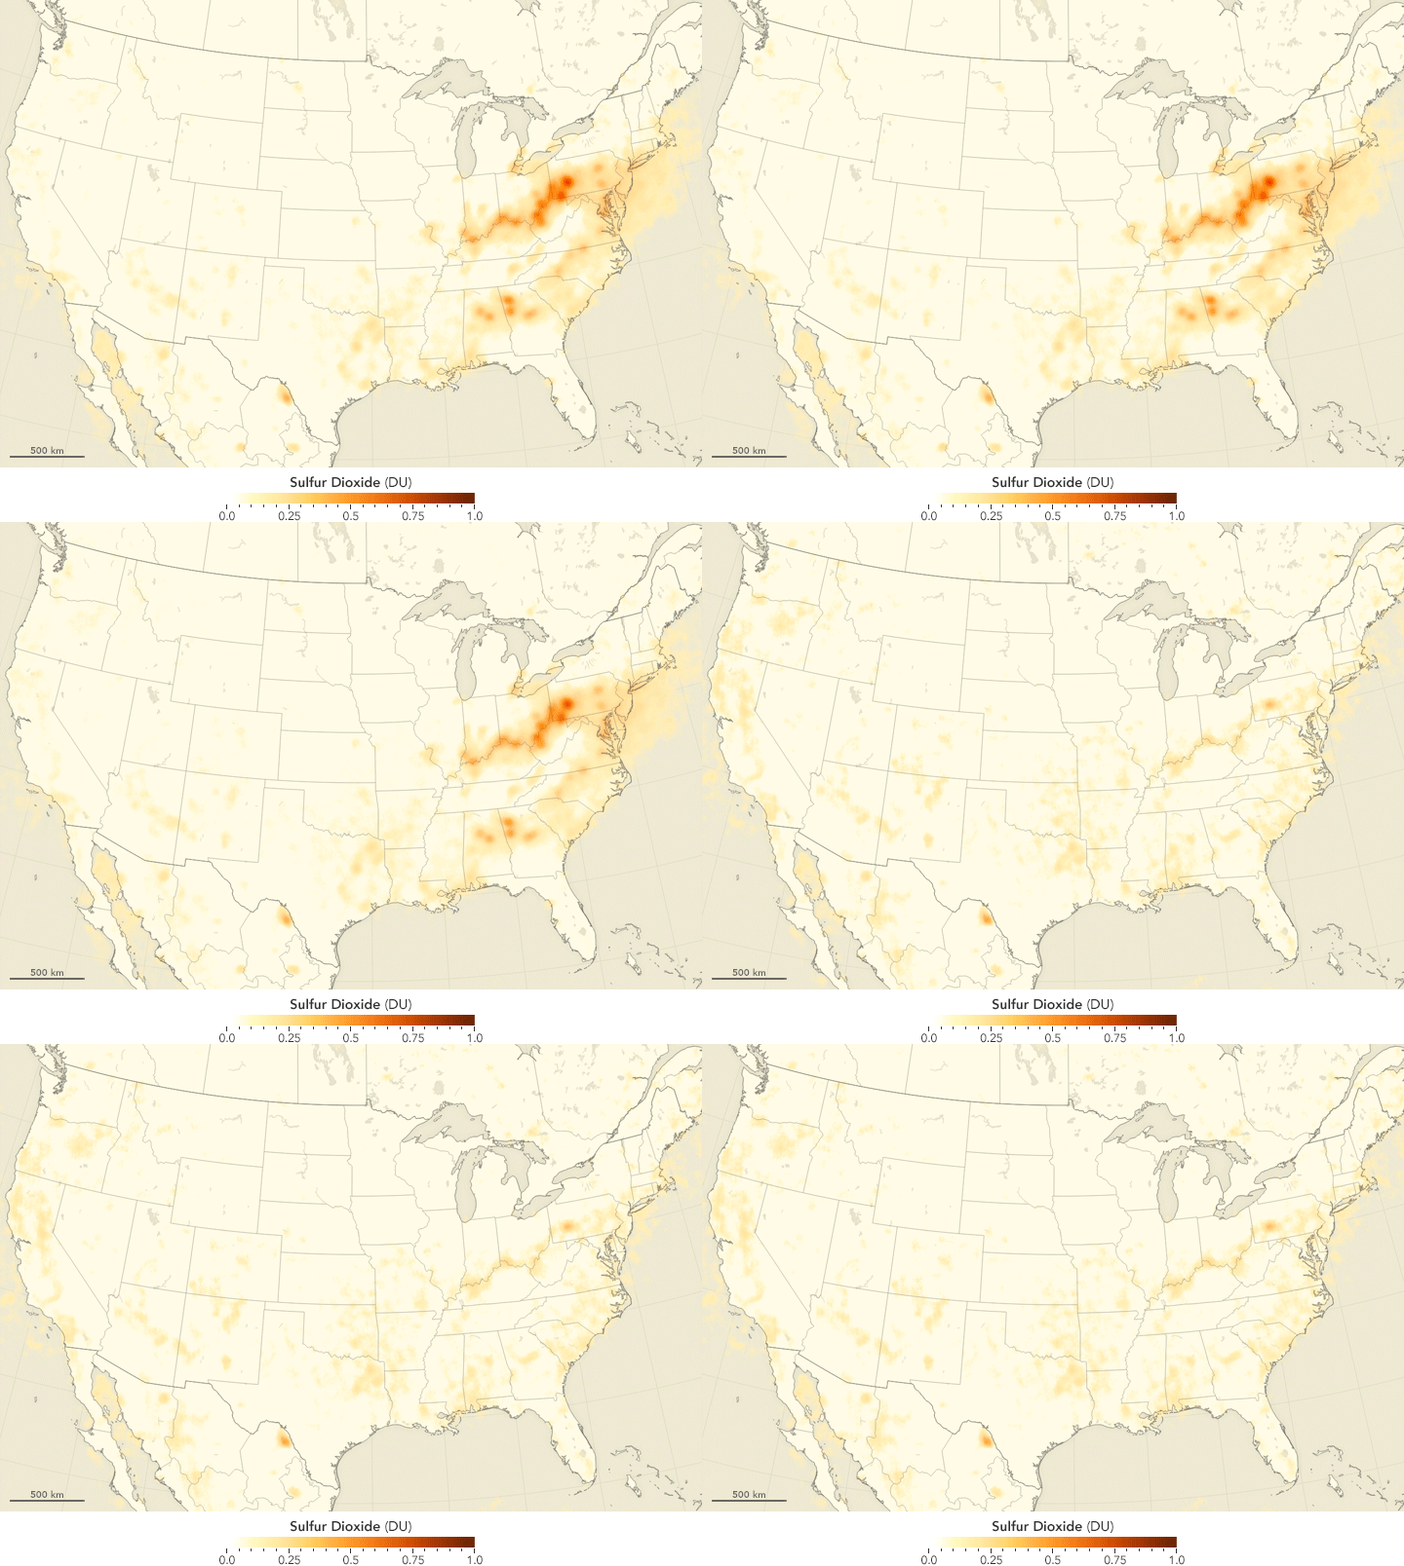
Here’s a breath of fresh air: In the United States, levels of the toxic air pollutant sulfur dioxide have fallen by 90% since 1980, according to Environmental Protection Agency data from ground-based sensors.

Sensors on satellites, including the Ozone Monitoring Instrument on NASA’s Aura satellite, have also observed the trend. The maps depict multi-year averages of sulfur dioxide concentrations over the eastern United States. The first map shows the average for 2005–2007 in Dobson Units (DU), which is the concentration of a trace gas in a column of Earth’s atmosphere; the second map shows the average for 2011–2014.

Most of the improvement relates to coal-fired power plants and other industrial facilities installing flue gas desulfurization devices—or “scrubbers”—and switching from coal with high-sulfur to lower-sulfur content.
NASA logo with the blue circle replaced with EarthIn addition to harming human health, sulfur dioxide affects the environment by reacting with water vapor to produce acid rain. From space, NASA satellites can help monitor air quality.

T-23: Measuring Earth’s Power Source

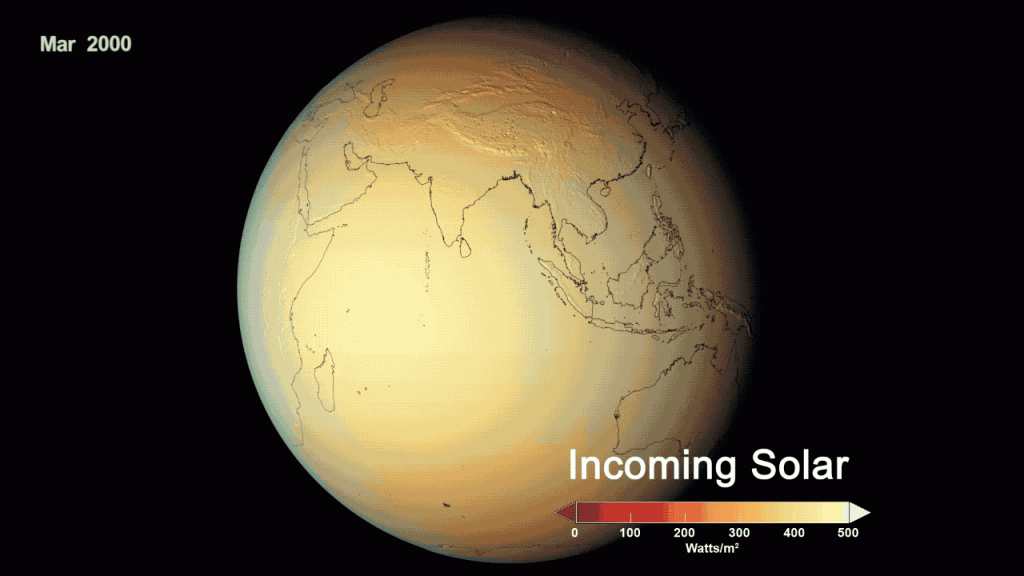
For more than 40 years, NASA has measured Earth’s energy budget with global, direct observations of solar radiation entering and exiting Earth.

Earth’s energy budget is a metaphor for the delicate equilibrium between the Sun’s incoming energy and the energy that’s radiated back into space. Continuous, stable and accurate data records over multiple decades are critical to understanding Earth’s energy balance.

Reflected solar and emitted thermal infrared radiation measured from NASA’s Clouds and the Earth’s Radiant Energy System (CERES) instruments and incoming solar radiation measured from NASA’s Total and Spectral Solar Irradiance Sensor (TSIS)-1 show gains (red) and losses (blue) of energy.

NASA logo with the blue circle replaced with Earth

The data collected improve models that provide seasonal and longer-term forecasts, which inform industry and policy makers to better plan for the future.

T-24: Everyone (Even You) Can Use Satellite Data

NASA has an entire fleet of satellites collecting data around our planet. That data doesn’t stay just with. You can download and use it!

You can learn how to use NASA data through the Applied Remote Sensing Training (ARSET) program. It helps people build skills that integrate all these Earth science data into their decision making.

During an ARSET training, you’ll learn how to use data from a variety of Earth-observing satellites and instruments.

Trainings are held online and in person around the world and are offered in air quality, climate, disaster, health, land, water resources and wildfire management.

For example, if you’re trying to track how much fresh drinking water is available in your watershed, you can learn how to find satellite data on precipitation or things like soil moisture and water quality.

NASA logo with the blue circle replaced with EarthAnd best yet, all NASA Earth observing data is open and freely available to the whole world!

T-25: Taking Earth Science to the Skies

What do snowstorms, sinking coastlines, wildfires and many other processes affecting life on Earth have in common? We can use airplanes to study them!

NASA’s Airborne Science Program uses unique aircraft fitted with sensors to conduct observations and collect in-atmosphere data, as well as advance the use of satellite data that benefit the Earth science community. Our fleet is often used to test remote sensing instruments before they become part of a satellite or to verify measurements from a satellite once it’s in orbit.

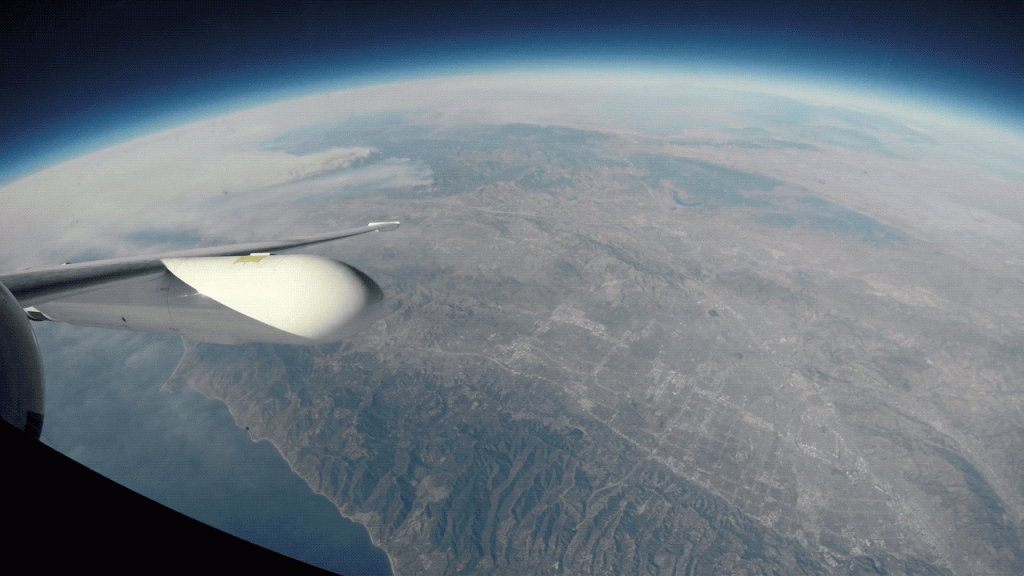
This year, we’re kicking off a number of new airborne science campaigns across the United States, joining our existing missions. So far this year, planes have flown along the Eastern Seaboard, studying snow in intense snowstorms and the tiny particles in the air that create clouds and produce rain.

NASA logo with the blue circle replaced with EarthLearn about our latest airborne science campaigns: https://go.nasa.gov/2wico8F

T-26: Snow from the Ground and Space

Snow is vital for Earth’s ecosystems and humans. It regulates temperature by reflecting sunlight and acts as insulation. When it melts in the springtime, it produces life-giving water. Snow provides freshwater for drinking, agriculture and hydropower for about one billion people worldwide. In order to dig deeper into snow, NASA and its partners teamed up for SnowEx, a field campaign in the western United States that takes coordinated measurements on the ground and in the air to compare how well different instruments work in different conditions.

Now, the team is expanding: Researchers are looking at snow depth and how the different physical properties of snow affect the snow water equivalent (SWE), or the amount of liquid water in a snowpack. Using measurements from ICESat-2 in space, SnowEx researchers are looking at snow depth in some of the study regions to see how the data compares at larger scales.

This is a “photon cloud.” Each dot in the figure represents the latitude, longitude, and height of a photon detected by ICESat-2. The thick line through the middle of the figure is composed of thousands of individual photons reflected off the Earth’s surface, while the dots above and below the surface are background photons from the sun.

T-27: Seeing Sea Ice

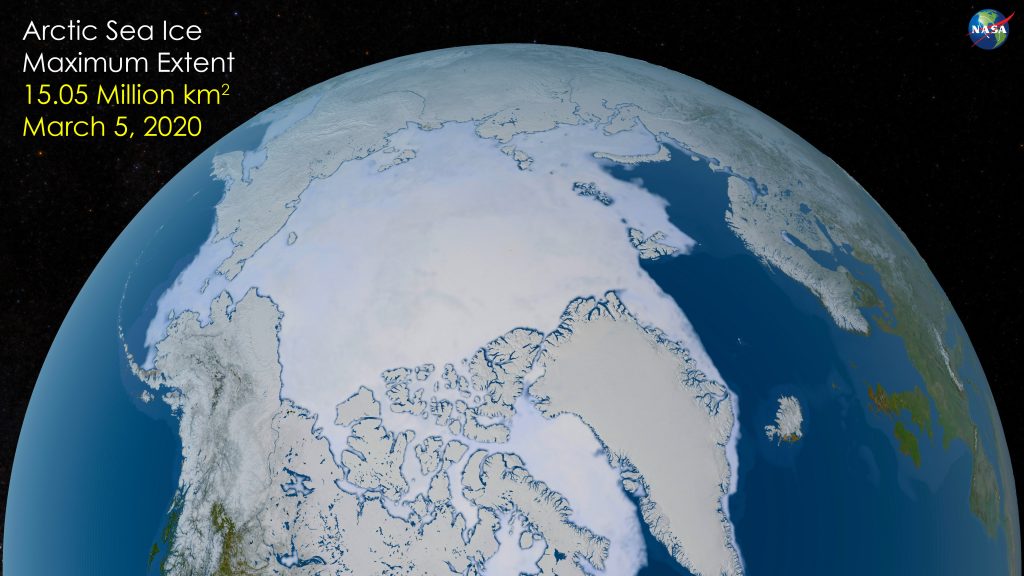
Every year, NASA and the National Snow and Ice Data Center work together to track Arctic sea ice as it grows and melts with the seasons, reaching an annual maximum extent at the end of winter.

This year, Arctic sea ice reached its annual maximum extent on March 5. Regional temperatures in the Arctic were relatively cooler, which led to a larger extent than in recent winters. However, at 5.81 million square miles, this year’s extent continued a long-term trend of shrinking sea ice.

Sea ice plays an important role in regulating Earth’s climate. The light color of the ice reflects sunlight back into space more effectively than the darker ocean. NASA’s record of sea ice extent stretches back more than 40 years, which helps us track changes over the long term to understand how our planet will continue to change as it warms.

T-28: Earth at Night

In satellite imagery, Earth has sometimes been called a “blue marble.” When lit by sunlight, our planet’s watery surface shines blue. On the nightside of Earth, things look different. Using satellite imagery and computer algorithms, NASA’s Black Marble lets us see Earth as illuminated by the lights of humanity.

These images of Earth at Night are beautiful, but studying electric lights from space also has some important applications. We can watch cities grow, see populations change, and, during natural disasters, track where power has been lost.

NASA logo with the blue circle replaced with EarthAfter Hurricane Maria, lights in Puerto Rico went out, making it possible to identify where the power grid was still functioning and determine which regions were affected the most. NASA researchers were able to use this data to literally watch the lights switch back on, highlighting areas where resources were being restored and areas that still needed help.

T-29: 20 Years of Precipitation from Space

For two decades, NASA has had a global view of precipitation from space. Using measurements from the Tropical Rainfall Measuring Mission and the Global Precipitation Measurement mission – a joint effort with the Japan Aerospace Exploration Agency (JAXA) – a computer model creates a four-dimensional view of rain, snow, sleet and storms.

This computer algorithm creates a view of global precipitation every half-hour, which is useful for time-sensitive work like weather forecasting and disaster recovery. It’s also used for water resource management.

NASA logo with the blue circle replaced with EarthIt’s not just for the short term, however. Having a long record of precipitation allows scientists to see patterns. We can track how precipitation changes across seasons and how a changing climate affects precipitation – giving us a baseline to understand extreme weather in the future.

T-30: Tracking Methane from Space

NASA’s new 3D picture of methane concentrations shows the second-largest contributor to greenhouse warming and its behavior throughout the atmosphere. Since the Industrial Revolution, atmospheric methane concentrations have more than doubled and are responsible for 20 to 30% of Earth’s rising temperatures to date. Methane’s sources include fossil fuel activities, primarily from coal, oil and gas sectors, the ocean, flooded soils in vegetated wetlands along rivers and lakes, agriculture, such as rice cultivation, and the stomachs of ruminant livestock, including cattle.

Once methane emissions are lofted into the atmosphere, high-altitude winds can transport them far beyond its source. Knowing where atmospheric methane comes from helps us study it and better prepare for its effects on our warming climate.

NASA logo with the blue circle replaced with EarthCombining multiple data sets into a high-resolution computer model, researchers now have an additional tool for understanding this complex gas and its role in Earth’s carbon cycle, atmospheric composition, and climate system.

T-31: Space Tech Powers Wind Turbines

NASA has helped advance wind turbines in more ways than one, including what they’re made of, how they look and where they can operate.

Other ways NASA has worked to advanced wind turbines:

  • The space agency worked with industry to test a strong, lightweight composite material that allows wind turbines to be larger and more efficient.
  • Software NASA coded to optimize the designs of spaceships was used to design blades for wind turbines.
  • An energy solution NASA engineers considered for Mars led to a partnership, resulting in turbines capable of operating in harsh, remote environments like the South Pole.

NASA logo with the blue circle replaced with EarthSpace technology spinoffs continue to support the demand for clean energy such as wind power here on Earth.