T-11: Coloring Coral for Citizen Science

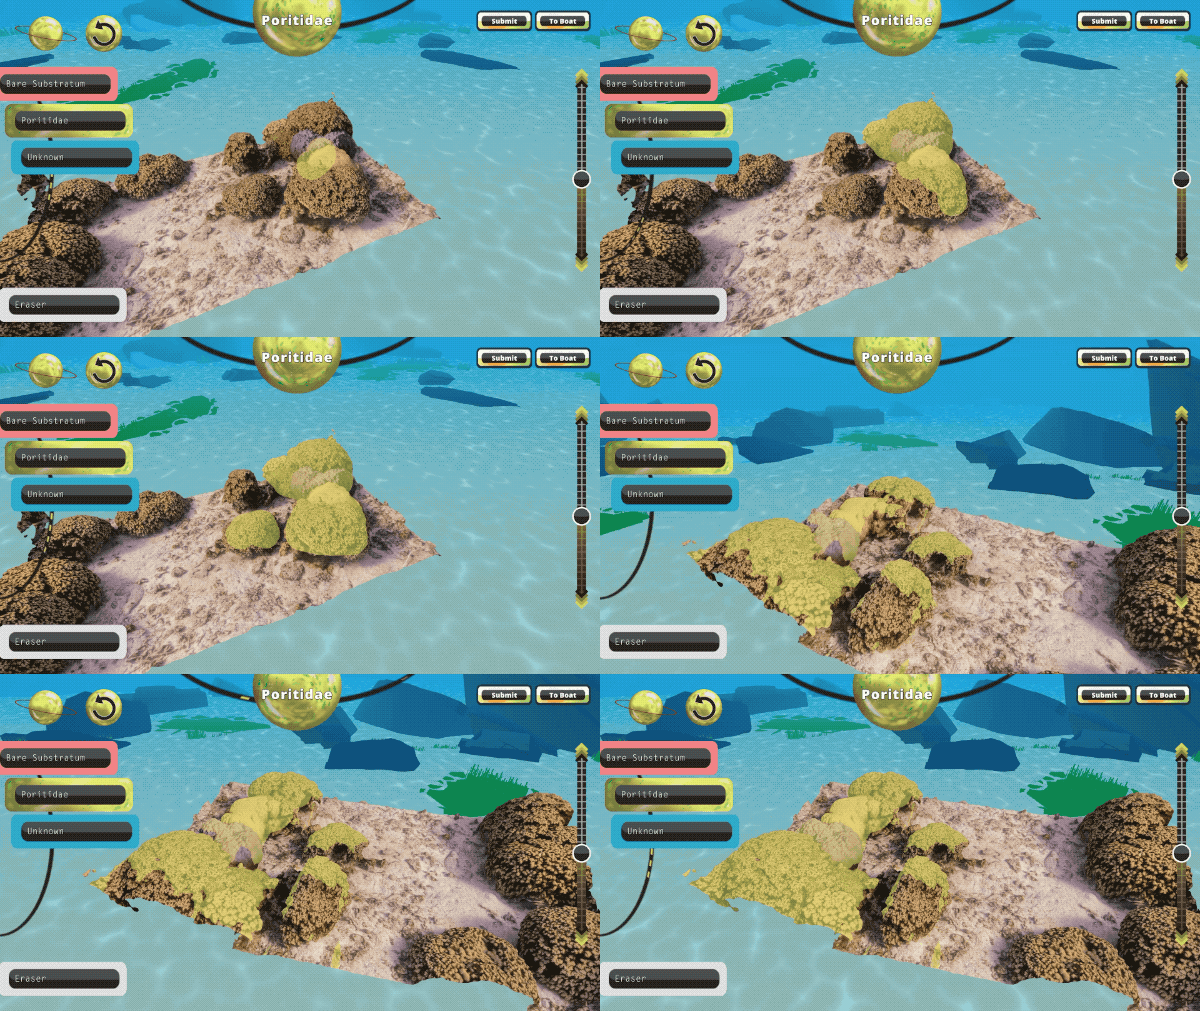
Want to help scientists study coral reefs all over the world without so much as getting your feet wet? Download NASA’s new NeMO-Net video game, in which players identify and classify images of coral that were imaged in 3D with instruments that can look below the ocean surface in more detail than had ever been possible.

Principal investigator Ved Chirayath at NASA Ames Research Center developed the neural network behind the game, which, as users play, helps train NASA’s Pleiades supercomputer at Ames to recognize corals from any image of the ocean floor using machine learning techniques.

Travel the ocean virtually on the research vessel the Nautilus and learn about the different kinds of corals that lie on the shallow ocean floor while highlighting where they appear in the imagery. Aboard the virtual research vessel, players will be able to track their progress, earn badges, read through the game’s field guide, and access educational videos about life on the sea floor.
NASA logo with the blue circle replaced with EarthNeMO-Net is available on the Apple App store and is playable on iOS devices and Mac computers, with a forthcoming release for Android systems.

T-12: 48 Years of Land from Space

As people celebrated the first Earth Day 50 years ago, NASA engineers and scientists were hard at work on a new remote sensing mission. While astronaut photos provided spectacular glimpses of our home planet in the vastness of space, and weather satellites showed clouds moving across oceans and continents, this new satellite would collect digital information on Earth’s surface at a much finer scale. It was called the Earth Resources Technology Satellite, or ERTS, and with it scientists could study forests, crop fields, urban areas and more – assuming they had the specialized, bulky devices needed to view an image.

NASA logo with the blue circle replaced with EarthERTS launched in 1972, and a few years later was given a new name that is much more familiar to today’s scientists, farmers, resource managers and urban planners: Landsat. The Landsat series of satellites has continued since then, providing a 48-year unbroken record of Earth’s land surface. The record will continue with the 2021 launch of Landsat 9, a joint mission between NASA and the U.S. Geological Survey.

T-13: Air Quality from Space

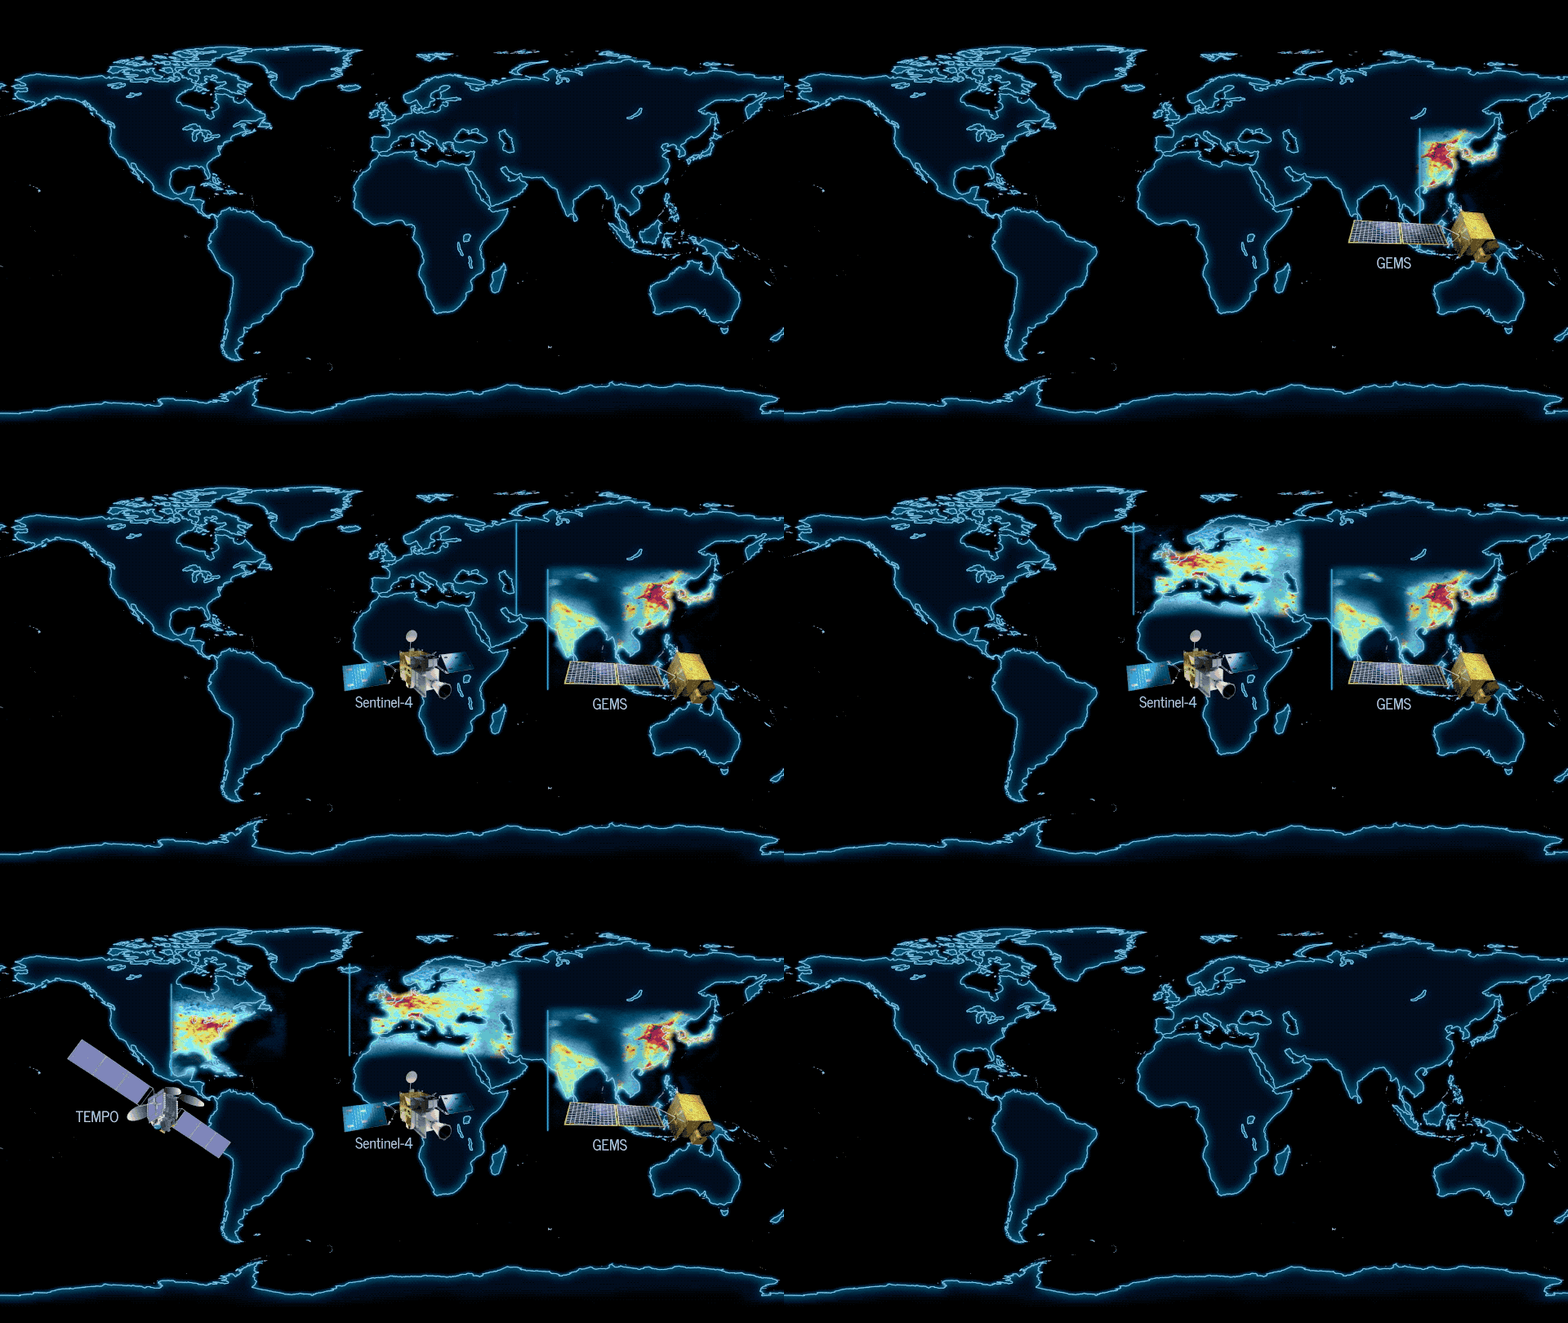
On Feb. 18 a new era began in an international effort to improve air quality science and forecasting around the world . The first of three instruments in a pioneering new space-based constellation launched from French Guiana to make hourly daytime measurements of several air pollutants.

South Korea’s Geostationary Environment Monitoring Spectrometer (GEMS) instrument rocketed into space on the Korean Aerospace Research Institute GEO-KOMPSAT-2B satellite. From a geostationary, or fixed, orbital location, GEMS will make measurements over Asia. NASA’s Tropospheric Emissions: Monitoring of Pollution (TEMPO), scheduled to launch in 2022, will make measurements over North America. To complete the constellation, the European Space Agency Sentinel-4 satellite, expected to launch in 2023, will make measurements over Europe and North Africa.

NASA logo with the blue circle replaced with EarthOnce complete, this air quality satellite “virtual constellation” will measure pollutants — including ozone, nitrogen dioxide, formaldehyde and tiny atmospheric particles called aerosols — in unprecedented detail and frequency. Air pollution can be damaging to the human respiratory and cardiovascular system and to the environment. Near-real-time data products from the constellation will significantly improve air quality forecasting around the most densely populated areas of the Northern Hemisphere. That data can also help inform decisions by policymakers to improve air quality.

T-14: Tournament Earth

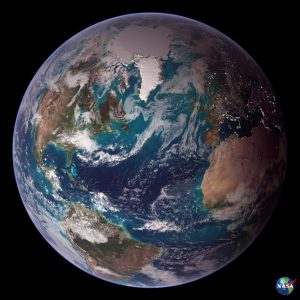
The view from space is out of this world…literally, especially when we’re looking back at Earth. We think all of NASA’s images of our home planet are spectacular, but everyone has their favorites. Now, we’re inviting you to help narrow down your favorite images, for Tournament Earth.

Combining NASA’s various satellite views of our home planet can make something really spectacular, like these Blue Marbles, with more than six different data sets combined into two gorgeous images.
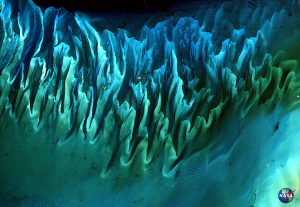
In the Bahamas, tides and ocean currents sculpted sand and seaweed beds into these stunning multicolored, fluted patterns.
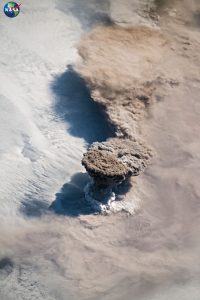
We can even see volcanic eruptions from space! Astronauts have a front-row view of our planet and how it changes from day to day, like this incredible image of Raikoke Volcano erupting.
Now, go vote!

T-15: Tracking Amazon Deforestation from Above

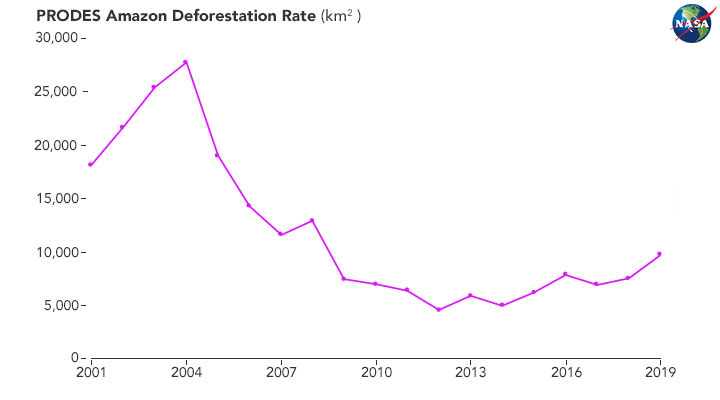
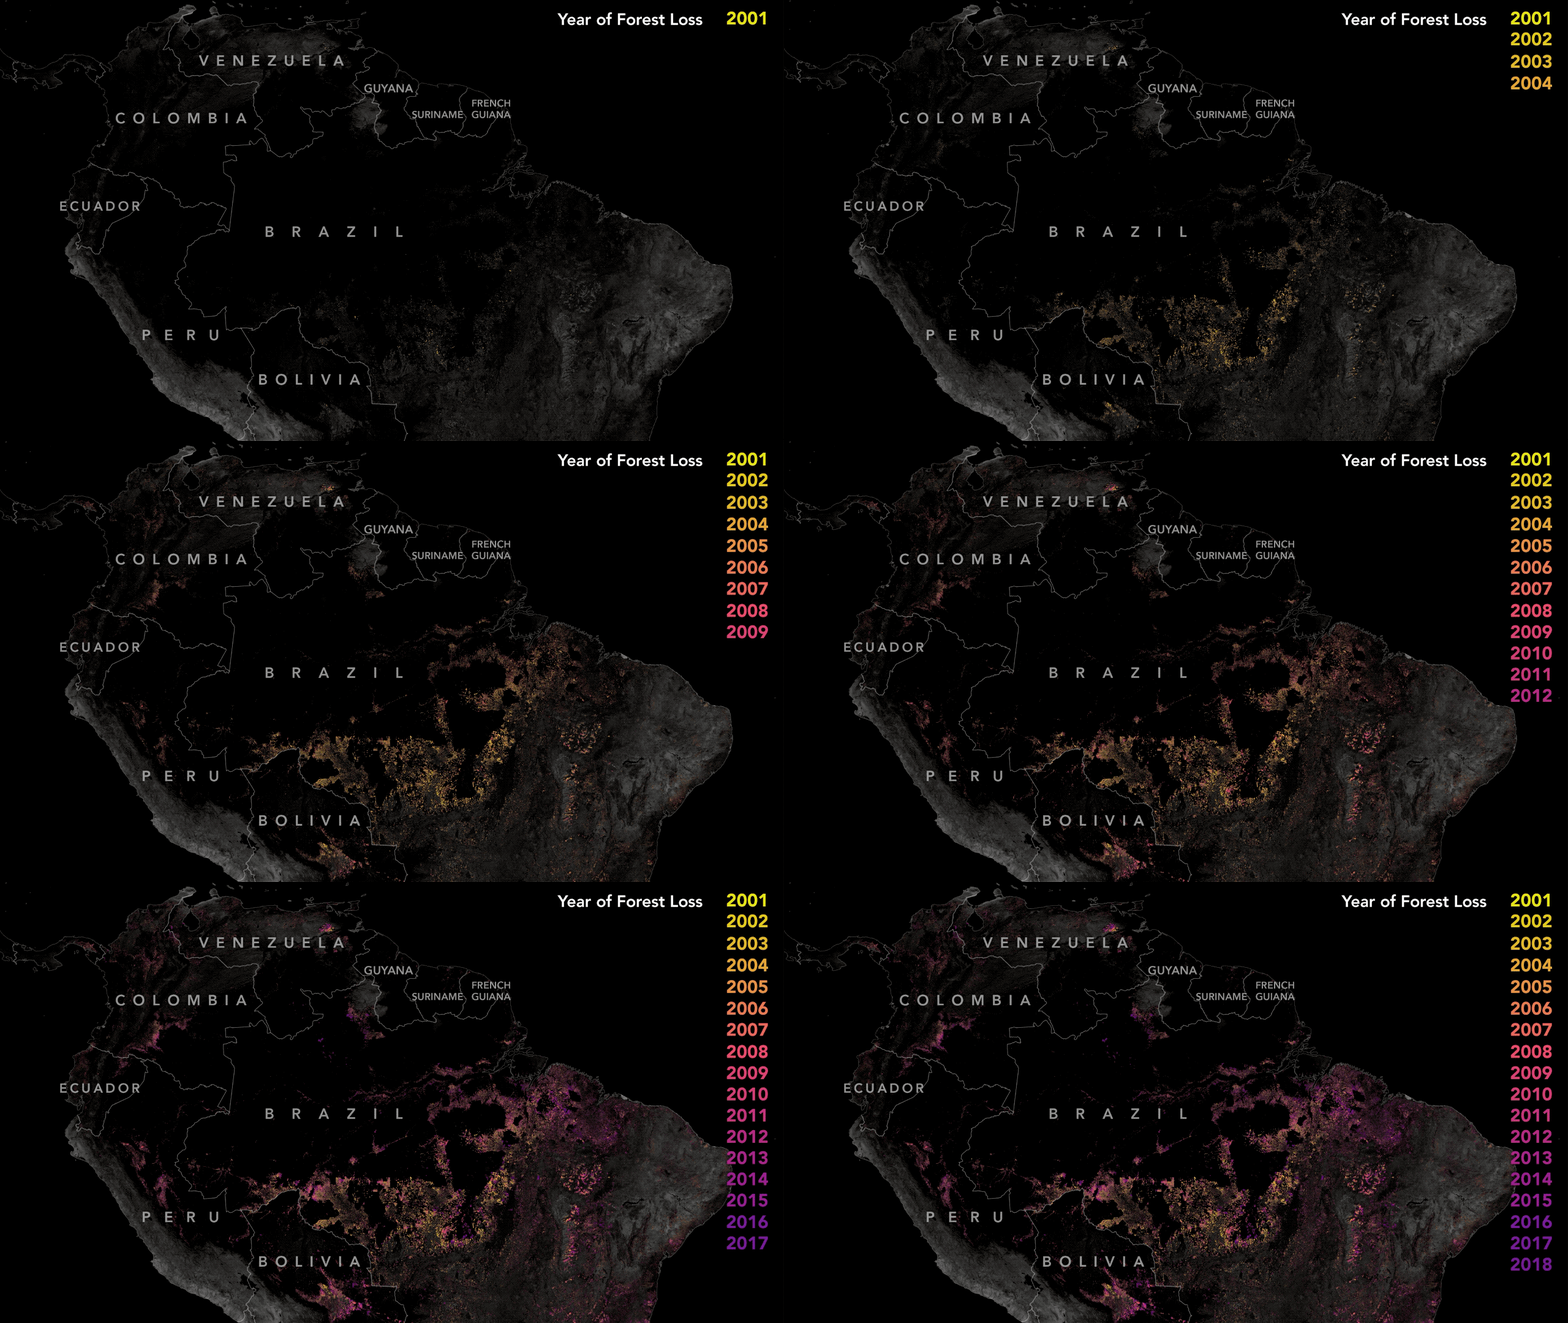
In the early 2000s, the Brazilian rainforest was losing more than 8,000 square miles per year, an area nearly the size of New Jersey. But beginning in 2004, following several years of particularly rapid deforestation, the tide abruptly turned. Within a few years of adopting aggressive new environmental regulations, large-scale deforestation dropped by roughly 50 percent. By 2012, forest clearing was down nearly 80 percent.

Strengthened satellite-based forest monitoring systems played a key role in the turnaround, explained Raoni Rajão, an expert in environmental policy at Federal University of Minas Gerais. For several years, Brazilian government scientists had tracked deforestation with a system based on Landsat data called PRODES, but the data was mostly kept within government labs and agencies.

In 2002, with public outrage about deforestation growing, INPE began posting the full dataset online, complete with deforestation maps for all of the Brazilian rainforest. “That move toward transparency and accountability proved crucial because it made it possible for the science community, NGOs, and the public to engage,” said Rajão.

Read more about how satellites track Amazon deforestation here.

T-16: Earth’s Ice from the Air

NASA’s airborne researchers travel to some of the most remote places on the planet. For eleven years from 2009 through 2019, the planes of NASA’s Operation IceBridge flew above the Arctic, Antarctic and Alaska, gathering data on the height, depth, thickness, flow and change of sea ice, glaciers and ice sheets.

During that time, IceBridge gave us new and unprecedented understanding of how our planet is changing with the climate. Designed to “bridge the gap” between the original Ice, Cloud and land Elevation Satellite (ICESat) and ICESat-2, IceBridge helped map the bedrock of Greenland and Antarctica and spotted massive rifts in the Antarctic Ice Sheet, both of which help us better understand future sea level rise.

NASA logo with the blue circle replaced with EarthThe mission wrapped up last year but scientists are still uncovering new things in the data collected by Operation IceBridge.

T-17: Chemistry in the Atmosphere

Air pollution can appear as a gray or orange haze enveloping a city. What the naked eye can’t see are the hundreds of chemical reactions taking place to produce that pollution. NASA science can reveal a more complete picture of atmospheric chemistry.

A NASA visualization shows 96 chemical species that help form one common air pollutant — surface ozone. Capturing such complexity requires satellites, a sophisticated computer model and a supercomputer all working in concert.

Satellites observe chemical species in the atmosphere, both those emitted from natural and human sources and those formed from other pollutants. Yet, even several hundred thousand observations a day leave data gaps. Merging satellite data with NASA’s computer model yields not only a snapshot of chemistry throughout the atmosphere at any given time but also the ability to predict air quality worldwide.

NASA logo with the blue circle replaced with EarthThis model makes a 5-day forecast daily using the NASA Center for Climate Simulation’s Discover supercomputer. To further help policymakers, NASA scientists are working with city partners on providing customized air quality forecasts and with New York University and UNICEF to refine an air quality health index for children with asthma.

T-18: Mapping Songbird Diversity

New Hampshire hosts nearly 200 species of songbirds, but quieter forests are concerning conservationists as populations and diversity of the musical species decrease. NASA satellite data helped map the changing forest landscape, better equipping land managers to react to effects of forest fragmentation and changing songbird populations.

Forest fragmentation and habitat loss from stressors like commercial development and climate change are leading threats to forest birds in the Northeast. Forest fragmentation occurs when a tree-filled habitat gets cut down into smaller patches, with open lands or human development in between.
NASA Earth Applied Sciences’ DEVELOP program used Earth observations to map the health and density of forest cover across New England, which the National Audubon Society incorporated into land conservation and management efforts. With strategic conservation, songbirds can continue singing the praises of New Hampshire for years to come.

T-19: Mapping Sunburn from Space

Skin cancer is the most common form of cancer in the United States. NASA helps public health officials track the primary cause of the disease: overexposure to ultraviolet radiation.

The NASA Earth Applied Sciences Program and the Centers for Disease Control and Prevention (CDC) created the first publicly available map of ultraviolet (UV) radiation for all counties in the contiguous United States. This animation shows the average amount of UV radiation per square meter reaching the surface in different parts of the country in 2015—like a “risk map” showing the likelihood of sunburn in an area. The UV data comes from the Ozone Monitoring Instrument on NASA’s Aura satellite, processed by researchers at Emory University and University of Iowa.

NASA logo with the blue circle replaced with EarthPublic health researchers can link the UV exposure indicator to skin cancer incidences. The dataset is available on the CDC’s National Environmental Public Health Tracking network.

T-20: Monitoring Drought from Space

Monitoring soil moisture and groundwater used in irrigation is essential for managing agricultural crops. But around the world, ground-based observations are too sparse to capture the full extent of wetness and dryness across the landscape.

NASA researchers have partnered with the University of Nebraska, which works with U.S. and international groups, to develop and distribute tools for monitoring drought from space. In 2020, NASA’s team began delivering new weekly, satellite-based global maps of soil moisture and groundwater and one- to three-month U.S. forecasts of dry/wet conditions.

NASA logo with the blue circle replaced with EarthThe maps use data from NASA and German Research Center for Geosciences’s Gravity Recovery and Climate Experiment Follow On (GRACE-FO) satellites, which detect water distribution on Earth based on variations in Earth’s gravity field. With the new global maps and U.S. forecasts, GRACE-FO data fill in key gaps for understanding the full picture of conditions that can lead to drought.