July 9, 2011
An advantage of being so well connected on the ship is the immediacy of acquiring the data. That quick connection guides the science and speeds up the analysis. It wasn’t always this way, however, so I asked a few scientists on board to share a story about how things used to be. What’s the most interesting change you’ve seen since you first started doing field work?
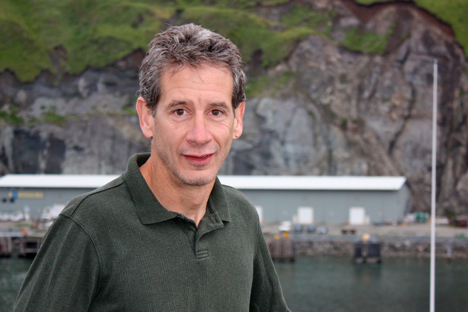
Greg Mitchell, Scripps Institution of Oceanography
Since I started graduate school in 1978 my intention was to study the optics of the ocean and how that relates to the ocean phytoplankton and primary production. That’s been my whole career. NASA’s Coastal Zone Color Scanner [which mapped phytoplankton pigment concentration] was flying when I started graduate school, and in fact I went on the first calibration/validation cruise. It was a fantastic first mission for ocean color, but that was very early days and the satellite wasn’t on all of the time. What we all wanted was a time to arrive when these satellites would support our ocean science, because from the ship, the ocean looks about the same. From the bow or the bridge look around and you’re like, “where’s that feature?”
We could map the ocean with salinity and temperature sensors and try to find features. For example, we knew about a phenomenon called warm-core rings, where warm Gulf Stream water breaks off and creates circular eddies that move in toward cool water of the U.S. East Coast.

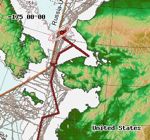
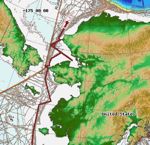
Eddies are apparent in satellite maps of sea surface temperature and phytoplankton concentration. Image is from “Phytoplankton Blooming Off the U.S. East Coast: A Satellite Description,” published in 1985 in Science.
From satellites, however, the features stood out like a huge target. Satellite measurements of sea surface temperature and phytoplankton concentration revealed big warm eddies, blue where the chlorophyll was low, trapped inside greener shelf water. A program was started called “Warm Core Rings” to go study these phenomenon, becoming one of the first projects to put physicists and biological oceanographers together on a big interdisciplinary project.
As with ICESCAPE, satellites showed scientists where to sample, and a ship mapped along a star pattern through the eddies. Without the satellite data, scientists wouldn’t have known where to map because if you’re standing on the bridge of a ship looking for a needle in the haystack, you can miss it completely. I remember going to San Antonio in 1984 for the American Society of Limnology and Oceanography conference, where the science presentations were stunning the oceanography community. My dream was always to have these satellites supporting our science, and there it was in living color.
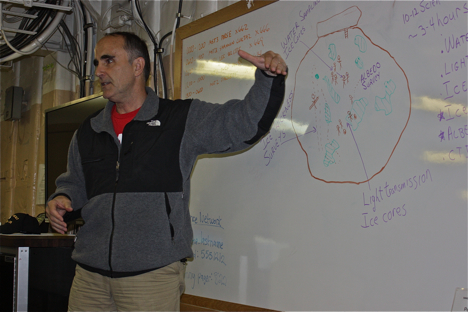
Don Perovich, Cold Regions Research and Engineering Laboratory
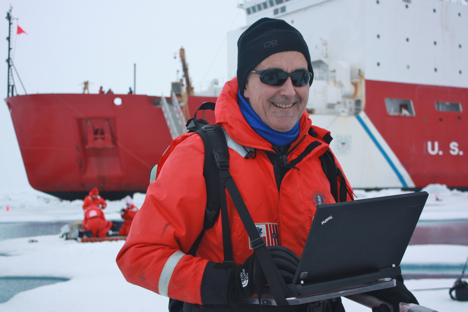
Scientists on the ICESCAPE mission can look at data almost in real time and make changes on the fly. That’s a luxury scientists didn’t always have. Credit: Kathryn Hansen/NASA
Doing Arctic field work over the past 30 years, I have seen a lot of ice and I have seen a lot of changes in the way experiments are done. Two things come to mind.
One is on a personal level. When you left port that was the last opportunity you had to contact your family or anyone back home. There were ways — ham radios and things — but basically you were gone until you got back. And now, just last night, my wife and I were almost instant messaging, sending e-mails back and forth.
The other thing is the accessibility to data. It used to be you went out in the field, you made your measurements, and in order to reduce those measurements you needed mainframe computers. So, you wouldn’t know about the quality of your data until you got home. That had two impacts. One, you never really knew if things were working, and two, you couldn’t adapt your experiment on the fly. One of the things we’ve been able to do in this experiment is look at data almost in real time and if we see something interesting, we can spend more time on it.
Another thing is the accessibility to satellite information. On the Healy they have an application called map surfer which accesses all of the available satellite data. You can look at an image from passive microwave, active microwave or visible satellites and see what the satellites saw just hours before.
In contrast I was on an experiment back in the 1980s working on ground truth for remote sensing, back when they were still trying to figure out what those remote signals meant. An aircraft would fly above with an instrument package collecting measurements and creating a map in microwave. To transfer the data, the aircraft would then make a low pass over the ship and throw the map out of a hole in the plane. We would go collect it, look at it, and then we’d pick our science sites. You don’t see much of that anymore.


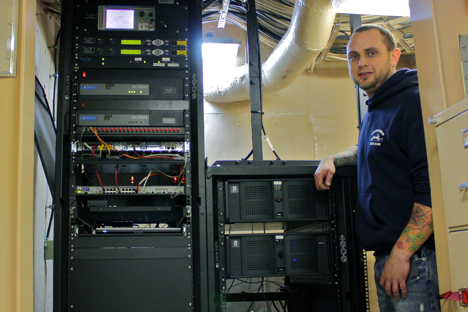
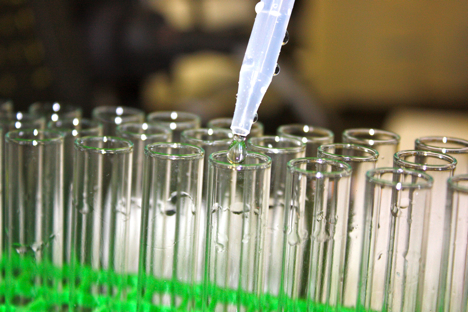
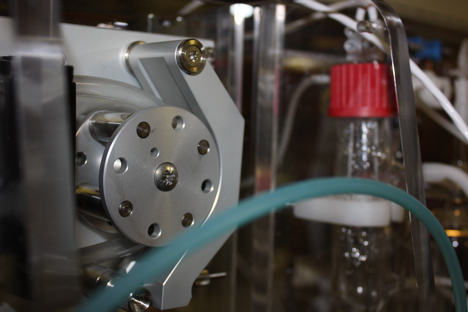
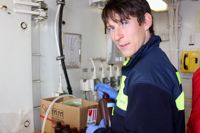
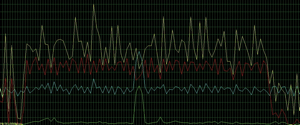 Graham also keeps watch over the bandwidth, which is metered (right) to ensure uninterrupted operation.

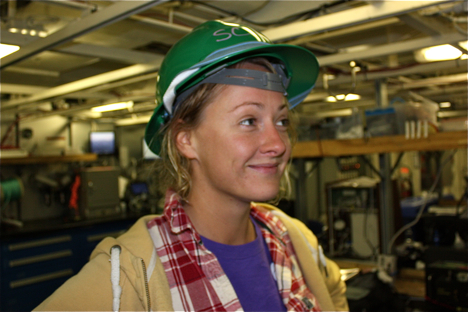
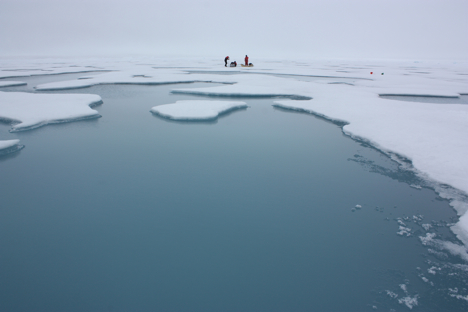
 “After our extreme hotspot finding last year we’ve come back and its still seems to be a productive zone but much less than last year,” said Zach Brown, of Stanford University (right). “My guess is that what we’re seeing is due to a combination of factors.”