New Blogger Bio – Tristan Hall for SEAC4RS

This post and its photo is provided by Tristan Hall, a student from Florida State University on the Studies of Emissions and Atmospheric Composition, Clouds and Climate Coupling by Regional Surveys (SEAC4RS) airborne science mission.

Born and raised in northwest Ohio in a little town called Genoa, my first recollection of wanting to be a meteorologist was when my elementary school guidance counselor asked me what I wanted to be when I grew up. I chose the natural response that a child does – leaning toward the heroic profession of doctor – but my second and more enthusiastic response was “tornado chaser”. What second grader chooses storm chasing as their profession? Well, my guidance counselor thought the same evidently, because she laughed at me. It’s funny how some experiences really stick with you.

After receiving degrees in physics and geography from Appalachian State University (go Mountaineers!) with concentrations in atmospheric processes, I am now a Master’s student in meteorology at The Florida State University, conducting research under Dr. Henry Fuelberg. My focus is on pollution transport via mesoscale influences and deep convection in the Strait of Malacca. I’ve been storm chasing once and caught a tornado near Fairview, OK. I love everything weather, and am a major sucker for nature shows. Sitting and staring at the sky is one of my favorite things to do (and then looking at the most recent satellite and radar scans to confirm what I’ve seen). How does a meteorologist know if it’s raining outside their house? They look at the radar. I live with my girlfriend (the love of my life), Catherine, who is a brilliant PhD student in musicology, and our cat Felix T.C. Mendelssohn Williams-Hall, who is a professional nap-taker. After my Master’s, I plan to move on to the big leagues of academia and get my PhD, as well. After we’re both complete, we’ll have a household of doctors: BEWARE!

I am beyond excited to be part of the meteorology forecasting team here at SEAC4RS. We are responsible for forecasting the meteorology for the science flights and reporting our information in daily briefings, and nowcasting during flights to help direct planes in and out of convection. This is truly a once in a lifetime experience, and I am very grateful to my professor for allowing me to be a part of this adventure!

Above the Clouds

This post was provided by Nick Heath, a student from Florida State University on the Studies of Emissions and Atmospheric Composition, Clouds and Climate Coupling by Regional Surveys (SEAC4RS) airborne science mission.

Today’s blog comes from above the clouds, high in the atmosphere in which we live…the one SEAC4RS hopes to better understand.  I’m flying home for a week.  Speaking of flying, these first 20 days also have flown by, and I can’t wait to get back to Houston for 30 more.  As a graduate student who spends most of his time reading peer-reviewed articles and writing computer code, SEAC4RS has provided me a humbling and rewarding experience thus far.  I gave my first weather briefing, led a morning pre-flight brief, and contributed as much as possible whenever I could.  SEAC4RS also has taught me the importance of urgency.  Us scientists (and humans for that matter) always like to be prepared.  We like to plan ahead.  Unfortunately, with weather forecasting, there is no planning ahead (I know that sounds contradictory!).  Things are always changing; so to provide the best forecast, you have to wait for the latest data.  This means that you are forced to procrastinate.  Then, like the people waiting for their boarding zone to be called, there is a huge “rush to the gate.”  But, I’ve found that this isn’t always a bad thing.  Sometimes urgency brings out the best in everyone.  You become much more efficient, you work as a unit, and you learn what works and what doesn’t.  Think of a wild animal out on a hunt: they wait and wait until an opportunity presents itself…they then exhaust an extreme amount of energy in a very short period…followed by relaxation and the reward of having their next meal.  Our process is not all that different…we “pounce” on the latest data, exhaust a lot of energy into our briefing, and then get to relax and let the feeling of “a job well done” soak in…very primal of us! In short, I have learned that procrastination is not always a bad thing, and may in fact be beneficial in some cases…(but not for school work, of course!).

As for the status of SEAC4RS, things are going great!  We flew into some smoke a few days ago, and then spent the all of Friday in the southeast U.S. examining chemistry, radiation, and convective clouds.  Next on the agenda is what we call a suitcase flight: the DC-8 will travel into the northwest U.S., stay the night, and fly back the next day.  This allows a lot more time to study the region.  While in the northwest, we will be studying smoke from wildfires occurring in both California and Idaho.  These fires have been a hot topic in the news lately, and SEAC4RS aims to understand their impacts on the large scale.

Lastly, as I am flying, the plane just encountered some “rough air” at 36,000 ft.  Next time you are flying, and experience turbulence, and get that strange feeling in your stomach, think of SEAC4RS.  These scientists are chasing rough air, flying around storms, putting their life in danger, for the hopes of better understanding the processes that affect our world.  Not your typical scientists, that’s for sure.

The view I had while writing this blog.  Not a bad way to “work.” (Photo credit to Nick Heath)
The view I had while writing this blog. Not a bad way to “work.” (Photo credit to Nick Heath)

Unforecasted Fun!

This post was provided by Nick Heath, a student from Florida State University on the Studies of Emissions and Atmospheric Composition, Clouds and Climate Coupling by Regional Surveys (SEAC4RS) airborne science mission.

The science flight on Friday, August 16th was a big success.  What’s more, a member of the met team was selected to fly at the last minute.  Lesson learned: always be prepared!  Sean Freeman, an undergraduate meteorology and computer science major at Florida State University, put his name on the list as a potential “flyer.”  Unfortunately, he found out bad news on Thursday: the manifest was full…he would not be flying on the DC-8.  Then, early Friday morning, he received a call that a spot opened up…he now was on the list!  I rushed him to Ellington, he received his safety brief, and he was off to experience airborne science first hand.

The goal of Friday’s science flight was to examine the North American Monsoon.  In general, a monsoon is a seasonal reversal of the wind pattern.  During the summer, this comes about because land (e.g., the North American continent) heats up a lot more than the surrounding waters, thus creating a large-scale temperature gradient.  Elevated terrain, such as the mountainous regions of Mexico and the western U.S., enhance this process.  The net result is a lot of thunderstorms over the continents, which transport pollution into the upper levels of the troposphere.  Once there, the pollution has the potential to impact climate on a global scale.  So, understanding this phenomenon is very important to understanding our climate.

The planes took off at ~10 AM CDT.  They headed west along the U.S./Mexico border, sampling aged outflow from thunderstorms associated with the monsoon.  They then turned northeast, and headed toward Colorado.  On their way to Colorado, they passed over the large Four Corners power plant, and were able to sample its “pollution plume.”  Once over Colorado, they encountered a smoke plume from wildfires.  The flight scientists took advantage of this situation and sampled the smoke plume.  The DC-8 flew legs through the smoke, while the ER-2 got remote sensing data from above.

Storms were beginning to pop up around Houston; so the ER-2 headed home to beat them.  The DC-8 headed home, but did some more science on its way back.  Over Texas, it descended close to the surface to sample air from a large oil field.  As the DC-8 got closer to Ellington, a large cluster of thunderstorms decided to pop up and race them home!  Met team member Sean Freeman was lucky enough to ride in the cockpit for landing, so he saw these storms up-close and personal.  A few commercial airlines even had to make emergency landings at Ellington to avoid these storms.  The DC-8 landed just before the rain and lightning reached Ellington…success (well kinda, the storm was not forecast by the met team, so no success for us!).

Below are some great images Sean provided from his trip on the DC-8.  Overall, this flight was a great success and accomplished many of the science objectives of SEAC4RS!

Flight tracks for the DC-8 (blue) and ER-2 (red) for 16 August 2013. (Photo credit to Brian Toon)
Flight tracks for the DC-8 (blue) and ER-2 (red) for 16 August 2013. (Image credit: Brian Toon)
Not your typical airplane!  The DC-8 truly is a flying laboratory.  Here, the scientists are all busy operating their instruments during the flight on 16 August.  (Photo credit to Sean Freeman)
Not your typical airplane! The DC-8 truly is a flying laboratory. Here, the scientists are all busy operating their instruments during the flight on 16 August. (Image credit: Sean Freeman)
The power plant that was sampled as the planes headed toward Colorado, as seen from the DC-8. (Photo credit to Sean Freeman)
The power plant that was sampled as the planes headed toward Colorado, as seen from the DC-8. (Image credit: Sean Freeman)
Cloud tops of the large thunderstorms that the DC-8 was “racing” home.  This unpredicted cluster of storms caused a lot of problems for air traffic in the Houston area. (Photo credit to Sean Freeman)
Cloud tops of the large thunderstorms that the DC-8 was “racing” home. This unpredicted cluster of storms caused a lot of problems for air traffic in the Houston area. (Image credit: Sean Freeman)
A view you probably won’t see too often…in front is the NASA shuttle carrier aircraft, a Boeing 747.  Behind that, sits a commercial aircraft that made an emergency landing at Ellington.  Not a bad view for the passengers on that plane!  (Photo credit to Sean Freeman)
A view you probably won’t see too often…in front is the NASA shuttle carrier aircraft, a Boeing 747. Behind that, sits a commercial aircraft that made an emergency landing at Ellington. Not a bad view for the passengers on that plane! (Image credit: Sean Freeman)


Icebreaker Team deploys to Haughton Crater

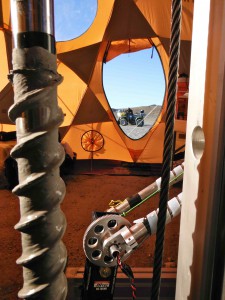
For the past decade a series of Science Mission Directorate (SMD)-funded projects have advanced the technology readiness of both Mars-prototype drills and the automation needed to operate them at significant lightspeed communication-lag distances from Earth. Drilling will be needed to access the Martian subsurface at depths of 1 meter or greater, and to penetrate the ice layers found by the Phoenix mission at the poles. It is the best means to retrieve samples from regions on Mars that could possibly harbor life now or in the past, and is a core sample acquisition technology for multiple mission concepts. A photograph shows both the Icebreaker-1 rotary-percussive drill and its sample transfer arm, in the context of July 2012 Arctic tests at Haughton Crater. The Deployable Automation Technologies (DAT) group at NASA Ames with Honeybee Robotics conducted sample acquisition and drilling automation field tests with Icebreaker-1 in July 2012 (Haughton Crater) and January 2013 (University Valley, Antarctica).

The Icebreaker-1 rotary-percussive Mars-prototype drill with its sample-transfer arm, in July 2012 tests at Haughton Crater's Drill Hill.
The Icebreaker-1 rotary-percussive Mars-prototype drill with its sample-transfer arm, in July 2012 tests at Haughton Crater’s Drill Hill.

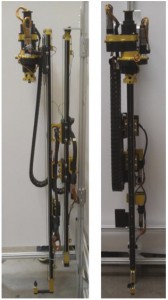
The current GETGAMM project (led by PI Lisa Pratt at Indiana University, with GSFC, JPL, and Honeybee Robotics) uses deeply eroded Paleoproterozoic bedrock in southwestern Greenland as an analogue for Mars. In a three-year field campaign, the project analyzes seasonal and diurnal variation in the concentration and isotopic composition of methane, ethane, and hydrogen sulfide in bedrock boreholes. See http://www.indiana.edu/~geosci/pratt/getgamm/index.html . GETGAMM is using the Icebreaker-2/LITA drill to drill arrays of 1-2m boreholes for gas monitoring. The Icebreaker-2 drill itself is derived from the Honeybee Robotics Icebreaker-1 drill, but uses a lighter frame with smaller motors to reduce fielded mass from 32kg (Icebreaker-1) to 9.6kg (Icebreaker-2/LITA).

The Life In The Atacama (LITA) or Icebreaker-2 drill is a smaller, lighter 10kg Mars-prototype drill derived from the 33kg Icebreaker-1 rotary-percussive drill system.

Since an Icebreaker-2 drill was already built and would already be available in the Arctic this summer, the DAT group at Ames proposed to use it for other tests after GETGAMM concluded its season in mid-July. “This allows us to cheaply and quickly get additional baseline drill performance data at a common analog site (Haughton Crater) at a fraction of the cost of a dedicated field test,” said Dr. Brian Glass, DAT group lead at Ames. This data will be invaluable for future study, development of drill fault detection and automation software, and for comparison to other prototype drill baselines (for future Mars sample acquisition mission design and trade studies).
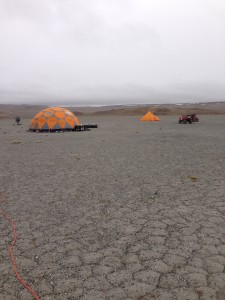
After receiving approval of this opportunistic proposal from SMD, the DAT group and Honeybee have put together over two months a field deployment of Icebreaker-2 to test at Haughton. A group of three left California on Friday, August 9, arrived at Resolute on August 10 and arrived at Haughton Crater on Devon Island on August 12. They are currently testing the latest Icebreaker-2 model at the same “Drill Hill” site as was used to test three earlier drills in 2004-12: DAME, CRUX and Icebreaker-1. In collaboration with the GETGAMM project, the Icebreaker team will also sink several gas-sampling shafts and gather samples for GETGAMM’s use from Devon Island, supplementing the Greenland data.

The Icebreaker team's drill test camp, set up in August 2013 at "Drill Hill", a massive impact breccia deposit within Haughton Crater.
The Icebreaker team’s drill test camp, set up in August 2013 at “Drill Hill”, a massive impact breccia deposit within Haughton Crater.

First Science Flight for SEAC4RS!

This post and photos were provided by Nick Heath, a student from Florida State University on the Studies of Emissions and Atmospheric Composition, Clouds and Climate Coupling by Regional Surveys (SEAC4RS) airborne science mission.

Today was a busy day at Ellington Air Force Base.  SEAC4RS “took off” with our first science flight out of Houston.  Three planes were deployed:  the NASA DC-8, the NASA ER-2, and the SPEC Learjet (based in Huntsville, AL).  The goals of the flight were to examine southeastern United States chemistry and to fly through a growing cumulus cloud (but not growing too rapidly, of course!).

As a member of the meteorology (met) team, Jim Bresch rose before the sun to give last minute weather consultation for the flight.  Then, some of the met team prepared for “nowcasting,” while others put together a weather briefing for the remainder of the week (I told you it was a busy day!).  Nowcasting involves using current conditions to make short-range forecasts for the next 1-2 hours.  We had a group of people looking at the latest radar and satellite imagery and relaying information to the planes in real time.  The goal is to keep the planes safe, but also guide them to their target locations (such as a growing cloud).

The planes took off around 8 AM CDT, and things got lively in mission control.  The nowcasters were nowcasting, the flight navigators navigating, and everyone had something to contribute to the flight.  Things got interesting around 2PM when the DC-8 and Learjet began looking for storms to survey over northern Alabama.  Members of the met team were watching the radar and satellite to help the planes find a storm they could fly into.  For the weather nerds out there, the planes were looking for an isolated storm whose top was not higher than ~25,000 ft.  The nowcasters were using GR2Analyst to find these conditions, and relaying information and pictures up to the DC-8 in real time.  Eventually, the planes found a storm they could survey, and the Learjet and DC-8 both made passes through it.

While the planes were flying, the science team was preparing plans for the next flight, which is to take place Wednesday, 14 August 2013.  We had a meeting at 11 AM.  Mission meteorologist Lenny Pfister gave the weather outlook for the rest of the week.  Following that, Pablo Saide, from the University of Iowa, presented the atmospheric chemistry forecast for the same time frame.  Many interesting things were presented: very anomalous weather patterns, lots of convection, smoke plumes travelling into our region all the way from Idaho, and a large prescribed fire set to take place on Wednesday in South Florida.  In the end, the science team decided to focus the next flight on SE USA chemistry and the North American Monsoon.  Flight tracks currently are being drawn up to make the most of our situation.  It is amazing to watch the mission leaders synthesize all of this information, and then design a brilliant flight plan to capture all of the major features.  I guess there is a little artist in all of us scientists!

I will be back with more updates after our next flight.

People at tables and computers.
Mission control at Ellington Air Force Base. Things started getting busy after the DC-8 and ER-2 took off.
Fuelberg on a telephone at a desk.
Meteorologist Henry Fuelberg on his phone giving current weather updates to help coordinate a ozonesonde launch as a part of SEAC4RS.
Radar image of the involved aircraft.
Radar image showing the DC-8 (blue) and Learjet (green) as they meet up to sample a convective cloud. Nowcasters were watching this closely and relaying storm top heights to the scientists onboard the DC-8.
Learjet in the center of the convective cloud
The Learjet in the center of the convective cloud, as seen from GR2Analyst. Great science in the making!


New Blogger Bio – Nick Heath for SEAC4RS

This post and its photo was provided by Nicholas Heath, a student from Florida State University on the Studies of Emissions and Atmospheric Composition, Clouds and Climate Coupling by Regional Surveys (SEAC4RS) airborne science mission.

My name is Nick Heath.  I am a PhD student studying meteorology at Florida State University under Dr. Henry Fuelberg.  I started surfing when I was 16, and I immediately became interested in the weather and where waves come from.  This lead me to FSU, where I received a Bachelor’s in meteorology in 2011 and, more recently, a Master’s in June 2013.  My research involves chemical transport modeling.  Specifically, I am interested in how thunderstorms transport pollution from the surface to the upper troposphere and lower stratosphere.  However, I am still a bit of a weather nerd on the side and I get to indulge in this passion here at SEAC4RS.  As a member of the meteorology team, I will get to help prepare weather briefings for each science flight.  When the planes are in flight, I sometimes will be a “nowcaster,” meaning that I will be watching radar and satellite to help keep the planes away from dangerous thunderstorms.

When I’m not doing research or forecasting, I enjoy surfing, basketball, reading, and cooking.

nick_surf

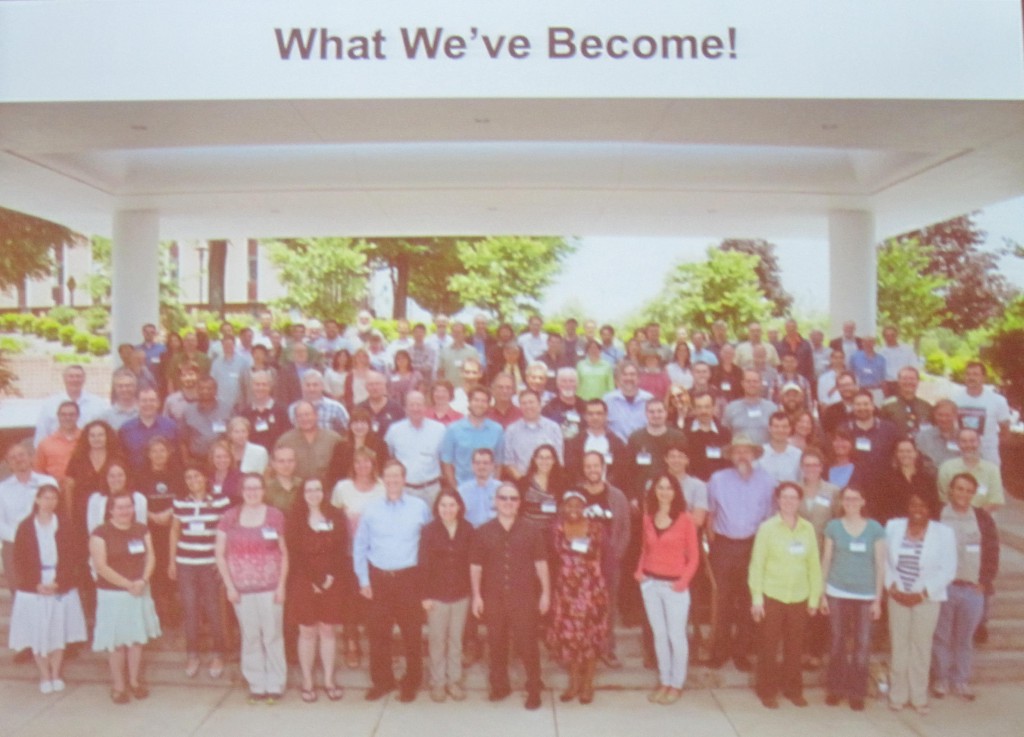
The Pluto science community is rich and diverse, just like its target of study: the ever-fascinating Pluto and its satellite moons.

This blog entry concludes my series of talk summaries for the July 22-26, 2013 Pluto Science Conference, “The Pluto System on the Eve of Exploration by New Horizons: Perspectives and Predictions.” You can read more about the conference and browse through the abstracts at the conference website https://dnnpro.outer.jhuapl.edu/plutoscience/Home.aspx

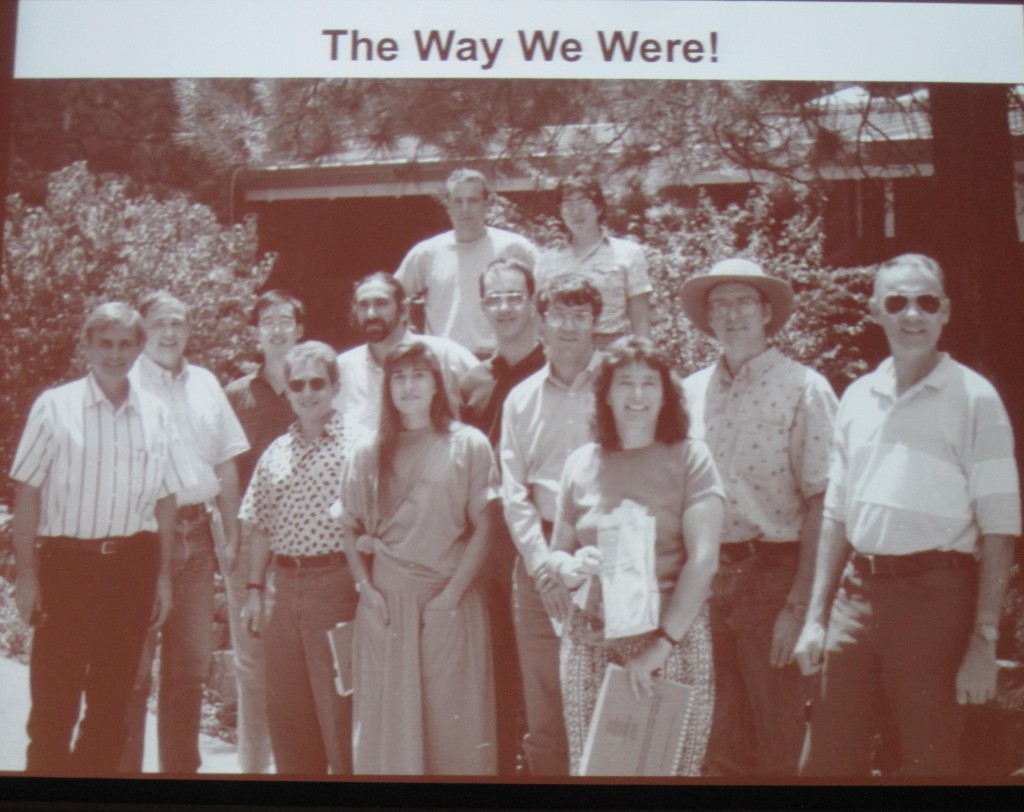
In his closing comments, Alan Stern (SwRI), the lead scientist (Principal Investigator) for NASA’s New Horizons fly-by mission to Pluto, told us about the last time a scientific discussion gathering specifically about Pluto occurred. It was twenty years ago, a 3-day meeting in July 1993, in Flagstaff, Arizona. The talks and presentations from that workshop led to ten contributed papers in a special issue in 1994 in Icarus (Vol 108, Issue 2) and, in 1997, the publication of a book entitled “Pluto and Charon” by The University of Arizona Press.

When the group gathered in 1993, the 1989 Voyager 2 fly-by of Neptune’s moon Triton’s was still “fresh data”, the prime Pluto-Charon “Mutual Events Period” of the 1985-1990 had just ended, and the Hubble Space Telescope (HST) would be soon coming back on-line with its fixed optics (the 1st HST servicing mission would occur in December 1993). It was a busy time for the Pluto science community.

Pluto Scientists July 1993

Some attendees at the open workshop meeting on Pluto & Charon in July 1993, Flagstaff, Arizona.

This five-day July 2013 meeting has demonstrated that the quest to better understand Pluto and its environment is a very rich and diverse field of study. With each new data set about Pluto and its companions, surprises are uncovered and new questions are posed. When the New Horizons spacecraft reaches the Pluto system in July 2015, a true “first encounter experience,” its on-board suite of modern instruments will transform our current-best resolution ~800 km/pixel (from Hubble observations) to a resolution of 0.46 km/pix (hemisphere) with 0.09 km/pix (regional) resolution with the LORRI instrument. You can be certain there will be a lot more surprises in store. Combining this with new and unique data sets from New Horizons’ particle & dust instruments and the UV and IR spectrometers, our understanding of the Outer Solar System will find a new grounding.

With 103 oral talks + 30 posters + 13 “topical sessions” this was a jammed pack week of sharing old information, sharing new data from the past few years, sharing “hot off the press data” (it’s Pluto observing season right now and during the conference attendees were doing observations of Pluto & Charon with IRTF, Keck and other telescopes, remotely or with their colleagues at the telescopes), identifying what computations or experiments are needed before the 2015 encounter, and in some cases, providing predictions of what might be detected at Pluto and Charon. Several papers presented at this conference will be submitted to the Icarus journal.

Pluto Scientists July 2013

Attendees at the “The Pluto System on the Eve of Exploration by New Horizons: Perspectives and Predictions,” held July 22-26, 2013, in Laurel, MD. The topical sessions covered Atmospheres, Charon, Dust & Rings, Interiors, Kuiper Belt Context, Laboratory Studies, Magnetosphere, New Horizons Mission, Origins, Satellites, Surface Composition, Surface Geology, and Surface-Atmosphere Interactions.

The stage is set for a summer 2017 Pluto Science Conference. New Horizon’s flyby of the Pluto System is on July 14, 2015, but it will take a bit over a year for all the data to come down losslessly (i.e. without compression). Deliveries to the NASA’s Planetary Data System are planned in 2016 and early 2017.

I hope you enjoyed this blog series reporting on these intriguing topics. You can follow the New Horizons mission status at any time by visiting the New Horizons Mission Website at http://pluto.jhuapl.edu/ and https://www.nasa.gov/mission_pages/newhorizons/main/index.html.

To Pluto and Beyond!!!!

Pluto Exotica. Atoms. Pick Up Ions. Bow Shocks. Suprathermal Tails. X-Rays. UV airglow.

The morning of the last day of this week’s July 22-26, 2013, Pluto Science Conference opened up the discussion with outer atmosphere (far out) and magnetosphere (really far out) talks.

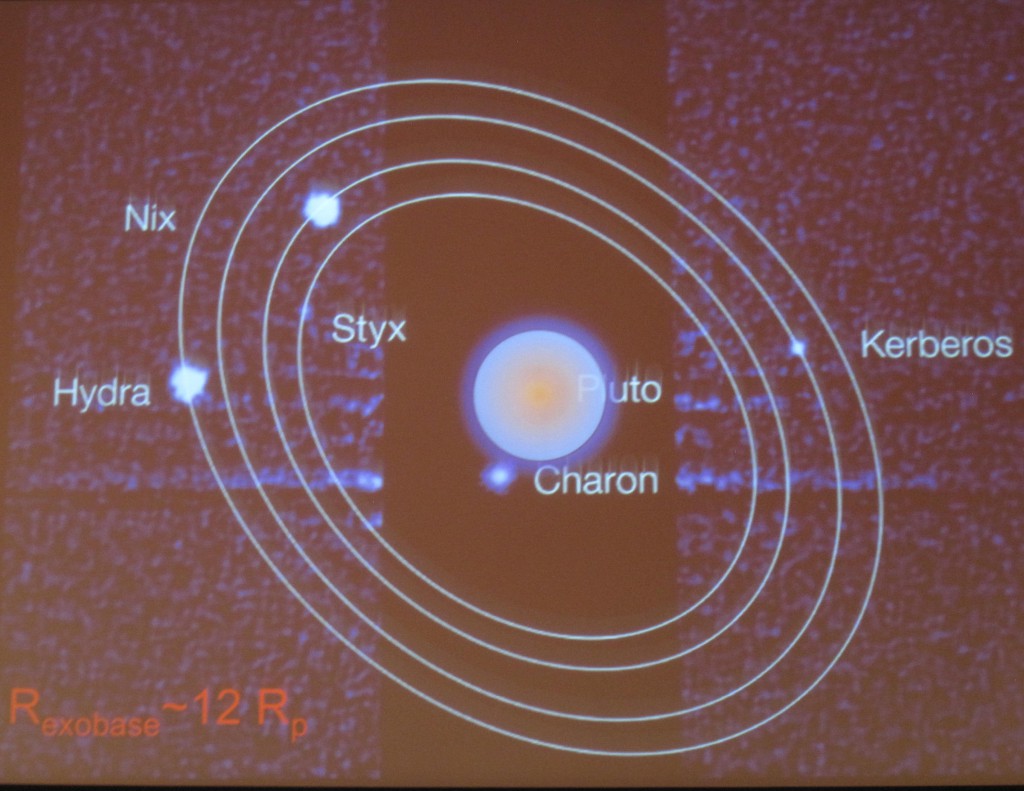
Fran Bagenal (University of Colorado) started the session with a talk on “The Solar Wind Interaction with Pluto’s Escaping Atmosphere.” Pluto’s interaction with the solar wind was first suggested in 1981 by Larry Trafton. There are two generally predicted regimes of what this interaction might look like: (1) Venus-like (small escape rate) and (2) Comet-Like (high escape rate). A key parameter distinguishing the two is what the atmospheric escape rate might be, that is, how many atmospheric molecules (assumed to be nitrogen) are escaping from Pluto, no longer being bound by gravity. Current estimates for the escape rate, based on a number of approaches, notably a recent one by Darrell Strobel (2012), have this number at 2-5×1027 molecules/sec.  This is large enough to suggest Pluto will appear to be “comet-like” in its interaction with the solar wind. However, we need to wait until 2015 for the New Horizons fly-by with their in-situ particle instruments SWAP & PEPSSI to make the interaction measurements.

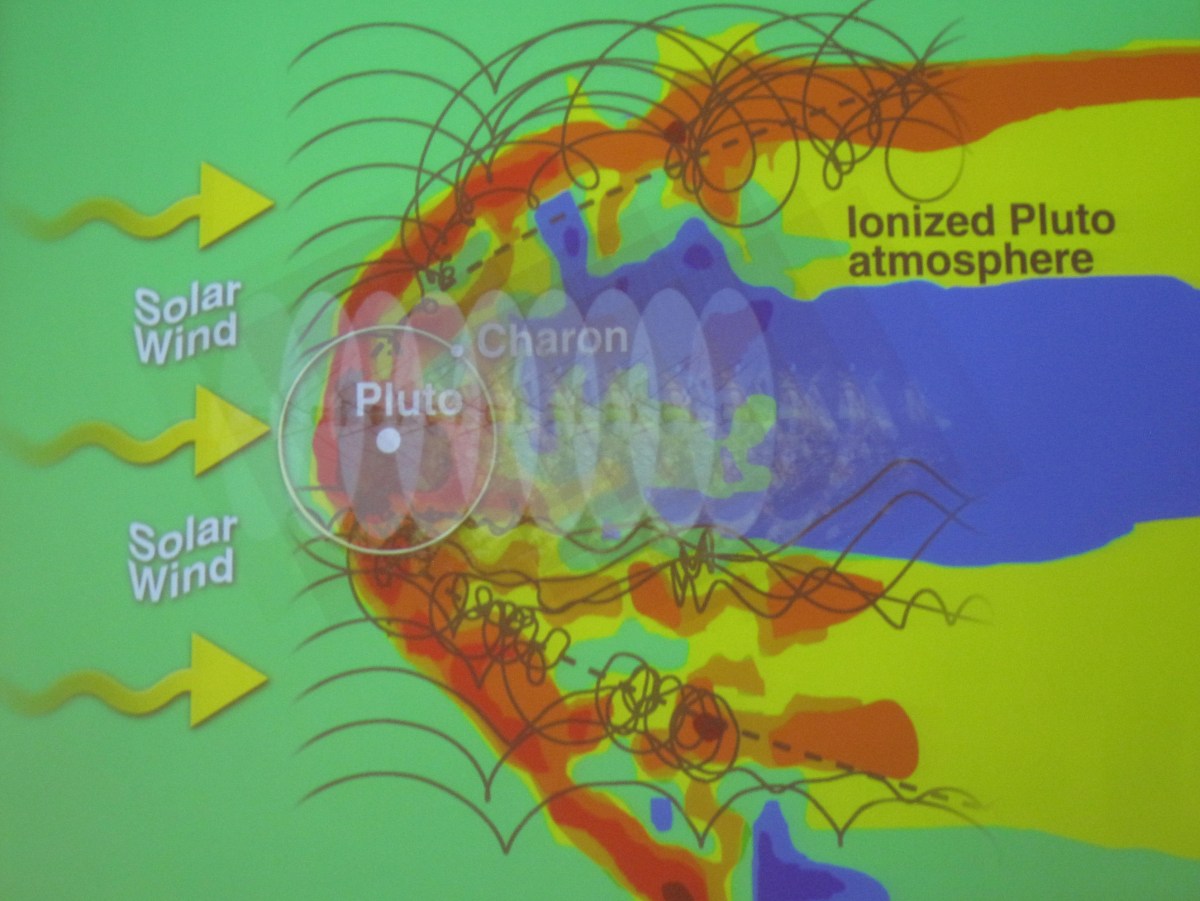
When describing the Pluto System in terms of solar wind interaction, Fran Bagenal showed this image, which superimposed one of Darrell Strobel’s atmospheres (characterized with an exobase at 12 Pluto radii). Pluto becomes a “large object” for interaction with the solar wind.
Solar Wind Perspective Pluto

When solar wind particles (protons) interact with the Pluto atmosphere, their path through space is bent along the magnetic field lines, and to convert momentum, pickup ions (neutral hydrogen atoms from the heliosphere that undergo a collisional charge-exchange interaction with solar wind protons, get ionized, are “picked up” by the solar magnetic field) get tossed onto new trajectories. Those ions are charged and will begin to rotate and follow electrical field lines. Where do the ionized particles go? A weak magnetic field will create large gyro-radii of pick-up ions which can extend millions of kilometers upstream of Pluto.  This is best modeled with a kinetic interaction.

Peter Delamere (University of Alaska, Fairbanks) spoke in greater detail about “The Atmosphere-Plasma Interaction: Hybrid Simulations.” Plasma interaction is an atmospheric diagnostic tool. Neutral gases are not easily picked up, but ions and how they interact with the solar wind can be detected with in-situ instruments such Hew Horizons’ SWAP and PEPSSI. He discussed his model plasma interaction mode, which was validated using Comet 19P/Borrelly that had been visited by Deep Space 1 on Sept 22, 2001.
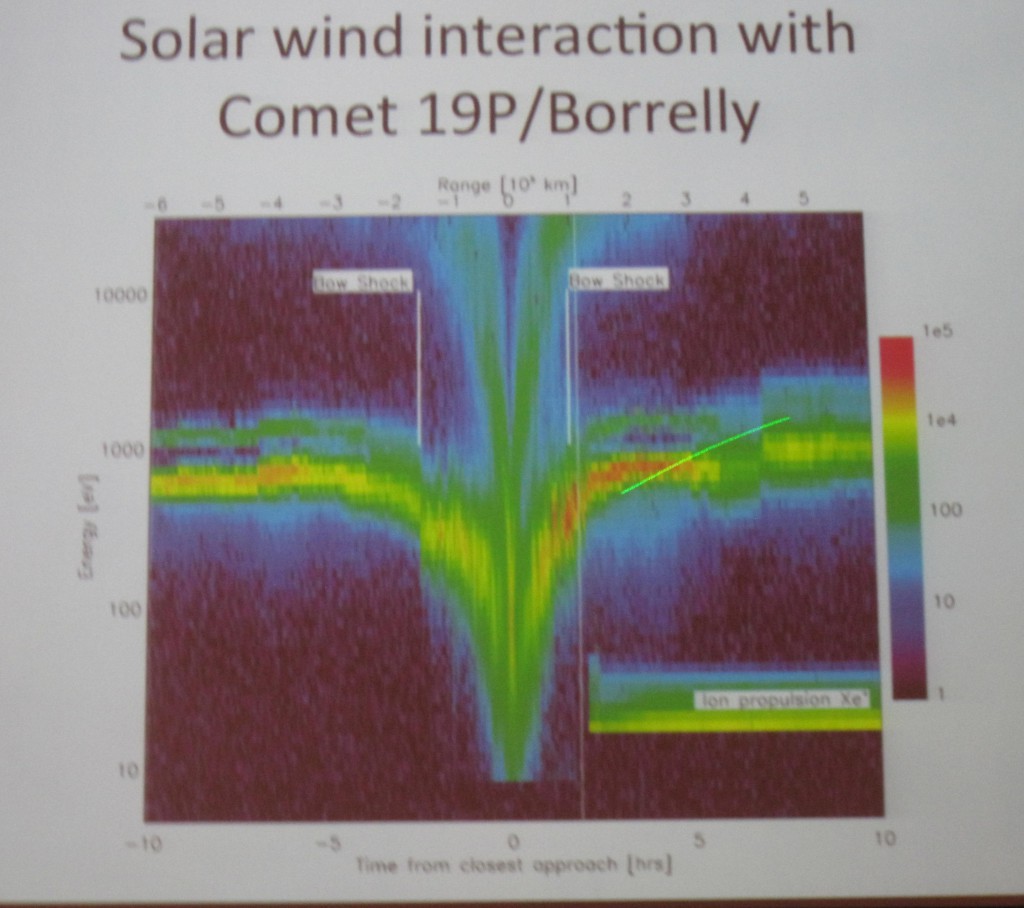
Comet Borrell Solar Wind Interaction

Example of Comet 19B/Borelly environment time vs. energy reveals the structure of the interaction between a comet and the solar wind. The X-axis is time from closes approach, with the Y-axis energy. The color code is the number of particles counted by the PEPE instrument aboard Deep Space 1. This is similar to what the data is expected to look at for Pluto when New Horizons reaches it in 2015, however, the solar wind at 33 AU may be more extended and more diffuse and therefore the signal strength (in terms of counts) will be much less.

If we can understand where the bow shock forms, this becomes a diagnostic of the atmosphere, and if indeed the exosphere extends out to 10 Pluto radii as suggested by recent work by Darrell Strobel (2012) and other models, then this is a sizable ‘obstacle.’ But is it inflated enough to form a bow shock? Peter Delamere thinks so. He stepped us through a variety of simulations. One of the simulations predicts a partial bow shock. If you increase Qo (the escape rate parameter, predicted to be in the 2-5×1027 N2 molecules) or increase magnetic field strength you can create a full bow shock. Future work includes adding the pickup part of the solar wind model as input.  If there is a very slow momentum transfer, perturbed flow could extend out to an AU.

Simulations predict all sorts of shock structures (Mach cones, bow shocks), but these structures depend on the escape rate parameter.
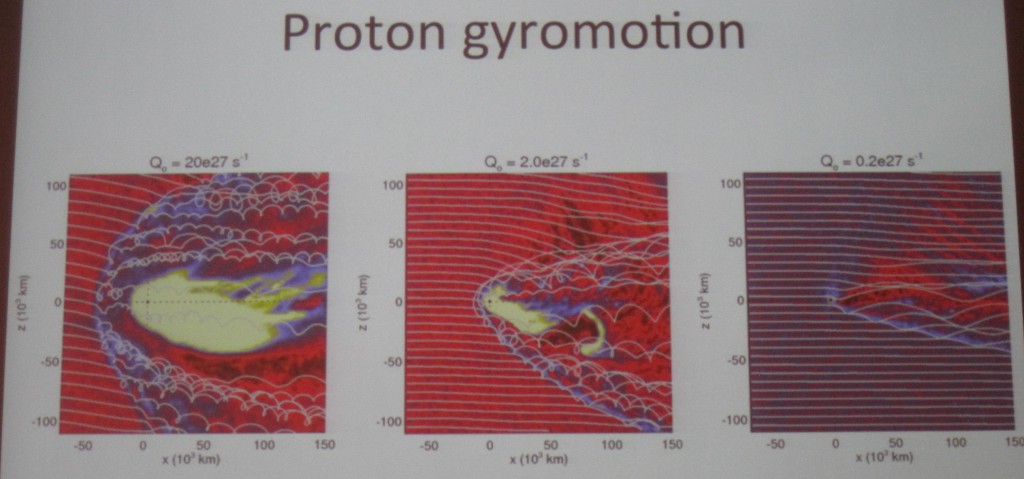
Solar Wind at Pluto Model

Example of a plasma interaction mode for three escape rates, decreasing from right to left. This is a slide in space of plane vs. distance from.  The white lines are sample solar wind proton trajectories. The color scale indicates ion density. The solar wind (and hence, the direction from the sun) is incident from the left. Pluto is at (0,0).

Predictions at Pluto. He anticipates significant asymmetry. The predicted bow show could be as far as 500 Pluto radii.

Heather Elliot (SwRI, San Antonio) in her talk “Analysis Techniques and Tools for the New Horizons Solar Wind around Pluto” described the New Horizons SWAP instrument and the different rate modes (sampling rate and scan types) it will be using during the 2015 encounter.
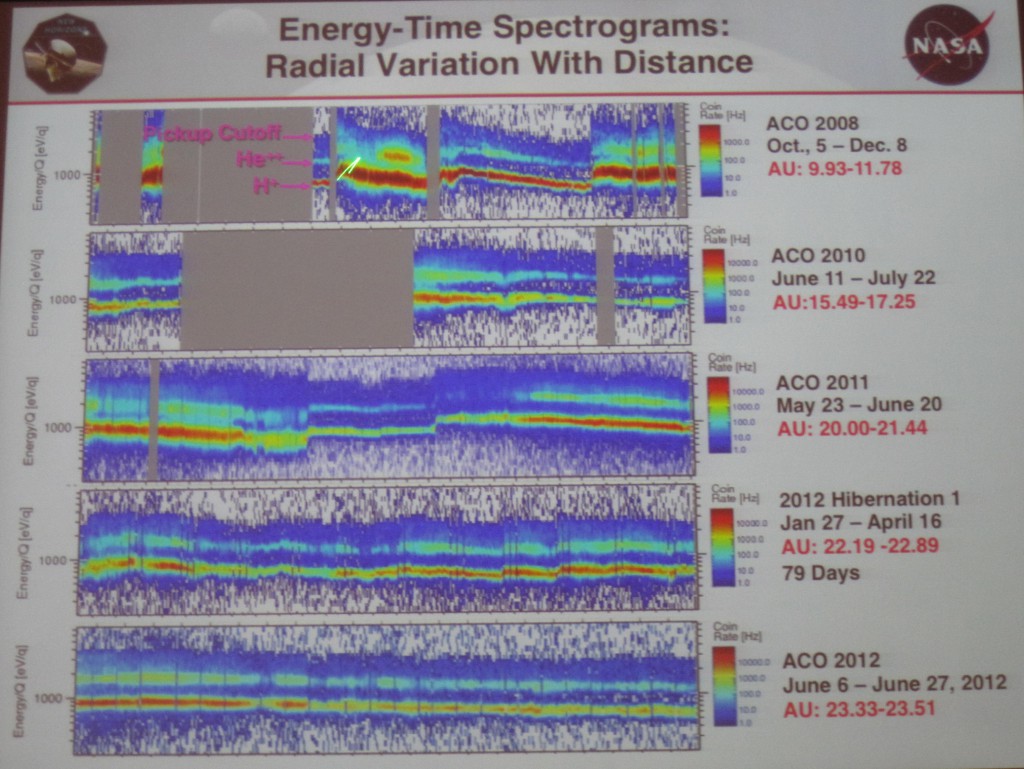
NH SWAP Instrument Cruise Data

Measurement of the solar wind taken with the SWAP instrument aboard New Horizons during the last 6 years of cruise. This data set covers AU=10 (Saturn distance) out to AU=23 in 2012. The solar wind is mostly protons (H+). The second most abundant species are alphas (He++). The colors are the intensity of species. The vertical axes are energy per charge units and the horizontal axis is time.

Fitting the SWAP data to a solar wind model requires making adjustments for view angle and during the hibernation period, when they do not have attitude information, they have modeled the Sun-probe-Earth angle to estimate the attitude and this works well to fit their data.

John Cooper (NASA Goddard) spoke about the  “Heliospheric Irradiation in Domains of Pluto System and Kuiper Belt.”  He is interested in computing the “radiolytic” dosage onto bodies in the outer solar system (that is, the effect of how molecules break down or change molecular band structure due to the influence of radiation, such as by cosmic rays, particles, UV, etc.). For this he needs measurements of the particle flux at large AU.  New Horizons joins its cousins Voyager 1 & 2, Pioneer 10 & 11 and Ulysses in exploring the outer solar system.
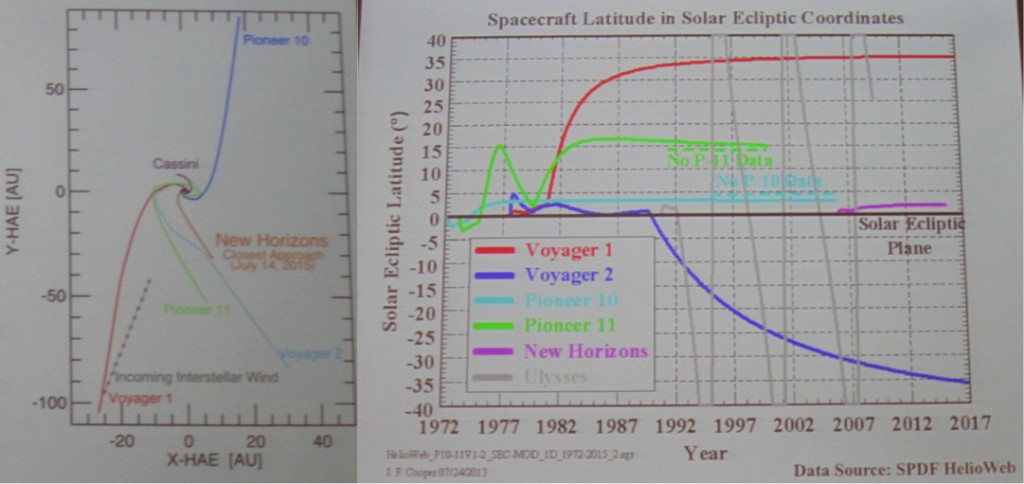
S/C Outer Solar System

Location of the NH spacecraft (orange on the left, purple on the right) for two different views of the solar system. Also plotted are deep space missions Voyager and Pioneer, among many. The left view is s top down view of the solar system with the Sun at (0,0), the axes are in AU, where 1 AU (Astronomical Unit) is the distance between the Earth and Sun. The right is a view of time vs. latitude for the crafts. Comparative data sets to New Horizons, which travels along the solar ecliptic, are Pioneer 10 and early Voyager 2 data.

He showed computations of irradiation dosage when applying those particle rates measured by New Horizon’s PEPSSI instrument and instruments aboard Voyager 2 and Pioneer 10.

He maintains a database of all particle instrument flux measurements at the Virtual Energetic Particle Observatory http://vepo.gsfc.nasa.gov.

Thomas Cravens (JHU/APL) with ”The Plasma Environment of Pluto and X-Ray Emission: Predictions for New Horizons,” asked “What happens when you get to within 1000 km of Pluto?“  Pluto is anticipated to be “Comet-Like” in its interaction with the solar wind, however when you get closer to Pluto (around 1000 km), it may more closely resemble “Venus-like” interaction. He is trying to compute where the charge-exchange boundary could be, probably around r~5000km. This is boundary between the kinetic (r>5000km) and fluid (r<5000 km) regimes, essentially probing the ionosphere regime of Pluto.

Switching to slightly lower energies, Casey Lisse (JHU/APL) gave a talk on “Chandra Observations of Pluto’s Escaping Atmosphere in Support of New Horizons.” X ray interactions (charge exchange, scattering and auroral precipitation) require an extensive neutral atmosphere, which is what is expected at Pluto. Interaction of solar wind with comets has consistently shown X-ray emission. He expects to see X-ray emission from Pluto. If detected it would tell us about the size and mass of Pluto’s unbound atmosphere. The best time to look for x-rays at Pluto is about 100 days after a large CME (corona mass ejection) event, which is about the time it takes for CME to get to Pluto at 33 AU.

He and his colleagues applied for, and got, time on NASA’s Chandra X-ray telescope. On Chandra, Pluto & Charon will appear to fill one Chandra pixel using the Chandra HRC instrument.  He ended his talk suggesting that looking at background counts with the LORRI and RALPH CCDs might serve as a poorman’s x-ray detector. It is also possible that PEPSSI background counts could be used to infer presence of lower X-rays.

Kandi Jessup (SwRI) gave a talk addressing the “14N15N Detectability at Pluto.” We care about 14N15N because it can be used to determine the 15N to 14N isotropic fractionation. This can help tell us about the evolution of Pluto’s atmosphere. Learning about Pluto’s atmospheric evolution history also provides vital suggestions for the evolution of equivalent TNOs (Trans-Neptunian Objects) and other objects in the Kuiper Belt, and hence, the outermost parts of our Solar System

The measurement will be the UV spectral observations during the solar occultation of Pluto by the Alice instrument during the New Horizons fly-by. N2 is the dominant absorber between 80-100nm. To identify the molecule 14N15N they use an atmosphere model from Krasnopolsky & Cruikshank (1999). That model does not have a troposphere. Next they need absorption cross-sections (a parameter that quantifies the ability of a molecule to absorb a photon of a particular wavelength) for 14N2 and 14N15N. 14N2 is the more dominant species and they are trying to find a very small percentage for 14N15N. Using these simulations they anticipate the Alice instrument will be sensitive enough to detect at least a 14N15N to 14N2 ratio of 0.3%. They will be look at the UV spectrum between 88 and 90 nm where the 15N lines spectrally shifted from 14N line. 14N15N to 14N2 ratio has been measured on Mars (0.58%), Titan (0.55%), and Earth (0.37%). What ratio will Pluto have? New Horizons data will hopefully tell us.

Randy Gladstone (SwRI, San Antonio) spoke about “Ly-alpha at Pluto.” Pluto ultraviolet (UV) airglow line emissions will be very weak, except at HI Lyman-alpha (Ly-a). Ly-a at Pluto could have both a solar (Sun) and an interplanetary (IPM/interplanetary medium) source. Ly-a should be scattered by Hydrogen atoms in Pluto’s atmosphere.  He uses the Krasnopolsky & Cruikshank (1999) Pluto atmosphere model that predicts the number of Hydrogen atoms at altitude. There are several observations near Pluto closest approach planned with the New Horizons Alice instrument to measure Lyman-alpha emissions.  This data will provide information about the vertical distribution of H and CH4 in Pluto’s atmosphere. Observation of the IPM Lyman-alpha source will be unique and provide important information to model Pluto’s photochemistry, especially for the nightside and winter pole region.

Randy Gladstone (SwRI, San Antonio) ended the session with a talk about “Pluto’s Ultraviolet Airglow.” He presented a model by Michael Stevens (Naval Research Lab), which has been used to explain the Cassini UVIS (Ultraviolet Imaging Spectrograph) observation of UV airglow at Titan over the 80-190 nm wavelength, emissions arising from processes on N2 (Stevens et al 2011). The model is called AURIC, the Atmospheric Ultraviolet Radiance Integrated Code. This model will be used for interpreting Pluto atmosphere data taken at UV wavelength with the New Horizons Alice instrument.

If Pluto was not already an exotic place to visit with all the predictions about its formation, its interior, its surface, it surface-atmosphere interaction, its composition, etc., it certainly will prove to be an amazing place if any or all of these predicted upper atmosphere and mesosphere molecular species, ions, and high energy particles are measured with the New Horizons spacecraft!

Winds. Fog. Frost. Global weather predictions on Pluto.

Talk summaries from the Pluto Science Conference held July 22-26, 2013 in Laurel, MD continues. This blog entry is about atmosphere presentations on July 26th.

Angela Zalucha (SETI) began the discussion with her talk entitled “Predictions of Pluto’s vertical temperature and wind structure from the MIT Pluto general circulation model.”

A general circulation model (GCM) solves conservation of momentum in 3D, conservation of mass, conservation of energy and equation of state (P=rRT). It can tell us some fundamental atmospheric properties such as composition (what is it made of), pressure (how much is there?), temperature (how hot is it?), and wind (how does it move?). In particular, understanding wind is one of the most important things a general circulation model gives you, because it is so hard to observe remotely.

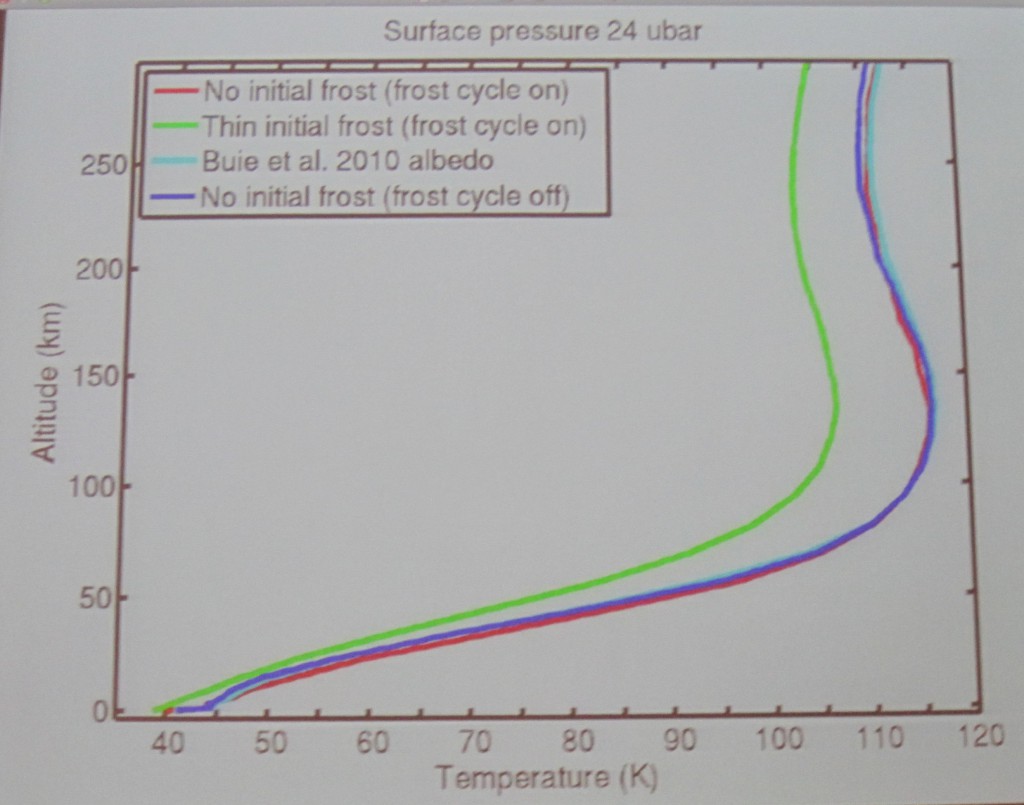
She presented her model, based on the MIT (Massachusetts Institute of Technology) GCM that was originally designed as an ocean model. She turned it upside down to make it an atmosphere model. It has multiple layers, CH4 mixing ratio at 1%, CO mixing ratio at 0.05%, includes atmosphere models (Strobel et al 1996) and runs for a 15 year Earth integration rate (she notes that is probably not enough time to have the atmosphere equilibrate). She sets frost layers on the surface as a parameter, and explored different surface pressures (8 16, 24 microbars). She uses the Ecliptic North convention. One output from this model are curves of temperature vs. altitude, called a temperature profile. She reported the presence of a frost predicts a much colder atmosphere. Future work will be to investigate other ice distributions, put in a CH4 transport model, and improve surface model.

Temperature Profile

Example of a suite of temperature profile curves from the Pluto MIT GCM. Temperature in Kelvin is shown for a range of altitudes in kilometers. The MIT GCM has assumed a particular Pluto radius to set zero altitude.

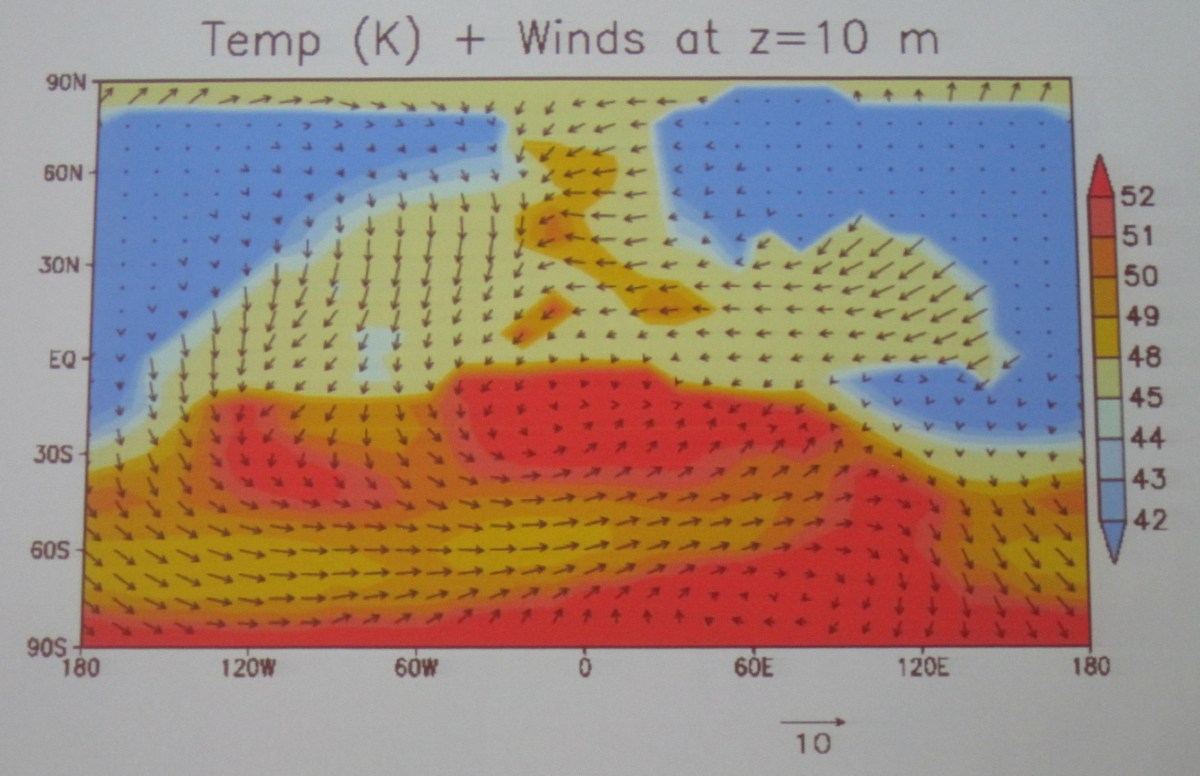
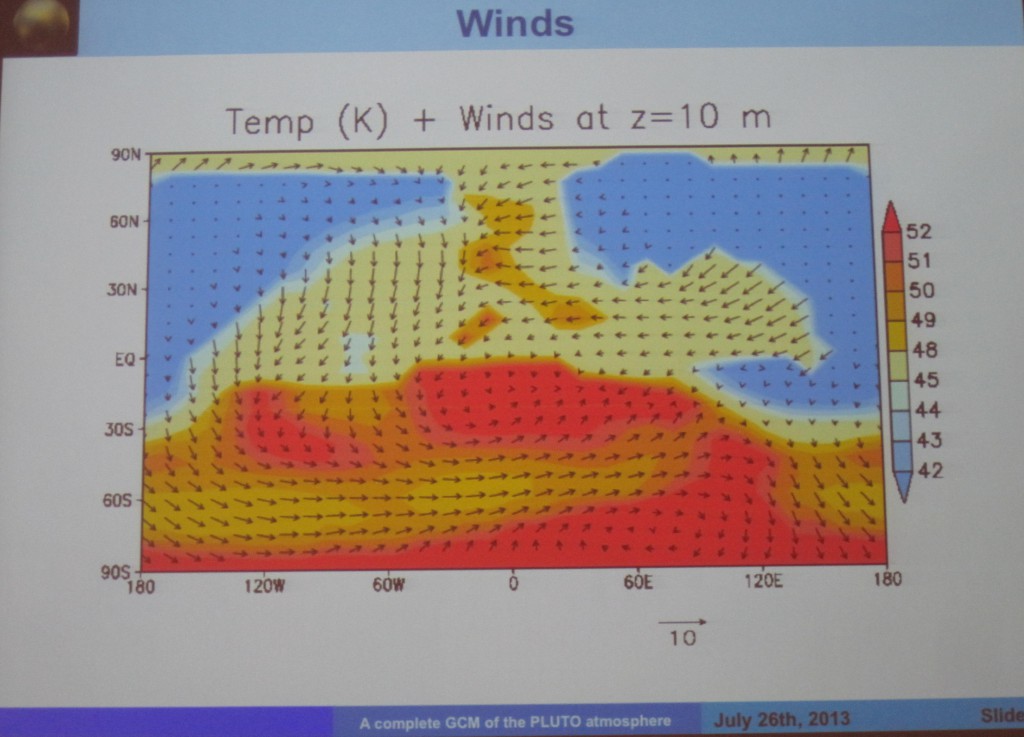
Melanie Vangvichith (LMD, Paris) in her talk “A Complete 3D Global Climate Model (GCM) of the Atmosphere of Pluto” presented another general circulation model for Pluto, the LMD (Dynamic Meteorology Lab) GCM. For a thin atmosphere that is expected on Pluto, their model uses careful parametizations of the nitrogen condensation and sublimation surface-atmosphere processes, which they claim is key (Forget et al 1998). They also adopt a particular initial frost distribution, the distribution from Lellouch et al 2000.  Their model is run for 140 Earth years, starting with 1988 adopting initial conditions based on observations. Conclusions. When adopting a 20 MKS thermal inertia, the model is in agreement with occultation data to date, but this model does not predict a troposphere, just a “big stratosphere.”

Winds from the LMD GCM

Example of a wind prediction from the Pluto LMD GCM. The temperatures (in K) are represented by the color and the arrows represent the wind direction and speed at particular height. This is mapped onto a lat/long grid using the right-hand-rule (i.e. matches the Marc Buie convention).

In the previous entry, I had commented on thermal inertia and its role in atmosphere dynamics. To recap here, thermal inertia is a measure of the ability of a material to conduct and store heat. In the context of planetary science, it is a measure of the subsurface’s ability to store heat during the day and reradiate it during the night. This has natural consequences for deriving what happens to processes that require an exchange of heat. A GCM uses thermal inertia of the surface as a key parameter. There is a currently big disconnect in the community over what Pluto’s thermal inertia is. In E. Lellouch’s talk on Jul 23 he reported that Spitzer & Herschel have measured Pluto’s thermal inertia as 20-30 MKS (Lellouch et al 2011). However, Pluto atmosphere pressure models needed to match occultation data by C. Olkin & L. Young require Pluto have a much higher thermal inertia >1000 MKS to explain their occultation measurements (this meeting). Thermal inertia is usually quoted in MKS units, where MKS is an abbreviation for “J K-1 m-2 s-1/2.”

Anthony Toigo  (JHU/APL) with his talk “The Atmosphere and Nitrogen Cycle on Pluto as Simulated by the PlutoWRF General Circulation Model” presented a third general circular model. Their GCM is based on the terrestrial model used for Weather Research and Forecasting (WRF). It has been adopted for Mars, Titan and Jupiter, and they have adopted it for Pluto.  They ran their model for two extremes of thermal inertia, as this is a current open question in the community. They are just attempting to see what effect this has on the predictions.  They also looked at the effect of the nitrogen cycle adjusting amount of nitrogen ice. Conclusions. The model is in agreement with the increase in pressure derived from observations, supports large volatile abundances, and shows a pole-to-pole transport. Future work for Pluto includes constraining the volatile cycle and looking at surface wind relations.

The three modelers sparked a lively debate at the Pluto Science Conference. Sometimes they agree and in many cases they diverge greatly. It was neat to see how different groups tackle the same physics problem. It came down to the details and initial assumptions. GCMs have become such powerful tools to describe dynamics (changes) in atmospheres, but because there are still so many assumptions about Pluto’s surface and atmosphere, it will only be until New Horizons provides measurements to start anchoring down these models.

Coordinate systems do matter. Brush up on that Right Hand Rule, y’all.

This is a blog series covering the talks presented at the Pluto Science Conference, held July 22-26, 2013 in Laurel, MD.

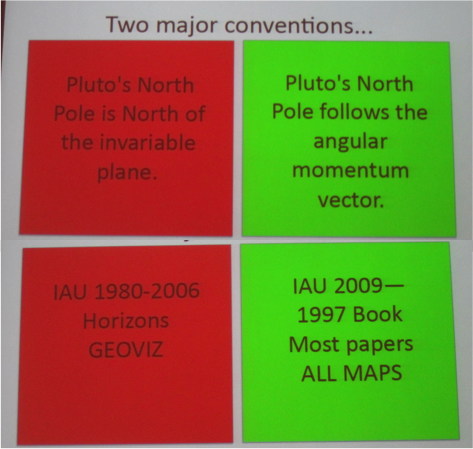
In an engaging talk by Amanda Zangari (SwRI) entitled “Plutography: A Meta-Analysis of Coordinates on Pluto From Charon’s Discovery to the Present Day,” she compared and contrasted two coordinate systems used by Pluto researchers. Her motivation is that data sets, past, present and future will be compared to the New Horizons dataset, and so it will be very important that all use the same coordinate system.

Coordinates

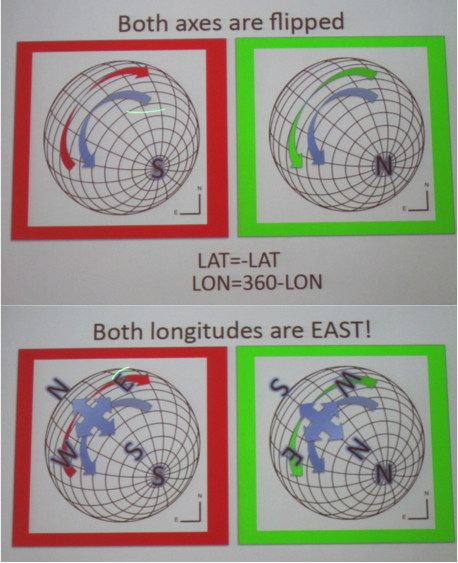
It comes down to two coordinate systems, although she mentioned that some researchers sometimes use a hybrid-definition.  In her visual summary, the Red (left) is the Ecliptic North configuration where Pluto’s North Pole is “North of the invariable plane.” The Green (right) is the where “Pluto’s North Follows the Angular Momentum Vector” aka Right Hand Rule (RHR).  When the planet’s north pole is aligned closely with the Ecliptic North, the former is normally okay (like for Earth). However, for Pluto, Uranus and Venus the two are definitely very different. She suggests that the Right Hand Rule is the more appropriate definition for Pluto. Note that JPL Horizons (their official ephemeris generating software), GEOVIZ (New Horizons Planning software) and SPICE uses the other convention (Ecliptic North Pole).

How they differ are summarized below (i.e. both axes are flipped). The pole that is visible from Earth is what is seen in the lower-right quadrant of each schematic. Since the 1980s we have been is observing Pluto’s Northern Pole per the Right-Hand-Rule (RHR) convention.

Coordinates 2

Alan Stern, New Horizon’s Principal Investigator (lead scientist) mentioned that the New Horizons Spacecraft will not change its system prior to the Jul 2015 encounter. After the encounter, the plan will be to adopt the new SPICE files, etc. He stressed that Pluto Data that gets released in the Planetary Data System will be in the Right-Hand-Rule convention (RHR). Leslie Young, New Horizons’ deputy Project Scientist, said that there are new SPICE files available using a Pluto coordinate system using the RHR Convention, although the JPL/SPICE official release  is still Ecliptic North.

So, huh, which way is up? I’m sure this topic is far from over. In fact, during discussions at the meeting, agreeing on a coordinate system for planetary bodies is no stranger to this community.