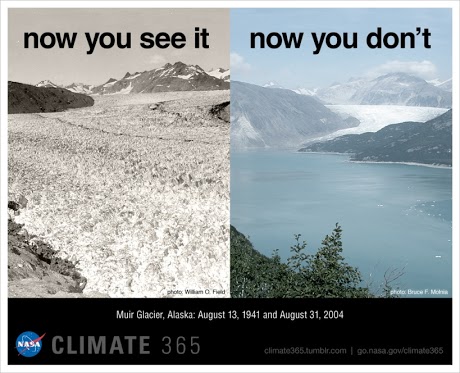
There’s nothing quite like historical photos of glaciers to show what a dynamic planet we live on. Alaska’s Muir Glacier, like many Alaskan glaciers, has retreated and thinned dramatically since the 19th century.
This particular pair of images shows the glacier’s continued retreat and thinning in the second half of the 20th century. From 1941 to 2004, the front of the glacier moved back about seven miles while its thickness decreased by more than 2,625 feet, according to the National Snow and Ice Data Center.
 Photo credits: Photographed by William O. Field on Aug. 13, 1941 (left) and by Bruce F. Molnia on
For more historical images of glaciers, visit http://nsidc.org/data/glacier_photo/ or http://climate.nasa.gov/interactives/global_ice_viewer.

 Dr. David Le Vine, deputy principal investigator for the Aquarius mission, discusses why we need to know more about sea surface salinity. Le Vine is an expert in measurement physics at NASA’s Goddard Space Flight Center. He is currently a scientist with the Aquarius mission, which gathers data on sea surface salinity. Our current knowledge of sea surface salinity is very limited because in the past we’ve only collected data from ships traveling in shipping lanes.
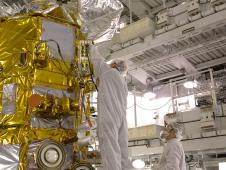
 Preparations continue for the June 9, 7:20 a.m. launch of the international Aquarius/SAC-D observatory satellite from NASA’s Space Launch Complex at Vandenberg Air Force Base, Ca. The satellite will study connections between ocean circulation, the water cycle and climate by measuring ocean surface salinity. Global ocean salinity has been an area of much scientific uncertainty. Past measurements of salinity have been limited mostly to summertime observations in shipping lanes. Aquarius will map the entire ocean every day for at least three years from an altitude of 657 km (408 miles). The measurements will help scientists understand how salinity changes over time. Because ocean surface salinity varies from place to place and over time, scientists can use it to trace the ocean’s role in Earth’s water cycle. Aquarius will reveal how salinity variations influence ocean circulation and the water cycle, which help determine the Earth’s climate.
 In this episode of NASA Now, you will learn what it’s like to study the atmospheres of other planets. We are approaching the first day of spring in the Northern Hemisphere and the first day of autumn in the Southern Hemisphere. Dr. Kelly Fast, astrophysicist at NASA’s Goddard Space Flight Center in Greenbelt, Md., discusses the reason for the seasons. Fast explains what an equinox is and whether or not other planets in our solar system have seasons.