NASA’s IRIS reaches orbit

NASA’s Interface Region Imaging Spectrograph, or IRIS, solar observatory separated from its Pegasus rocket and is in the proper orbit. This followed a successful launch by the Orbital Sciences Pegasus XL rocket from Vandenberg Air Force Base, Calif. It was the final Pegasus launch currently manifested by NASA. NASA’s Launch Services Program at the agency’s Kennedy Space Center in Florida managed the countdown and launch.

To read more about IRIS, visit https://www.nasa.gov/mission_pages/iris/index.html

This article is a great extension to the NASA Explorer Schools featured lesson, Geometry: Space Math Problems—Solar Storms. Access this lesson on the NES Virtual Campus.

Sun Emits an M5.9 Solar Flare

The sun emitted a mid-level solar flare, peaking at 6:49 p.m. on June 7, 2013. Solar flares are powerful bursts of radiation. Harmful radiation from a flare cannot pass through Earth’s atmosphere to physically affect humans on the ground, however, when intense enough, they can disturb the atmosphere in the layer where communications signals travel. This disrupts radio signals for as long as the flare is ongoing, anywhere from minutes to hours.

This flare is classified as an M5.9 flare. M-class flares are the weakest flares that can still cause some space weather effects near Earth. This flare caused a moderate radio blackout, rated an R2 on the National Oceanic and Atmospheric Administration’s space weather scales, which range from R1 to R5. It has since subsided.

This is a real-world connection to the NASA Explorer Schools featured lesson, Geometry: Space Math Problems—Solar Storms. To access this lesson, visit the NES Virtual Campus.

To read more about this solar flare and see an image of the flare captured by NASA’s Solar Dynamics Observatory, visit https://www.nasa.gov/mission_pages/sunearth/news/News060813-m5.9flare.html.

Three Years of Solar Dynamics Observatory Images

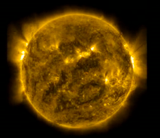
Solar Dynamics Observatory image of the sun based on a wavelength of 171 angstroms, which is in the extreme ultraviolet rangeIn the three years since it first provided images of the sun, NASA’s Solar Dynamics Observatory has had virtually unbroken coverage of the sun’s rise toward solar maximum, the peak of solar activity in its regular 11-year cycle.

For more information and to see or download a time-lapse video showing those three years of the sun at a pace of two images per day, visit https://www.nasa.gov/mission_pages/sdo/news/first-light-3rd.html.

This video is a very cool addition to the NASA Explorer Schools featured lesson, Geometry: Space Math Problems—Solar Storms. To access this lesson, visit the NASA Explorer Schools Virtual Campus.

Radiation Belt Mission Is Extension for Space Math Problems

Artist concept: Radiation belt storm probe in orbit above EarthNASA’s Radiation Belt Storm Probes are flying in Earth orbit after a recent successful liftoff and ascent. The rocket’s Centaur upper stage released the probes one at a time and sent them into different orbits, kicking off the two-year mission to study Earth’s radiation belts.

To read more about the Radiation Belt Storm Probes, visit: https://www.nasa.gov/mission_pages/rbsp/main/index.html

This mission is a great example of how NASA studies solar weather and an up-to-date extension to the NASA Explorer Schools lesson Geometry: Space Math Problems: Solar Storms. To access this lesson and get your students studying and tracking space weather, log into the NES Virtual Campus.

A Taste of Solar Maximum

Forecasters say Solar Max is due in the year 2013. When it arrives, the peak of 11-year sunspot cycle will bring more solar flares, more coronal mass ejections, more geomagnetic storms and more auroras than we have experienced in quite some time.

On the weekend of July 14, 2012, sky watchers around the world got a taste of things to come.It was mid-Saturday in North America when a coronal mass ejection or “CME” crashed into Earth’s magnetic field and triggered the most sustained display of auroras in years. For more than 36 hours, magnetic storms circled Earth’s poles. Northern Lights spilled across the Canadian border into the United States as far south as California, Colorado, Kansas, and Arkansas. In the southern hemisphere, skies turned red over Tasmania and New Zealand, while the aurora australis pirouetted around the South Pole.

This lesson is a great extension to the NASA Explorer Schools featured lesson, Geometry: Space Math Problems—Solar Storms. To access this lesson, visit: the NASA Explorer Schools Virtual Campus website.

To continue reading this story, visit: https://www.nasa.gov/mission_pages/sunearth/news/taste-solarmax.html

NASA Measures Impact of Huge Solar Flare on Earth's Atmosphere

TIMED satellite, artist's conceptA key NASA instrument that can directly measure the impact of solar events on Earth’s upper atmosphere has “weighed in” on the huge flare that impacted Earth recently.


The flare was considered one of the largest solar events in years, even though its impact on the power grid and communications was minimal due to the angle it hit Earth.


To read more and watch a video about this huge solar flare, visit https://www.nasa.gov/mission_pages/sunearth/news/saber-solarstorm.html.This feature story acts as an excellent extension to the NASA Explorer Schools featured lesson Geometry: Space Math Problems — Solar Storms. In this lesson, students use geometry and measurement to track solar activity.


This lesson can be found in the lesson library on the NES Virtual Campus.