Volcano Music


What on Earth was that sound? Was it a bird? A plane? A humpbacked whale?

No, it was fiercely hot gas whooshing through the guts of a volcano — Arenal Volcano in Costa Rica, to be precise. Milton Garces, the director of the Infrasound Laboratory at the University of Hawaii, Manoa, recorded the sound clip we posted last week.

Garces explains the phenomenon this way:

“Much like human voicings are defined by the combination of air flow through the vocal chords, tract, and mouth shapes, this harmonic tremor sound is shaped by the interaction of volcanic gases as they are released and flow through open conduits.”

NASA satellites have got Earth’s volcanoes covered from orbit. They provide round-the-clock monitoring of volcanic eruptions in progress or those possibly on the way. Just two of the satellites used to monitor volcanic activity are Aqua (with its MODIS instrument) and Terra (with its ASTER instrument).

Volcanologists use the satellite data from NASA’s fleet to detect heat and telltale volcanic gases emanating from volcanic vents. Also, Global Positioning System satellite devices allow researchers to gauge subtle changes in the land surface near volcanoes.

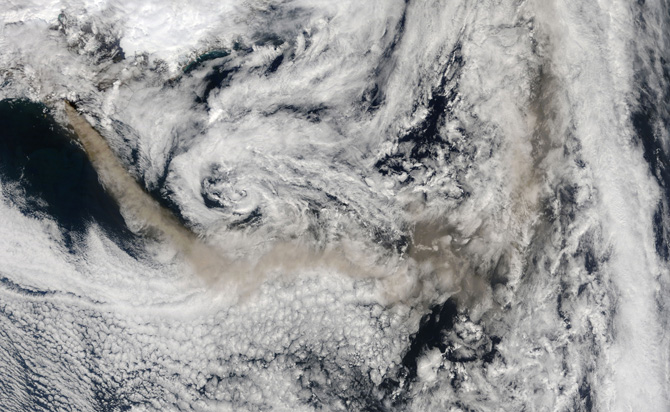
And once a volcano pops off, NASA satellites track drifting ash clouds that could threaten aircraft. (You may recall the shenanigans of a certain unpronounceable Icelandic volcano, Eyjafjallajökull, earlier this year.)

As the NASA birds pass silently overhead, Garces clambers up live volcanoes to record their subterranean rumblings. He uses the sounds to diagnose the physical status of volcanic plumbing systems – for example, whether they might be recharging with molten rock (magma) and getting ready to erupt.

These very low frequency waves are called infrasound. In fact, they are too low in their raw form to be audible to humans. So Garces speeds them up artificially to a frequency range the human hearing can detect. Here’s how he explained it to us:

“This signal, which has been sped up by a factor a hundred to make it audible, in reality has a dominant periodicity of about 1 cycle per second (1 Hz). In the field, it sounds like a chugging sound with 1 s puffs, and it is not tonal at all. We lose our sense of tonality at frequencies below around 16 Hz, so infrasound, however harmonious, will be perceived by us more like a beat than a tune.”

In other words, volcano infrasound is pretty interesting to a scientist, but you can’t dance to it — or at least it would be the ultimate slow dance.


— Daniel Pendick,
Geeked on Goddard
; Eyjafjallajokull image
courtesy of NASA Goddard’s MODIS Rapid Response Team

4 Views of Eyjafjallajökull’s Plume That You Probably Haven’t Seen Before

When the volcano roared to life and began spewing huge amounts of ash and gas into the atmosphere, Eyjafjallajökull’s giant plume stranded millions of travelers and captivated the rest of us as it wafted away from Iceland.

Most images have shown how the plume might appear to a human from space. But to an aerosol scientist, the real excitement comes from the instruments that produce less recognizable images that nevertheless reveal subtle details about the nature of the plume.

One instrument or one satellite alone is not likely to yield breakthrough insights about volcanic plumes. Rather, constant comparisons between numerous sets of datacollected by a variety of satellite, aircraft, and ground-based platformsare most likely to lead to new discoveries.

With that in mind, aerosol scientists from NASA’s Goddard Space Flight Center and neighboring institutions met last month at a special AEROCENTER seminar to share information about some aspects of Eyjafjallajökull’s plume that they’ve studied so far.

Such cross-satellite and cross-platform efforts make it possible to address some of the thorniest problems in the field. Comparing results from several instruments, for example, makes it easier to understand the dispersion of plumes and—with the help of computer models—predict how plumes might behave, noted Santiago Gassó, the Goddard geophysicist who organized the seminar.

Though the scientists have just started picking their way through Eyjafjallajökull data, there are a number of presentations from the meeting to click through if you’re interested. There’s nothing Earth-shattering to report yet, but we did find some views of the plume that you likely haven’t seen in the newspapers. You can find more imagery of Eyjafjallajökull’s eruptionand plume here,here, here, here, here, here, and here.


MISR – Plume Height


NASA scientists used an instrument called MISR aboard the Terra satellite to view the ash plume from multiple angles, and then applied a stereo-imaging technique to derive the height of the ash cloud at different points during the eruption. The result is the colorful image on the right that distinguishes plume height with bright reds (6 km), oranges (5 km), yellows (4 km), greens (3 km), and blues (2 km). The blue, near-surface part of the plume is resuspended ash.  (Image Credit: NASA/JPL/MISR)


CALIPSO – Vertical Profile

The CALIPSO satellite provides a vertical profile of a whole slice of the atmosphere with a LIDAR instrument that shoots laser pulses at the atmosphere below and measures how it reflects off particles in the atmosphere. In this image, captured on April 17 as the satellite passed over France, the plume appears as a wispy band of yellow and red. The thick yellow layer below is air pollution hovering near the surface of France. (Image Credit: NASA/CALIPSO/Winker)


OMI – Sulfur Dioxide (SO
2)


The Ozone Monitoring Instrument (OMI) aboard NASA’s Aura satellite had eyes for ash as well as something that’s invisible to the human eye: the transparent (and toxic) gas sulfur dioxide (SO2). OMI observed sulfur dioxide billowing out of the volcano at a clip of as much as 10 thousand tons a day. The OMI instrument produced this image, which shows higher concentrations of sulfur dioxide in red and lower concentrations in blue and purple, on April 30—two weeks after the peak of Eyjafjallajökull’s eruption between April 14 and 17. (Image Credit: NASA/OMI/via Joiner)


DLR Falcon – Aircraft LIDAR


A few days after the eruption began, European scientists scrambled a DLR Falcon jet equipped with a LIDAR and other instruments. The LIDAR, cruising at 8 km altitude, detected volcanic ash in the altitude range of 3.5 km to 5.5 km. The ash plume appears as a yellow and green mass above a layer of clouds (seen as the line of rust-colored spots beneath the ash). When the instrument collected this data, the ash had aged four or five days. The white streaks on the image represent areas where the LIDAR did not detect a significant amount of aerosol. (Image Credit: DLR/via Diehl)

— Adam Voiland, NASA’s Earth Science News Team