Humisery 2011: No Ordinary View of Air Pollution


A video camera on board NASA’s P-3B aircraft captured this vertigo-inducing view of Baltimore’s suburbs as part of an air pollution-monitoring mission called Discover-AQ. The P3-B, loaded with multiple pollution sensors, has been cruising along major transportation corridors in the Washington-Baltimore metro area and flying spirals over six ground stations throughout July. Meanwhile, a smaller aircraft, a UC-12, has been flying along the same approximate flight path but at higher altitude of about 26,000 feet. View the animation below to see the flight paths of both planes.


The goal of the flights is to help piece together a more accurate view of the vertical distribution of air pollution by looking simultaneously at the same pollution events with ground, aircraft, and satellite instruments. Flights for this summer will wrap up by July 29th.

The researchers involved in the project haven’t had time to rigorously analyze the data their instruments have collected and publish findings in peer-reviewed science journals yet, but many have posted raw results from the various instruments on Discover-AQ’s science website.

I paged through many of the daily reports and found quite a number of intriguing nuggets of information. For now, though, I’ll share just one set of images – a comparison of particulate pollution levels on July 1 with levels on July 22nd. The data comes from the High Spectral Resolution Lidar (HSRL), a sensor on the UC-12 that uses a radar-like laser technology called lidar to map the distribution of small particles of pollution. HSRL generates data “slices” that show the vertical distribution of the particles, known generally as aerosols, from ground level up to eight kilometers. 


July 1 Flight
(minimal particulate air pollution)

July 22nd Flight (heavy particulate air pollution)


In the HSRL data readouts, high levels of aerosols are shown in red and yellow, while lower levels of particles are shown in blue. On the first day of science flights – July 1st – temperatures were moderate and aerosol levels were low. By the tenth flight, the mid-Atlantic was in the midst of a brutal heat wave (which the Star-Ledger weather team want to call Humisery11), and both ozone and particulate counts from ground stations had shot up.

The HSRL slices capture the difference between clear and pollution-laden skies beautifully. The first flight shows just moderate levels of ground-level pollution – the yellow band in the image below that reaches up to about 3 kilometers. In contrast, the flight on the 22nd, a day that temperatures in Baltimore hit 105 °F, shows a deep red swath of particle pollution near the surface.

HSRL data can be a little confusing to make sense of when you first see it, so realize that scientists plot the data out in a horizontal strip with the passage of time on the upper x axis (the numbers with the UT units) and the latitude and longitude on the lower x axis. Altitude is shown on the y-axis. The two images below should help you see how the strips of data relate to the trapezoidal flight paths


July 1st Flight

July 22nd Flight

Text by Adam Voiland. Flight video from P3-B camera. Flight path visualization from the SVS. Data charts from the July 1st and July 22nd HSRL flight reports.

Marylanders: Stop and Smell the Air this July as NASA Planes Buzz Overhead


Have you ever stopped to wonder why urban air can taste like singed rubber one day and crisp mountain air the next? Or what happens to all those delectable clouds of who-knows-what flowing from factory smokestacks and vehicle tailpipes? Or what makes a blanket of dense smog shroud a city skyline on certain days?

Raymond Hoff, an air pollution expert based at the University of Maryland, Baltimore County, sure has. Hoff has studied air pollution for more than three decades researching topics ranging from Arctic haze, to ozone-damaged beans on the banks of Lake Ontario, to the river of fumes that emanate from Interstate 95. He’s authored dozens of journal articles and book chapters, uses lasers to measure air pollutants, edits a blog about smog, and has led or participated in nearly two-dozen field experiments around the world. 

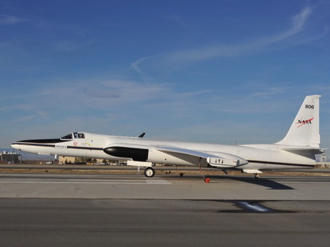
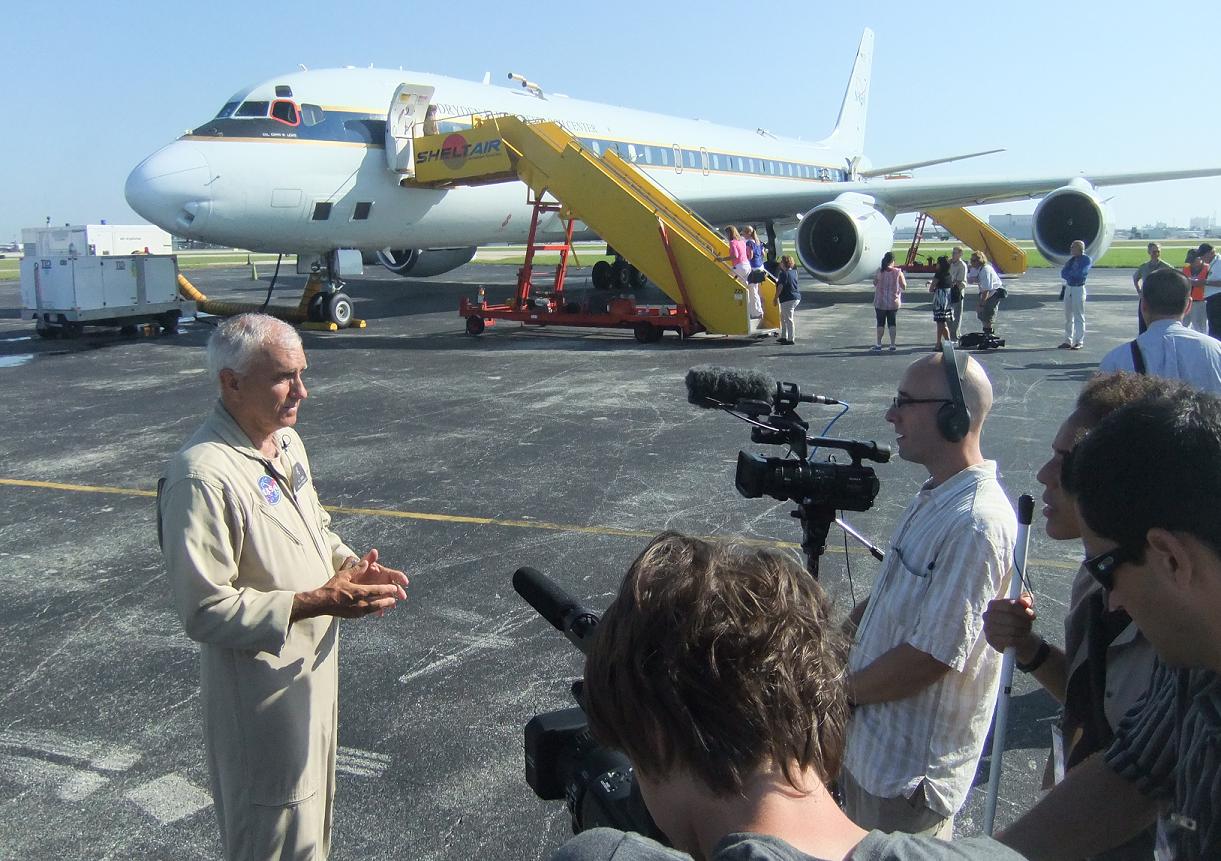
We caught up with Hoff to find out more about his involvement in a new project – a NASA-sponsored aircraft campaign called DISCOVER-AQ that will help fill in gaps between satellite measurements of pollution and data from ground-based stations. As part of the campaign, NASA will fly a large aircraft – a 117-foot P-3B – on low-altitude flights near major roadways.

What is your role in DISCOVER-AQ?
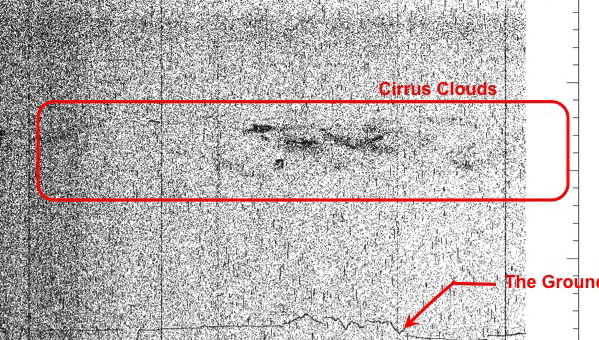
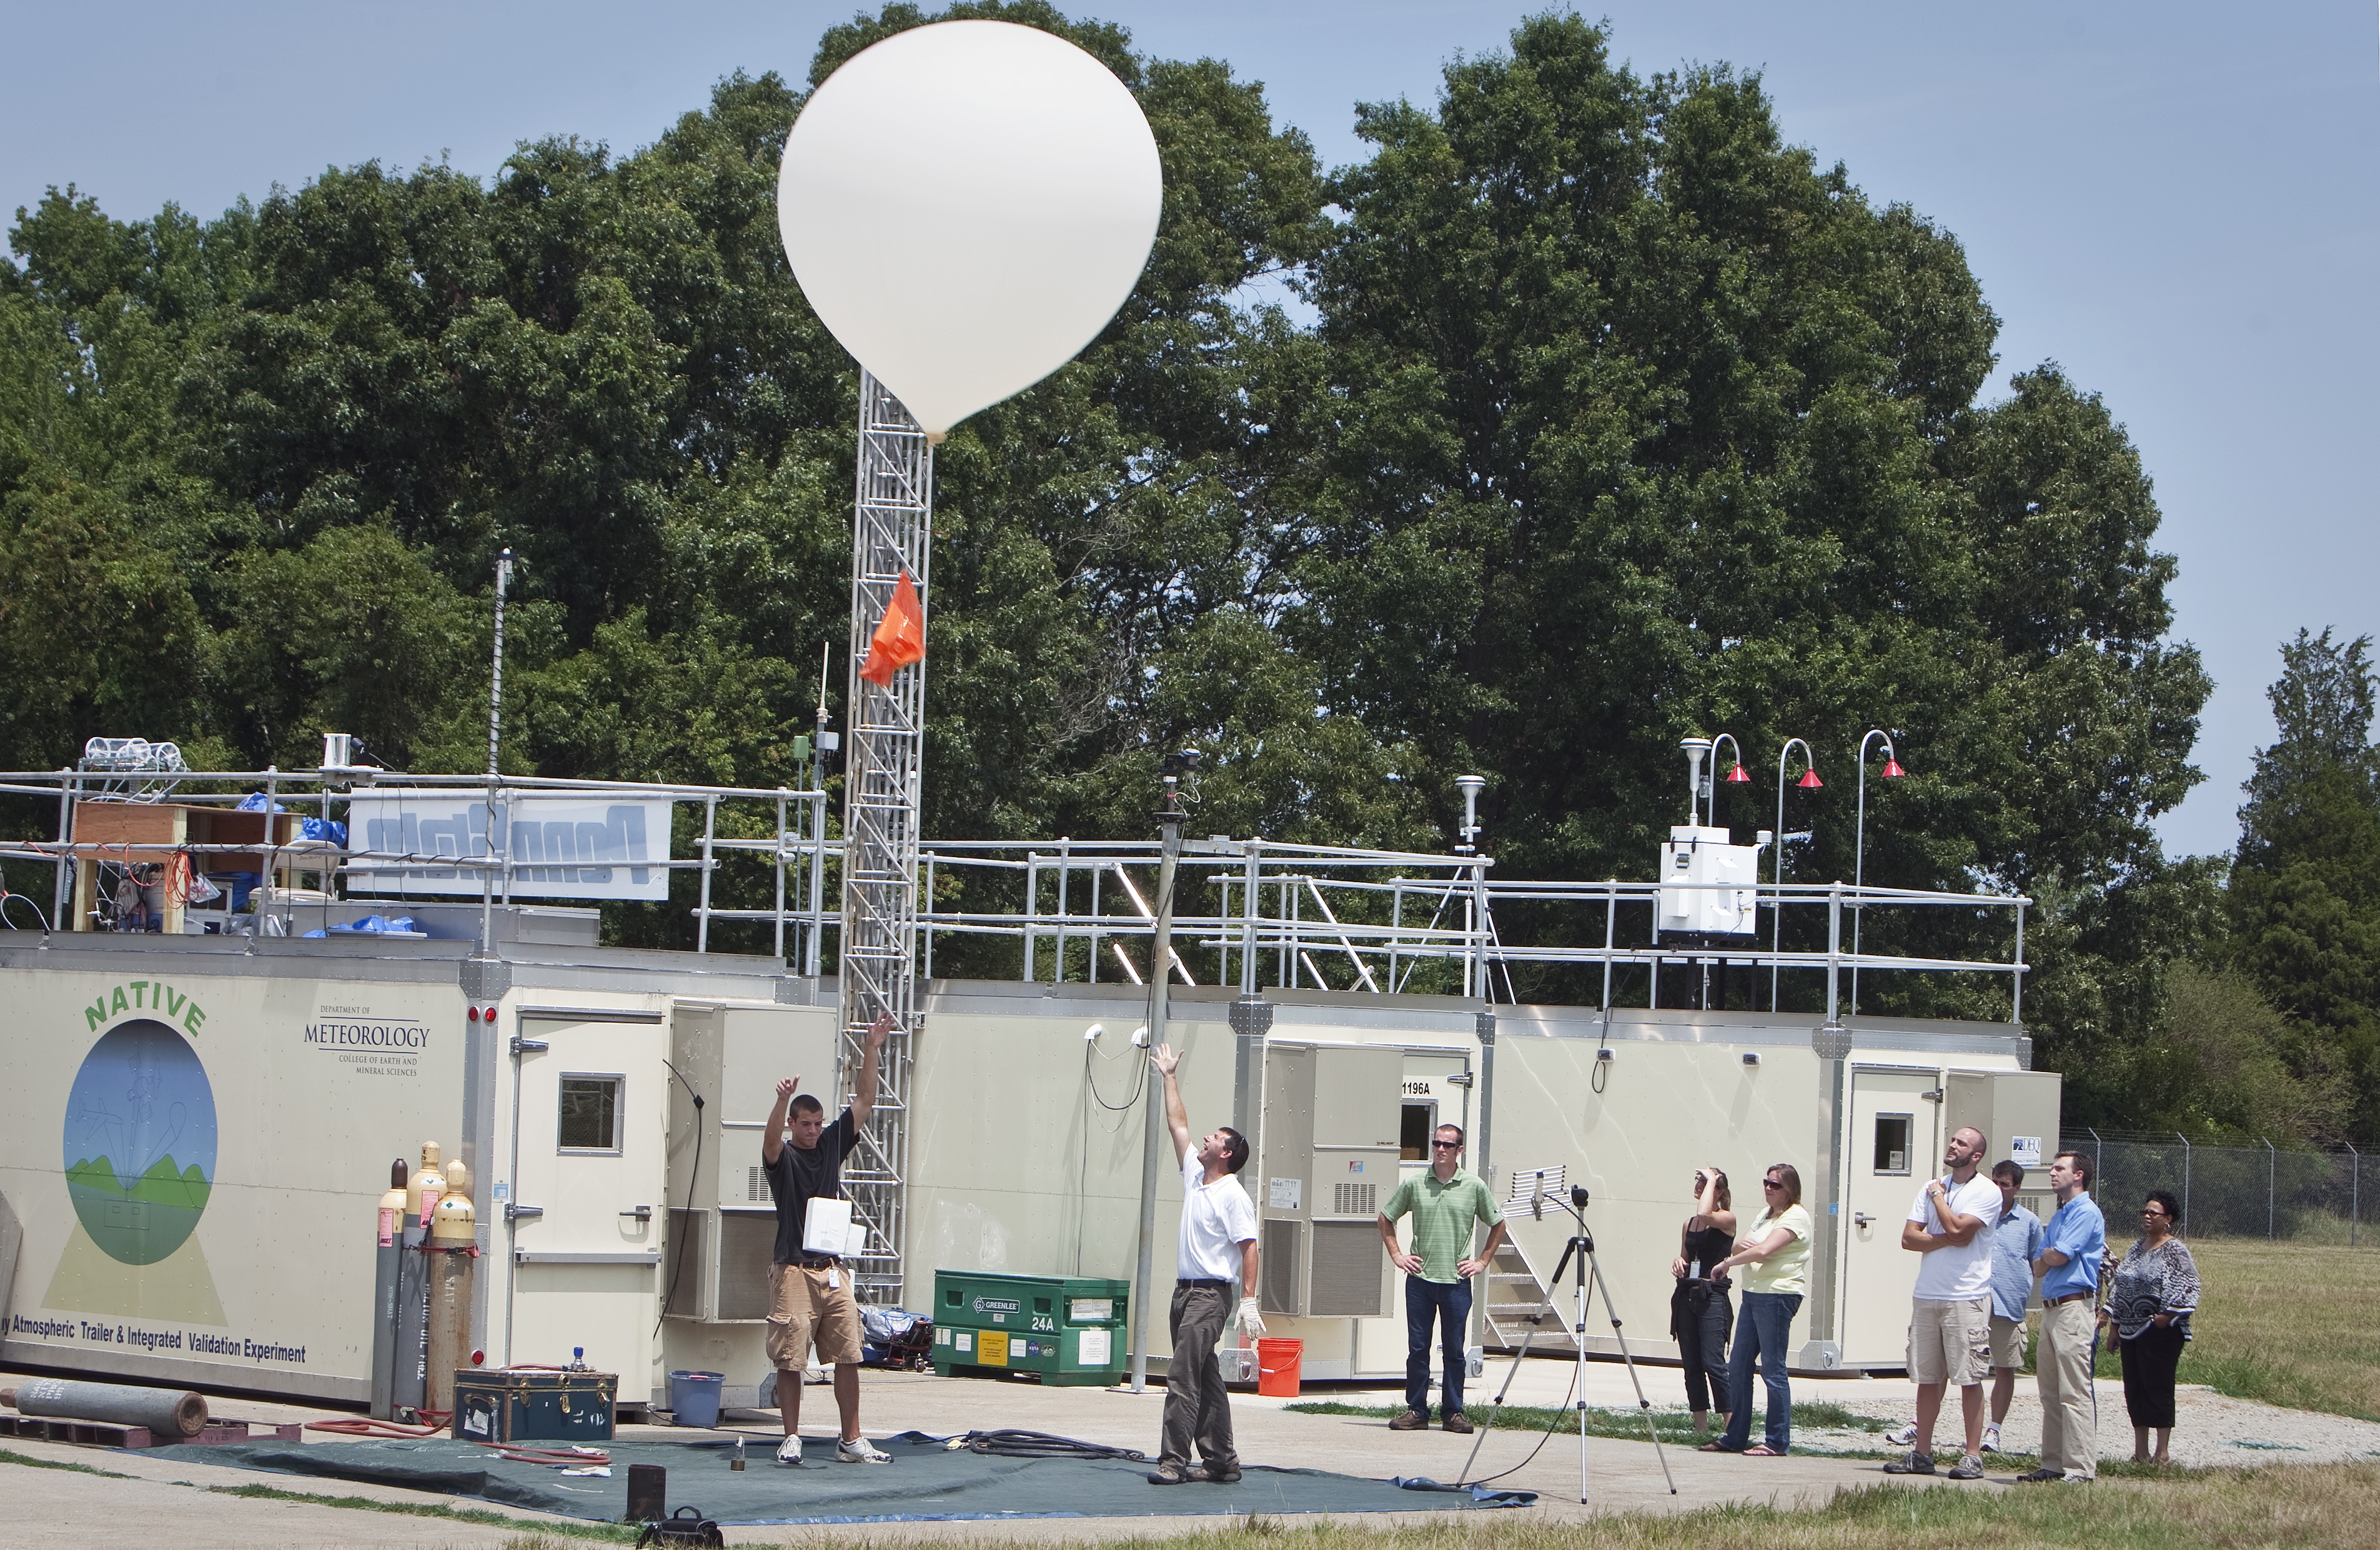
I manage a ground site at the University of Maryland, Baltimore County (UMBC) that will be part of the campaign. At UMBC, we use lidar, a type of laser, to create vertical profiles of pollutants in the atmosphere. We plan to make lidar measurements at the same time that NASA satellites and aircraft fly overhead and measure pollution from above. The idea is that the ground stations will help validate the satellite and aircraft measurements and give us a more accurate three-dimensional view of air pollution.

What are the main pollutants that you’ll be focusing on during the campaign?
In the summer in Baltimore, there are two pollutants of importance – ozone and particulate matter. Both can cause health problems. On bad air days, we see increases in the number of asthma incidents, cardiopulmonary problems, and heart attacks.


  Baltimore skyline on a clear day.                                                      
Baltimore skyline on a hazy day.   

Where does ozone come from?
Sunlight reacts with certain pollutants – such as nitrogen dioxide, formaldehyde, and other volatile pollutants – in a long chain of reactions to produce ozone. Combustion engines, power plants, gasoline vapors and chemical solvents are key sources of the precursor gases.

What about particulate matter?
There’s a range of particulate in the air. In Baltimore, about 30 to 60 percent of the mass of particles in the air that we worry about are sulfates – small particles generated by emissions of sulfur dioxide. Coal-burning power plants, smelters, industrial boilers and oil refineries release most sulfur dioxide. The other 30 to 60
percent, depending on the day, is usually organic particles. Organics come from vehicle exhaust, evaporating paints, and various commercial and industrial sources. Vegetation also produces a significant amount of organics. The remainder is usually a mixture of dust, sea salt and nitrates. 

Is that a fairly typical mixture of pollutants?
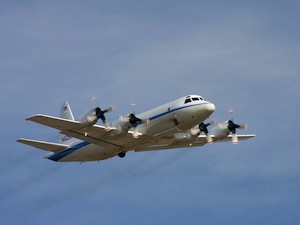
Yes, for a large cities along the Mid-Atlantic and in the Northeast. There are certainly regional differences. There are fewer sulfates in California, for example, because they cleaned sulfur out of their fuels. You see more dust in the West, more organics in the Southeast. You see high levels of certain industrial pollutants over cities like Houston where you have a robust petrochemical industry.

Is most of Baltimore’s pollution local or does it blow in from elsewhere?
We think about half of it comes in from the west over the Appalachians. Some of it comes up from Washington, and some, of course, is local.

Tell me something interesting about air quality in Baltimore.
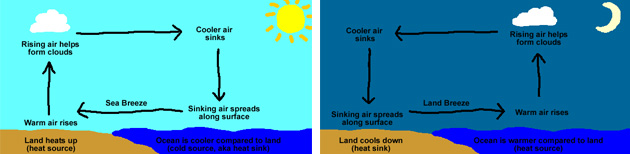
The role of the Chesapeake Bay and the “bay breezes” are worth mentioning. If you have an urban area right next to a body of water, like we do with the Chesapeake, you have the sun beating down creating very hot surfaces and upward transport that produces winds that circulate air between the water and the land. If you’ve been down to the beaches in the summer, you’ve probably noticed that there’s often a breeze coming off the water during the day. At night, it’s the opposite. Polluted air flows off the land and pools over the water.

Isn’t it good that polluted air pools up over the water rather than the city at night?
Not really because it comes back over land the next afternoon. There are actually Maryland Department of the Environment monitoring sites up at the top of the Bay that get higher concentrations than anywhere else in the state because of the bay breezes and the way the wind flow pinches at the top of the Bay. For example, the monitoring station at Edgewood, which is about 20 miles northeast of downtown Baltimore, tends to get hit particularly hard by bay breezes. DISCOVER-AQ is going to fly aircraft in that area, and the campaign should help us understand the full three-dimensional spatial picture over the Bay.

I’ve heard that the highest pollution levels can actually occur in the suburbs instead of directly over a city core. True?
That’s true for certain pollutants, like ozone. Ozone requires nitrogen dioxide, organic compounds, and sunlight to form. However, the process doesn’t happen immediately. It takes a few hours for the air to stew enough for ozone to form. When the wind is blowing through an urban area you can have your highest concentration of ozone downwind of a city by 20 to 30 miles.

Meaning rural landscapes don’t necessarily have pristine air?
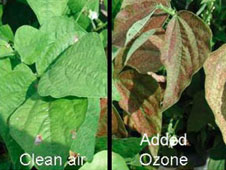
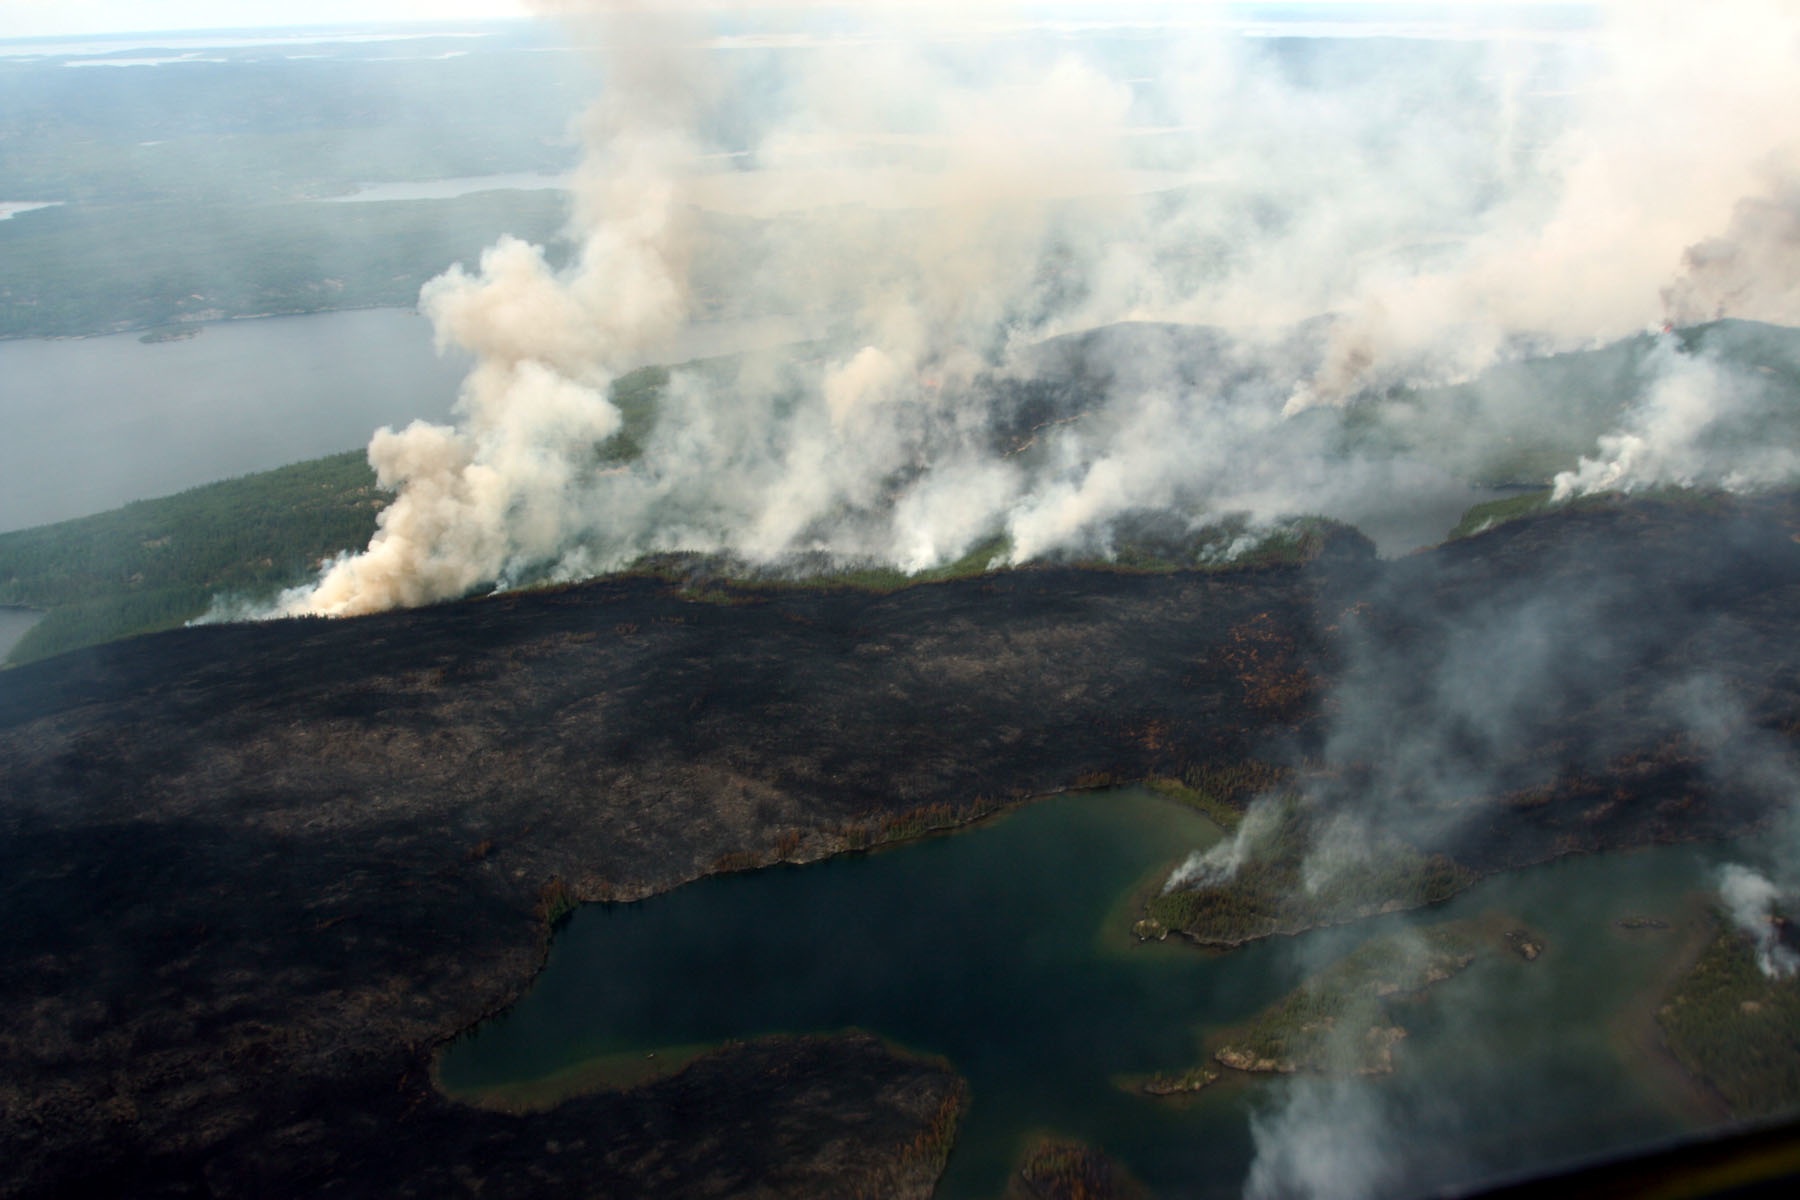
No. In fact, farms in rural areas downwind of cities can have problems with ozone because ozone damages plant health as well as human health. Beans, for example, are highly sensitive. If ozone levels get too high, they start to get brown blotches on their leaves.

I know there are networks of ground-based sensors to measure ozone near the surface. Is it possible to measure ozone from space?
A spaceborne measurement of ozone at the ground would be a great thing, but it is still a real challenge. Much of the ozone we have on the planet is high in the atmosphere in a layer of air called the stratosphere. It’s about 15 miles up, and it’s hard to see through the stratosphere with satellite instruments because it is so thick. You could say getting a good ozone measurement is a holy grail right now for NASA and the air quality research community. We’re hoping that DISCOVER-AQ will get us closer.

Aircraft will also be flying over highways during the campaign. Why?
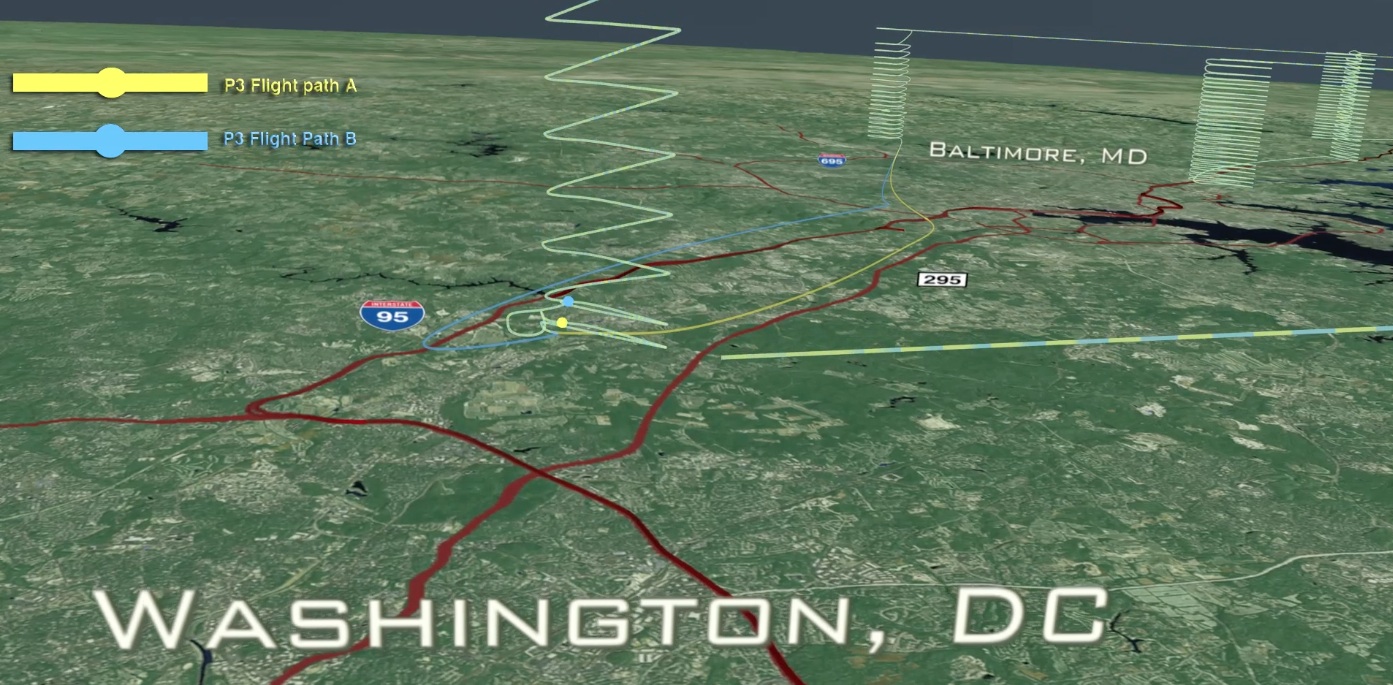
We know that transportation is a major source of pollution in the Baltimore area. I-95 is a big transportation corridor, and one of the things we want to look at with DISCOVER-AQ is the nitrogen dioxide released by combustion engines. There are very few nitrogen dioxide ground instruments in the area, so we’re flying over the highways to see if we can pick out a signal. We’ve been able to start measuring nitrogen dioxide from space in the last few years, but we can improve those measurements by validating them with ground data.

Credit information. Text by Adam Voiland. Flight tracks visualization by the Scientific Visualization Studio. NASA P-3B shot available here. Baltimore hazy/clear comparison from CamNet. Sea breeze illustrations from NOAA. Ozone-damaged leaf shot available here.

Flying High with MABEL

Scientists made a series of high-altitude flights this month from NASA’s Dryden Flight Research Center in Palmdale, Calif., demonstrating the scientific feasibility of surface elevation measurements to be made by one of the agency’s future Earth observing satellites, the Ice, Cloud and land Elevation Satellite-2 (ICESat-2). The first image (above) returned from a flight Dec. 8 clearly shows a layer of cirrus clouds and a high density of data points outlining surface elevation over California. Data in the image are preliminary and not for scientific use.

The data are from the Multiple Altimeter Beam Experimental Lidar (MABEL) instrument, assembled by a team led by ICESat-2 instrument scientist Matt McGill at NASA’s Goddard Space Flight Center in Greenbelt, Md.

Tucked into the nose of the ER-2 aircraft (right) MABEL flew at an elevation of 65,000 feet (more than 12 miles) over five targets across the U.S. Southwest collecting surface elevation information similar to what will be collected by ICESat-2, scheduled for launch in January 2016.

“These were engineering test flights with intelligent science targets,” said Kelly Brunt, a polar scientist from Goddard who was in the field as a science liaison for flight planning. “We wanted to hit spectrum of targets that represent what the scientists are interested in, such as ocean water, fresh water, trees, snow, steep terrain and salt flats.

“The density of data collected is astounding, and will allow us to characterize what we see from space,” said Thorsten Markus, ICESat-2 project scientist and head of the Cryosphere Branch at Goddard.

To learn more, visit poster session C41A, “Measuring Earth’s Third Dimension: ICESat, IceBridge, CryoSat, and Beyond,” at 8 a.m. on Thursday, Dec. 16 at the 2010 AGU fall meeting in San Francisco, Calif.

–Kathryn Hansen, NASA’s Earth Science News Team

NASA's AVIRIS Instrument Highlighted During AGU Oil Spill Session

Some 25 billion tweets were sent in 2010, and surprisingly Lady Gaga didn’t dominate the list.  Instead, it was the summer’s Deepwater Horizon oil spill that inspired the most activity, according to data released by Twitter this week

Meanwhile, six months after the spill, and long after media and twitter chatter about it has subsided, scientists continue to parse out the details of the unprecedented event. I spent the afternoon yesterday in a session at AGU that highlighted the incredible array of resources the scientific community flung at the problem.

NASA is known best for its satellites (in this case, the iconic imagery of the spill captured by the MODIS instruments). Yet, as we’ve pointed out on this blog before, satellites aren’t the only tool that NASA’s earth scientists have at their disposal. In the midst of the oil spill crisis, NASA scrambled a number of aircraft bearing instruments that have a played key roles in sorting out the dynamics of the spill.

During the AGU session, Michael Freilich, director of NASA’s earth science division, emphasized the novel contributions of an airborne instrument called the Airborne Visible/Infrared Imaging Spectrometer (AVIRIS), a spectrometer that flew aboard the ER-2, a civilian version of the famous U-2 spy planes, and the Twin Otter, a much smaller propeller plan that flies at a lower altitude.

At AGU, Freilich outlined the AVIRIS contributions:

Flights were planned to do coastal ecosystem work because the hyperspectral measurements can be used to classify vegetation and to determine the impact of the oil on that vegetation, as well as to map the volume of the oil in the upper ocean over the oceanic portions of the slick. In a couple of weeks, AVIRIS flights took as much data as we usually take in an entire year or more. And whereas it usually takes two-to-three months for the AVIRIS data to be processed, calibrated, and distributed, the team working at Johnson, very early on, got it down to providing imagery and calibrated radiances to between 6 to 12 hours after a flight. Those measurements were then given to NOAA and USGS scientists, as well as analyzed by NASA and academic scientists.

The director of the United States Geological Survey Marcia McNutt also praised AVIRIS during the session for its ability to image oil on the surface, and noted that AVIRIS helped determine the lower bound on the amount of oil released. “[It] did an excellent job of determining the amount of oil that was likely to impact the shoreline,” she said. “We are very grateful for the support we received from NASA for this work,” she said.

For more information on the AVIRIS instrument and its Deepwater Horizon oil flights: see the Jet Propulsion Laboratory AVIRIS instrument page, this news feature about AVIRIS flights, and this JPL Photojournal page. There’s a great deal of raw imagery captured during various AVRIS flights here.

–Adam Voiland, NASA’s Earth Science News Team


AVIRIS image above courtesy of NASA’s Jet Propulsion Laboratory. For more detailed caption information, please visit this page.

Speaking of Contrails…

The prospect of a renegade missile transfixed newscasters last week after a videographer captured imagery of an unusual contrail near the coast of California. The now notorious plume initially baffled commentators as it seemed to point vertically into space and appeared larger than a standard airplane contrail.

The reality, which trickled out in the days following the uproar, turned out to be far less dramatic than some of the more inventive theories circulating. Most experts now say the mysterious plume was the product of a jet. The time of day and the particular trajectory of the jet conspired to create the illusion.

Sure, it might seem like a letdown, but here at What on Earth we would argue that jet contrails are perfectly fascinating in their own right. Where on Earth do they come from? The cirrus-cloud like condensation trails form when water vapor condenses and freezes around tiny airborne particles called aerosols that spill from jet engines. 

NASA Langley Research Center, in Hampton, Va., hosts a thorough website that’s well-worth a look for those who happen to be contrail-curious. Langley points out, for example, that contrails are hardly monolithic, noting that there are actually three major varieties of contrails: short-lived, persistent, and persistent spreading.  Here’s how Langley describes the three types: 

Short-lived contrails look like short white lines following along behind the plane, disappearing almost as fast as the airplane goes across the sky, perhaps lasting only a few minutes or less. The air that the airplane is passing through is somewhat moist, and there is only a small amount of water vapor available to form a contrail. The ice particles that do form quickly return again to a vapor state.

Persistent (non-spreading) contrails look like long white lines that remain visible after the airplane has disappeared. This shows that the air where the airplane is flying is quite humid, and there is a large amount of water vapor available to form a contrail. Persistent contrails can be further divided into two classes: those that spread and those that don’t. Persistent contrails look like long, narrow white pencil-lines across the sky.

Persistent spreading contrails look like long, broad, fuzzy white lines. This is the type most likely to affect climate because they cover a larger area and last longer than short-lived or persistent contrails.

Meanwhile, Our Changing Planet, a book co-edited by a number of NASA scientists that offers a good overview of remote sensing, devotes a chapter to climate impacts of the ubiquitous artificial clouds. Via Our Changing Planet:

Persistent contrails also play a role in climate because they reflect sunlight and trap infrared radiation just like their naturally formed cousins.  Thus, the presence of a contrail cluster in an otherwise clear sky can diminish the amount of solar energy reaching the surface during the daytime and increase the amount of infrared radiation absorbed in the atmosphere at all times of day. Currently, the overall impact appears to be a warming effect, but research is continuing to unravel the role of this phenomenon in climate change.    

Another interesting tidbit from Our Changing Planet:

Persistent contrails can often grow into natural-looking cirrus clouds within a few hours, a phenomenon that is best observed from space.  Although they typically last for only 4-6 hours, some clusters have been observed to last more than 14 hours and travel thousands of kilometers before dissipating. These persistent contrails are estimated to have caused cirrus cloud cover to rise by three percent between 1971 and 1996 over the United States and are well-correlated with rising temperatures, though not the only cause of them. Increasing traffic in nearly every country of the world will cause a rise in global cirrus coverage unless the upper troposphere dries out or advances in air traffic management and weather forecasting or in aircraft propulsion systems can be used to minimized contrail formation.   


Indeed. Take a look at this mesmerizing data visualization of just a mere day of air traffic…


–Adam Voiland, NASA’s Earth Science News Team


Photo above of contrails in a star pattern by John Pertig, courtesy of NASA Langley Research Center.

Piloting Through Hurricane Earl

NASA scientists are deep into a two-month airborne hurricane research campaign known as GRIP (Genesis and Rapid Intensification Processes). GRIP is designed to put multiple aircraft, outfitted with scientific instruments, above a hurricane at the same time, allowing scientists to observe these destructive storms for longer periods than ever before. GRIP is breaking new ground by flying the unmanned Global Hawk at 60,000 feet above the surface, the first time NASA has used this drone in a hurricane field campaign.

But the NASA’s DC-8 and WB-57 planes get to a hurricane the old-fashioned way — with pilots in the cockpit. Dryden Flight Research Center DC-8 pilot Dick Ewers spoke to the media in Ft. Lauderdale, Fla., last week about what it takes and what it’s like to fly into the heart of a storm that your average pilot would try to avoid entirely. What On Earth was on hand to get some of his thoughts.

What should a first-time rider expect on a DC-8 flight through a hurricane?

It’s pretty bumpy at times, but most of the time it’s a lot of clouds. Then, as we get closer, we’ll go into some bumps and turbulence. As we break out into the eye, hopefully we’ll be able to see the sky above and all the way down to the water below. That’s very nice. All the sudden you’re out of the car wash and you’re looking down and can see what’s happening below. Normally it’s about 10 to 15 minutes of excitement per hour.

What’s the strongest Earl was when you flew through it?

At our level it was about 100 mph, but the worst part is down below. We’re above where it’s very intense. And when you’re flying in an airplane and through an airmass, and the airmass is moving at 100 mph, you don’t really notice that. But what you do notice is when you come out, the winds drops off and the airplane rises and falls based on what’s happening around it. So the plane isn’t able to be very level at times.

What’s your strategy to make sure the plane rides smoothly?

Most of the time it’s very solid. It’s bumpy but it isn’t weaving back and forth.

Even in 100 mph winds?

Oh, yeah. It goes right through it.

Is there a level of risk involved?

My job is to take the risk out of it. My job is to make sure what I do is safe and doesn’t put the scientists or the instruments at risk. My whole mission is to make sure that plane is back here tonight. Where the risk and danger is, I will take precautions and go around it and do something to avoid something where danger is involved.

How many flights did you make through Earl?

This will be the fourth and final flight. We thought it was declining yesterday, but it’s stronger this morning, so we’re going back out.

How was the view of the eye?

There are rare storms that are very crystal clear. This one had a lot of strataform in there, so there were clouds around and some clouds above us, so it wasn’t a pristine, clear blue eye. But you were able to see daylight above us and the water below us. I want to say it was 20 to 25 miles wide inside. You wouldn’t want to be in a boat down there.

— Patrick Lynch, NASA’s Earth Science News Team

Images taken by Patrick Lynch during the Sept. 2 GRIP media day in Ft. Lauderdale, Fla.

How to Work at NASA Without Working for NASA

Ron Cohen, Anne Thompson and Ed Zipser all have two things in common: All three are playing important roles in NASA research campaigns, and none of them work for NASA.

NASA is one of the world’s largest Earth science research institutions, but it didn’t achieve that status solely through the work of its own employees. Instead, NASA’s Earth science field campaigns and satellite missions are constructed so that the agency can tap the best person – whether a university professor, a NASA staffer, or a scientist in another government agency – for any specific job.

The result is a grassroots approach that focuses on what the community thinks is the most important science, rather than a top-down approach.

Take Cohen, head of the Atmospheric Sciences Center at University of California (Berkeley). NASA can gain access to his expertise, and Cohen can work on large-scale research campaigns that a single university likely wouldn’t have the resources to conduct.

“The NASA facilities are really first-class,” Cohen said. “Being able to take advantage of the NASA aircraft to reach rarely studied places in the world is unrivaled. Bringing together the best people from the scientific community allows us all to work much more effectively than if we were try to do it alone.”

Cohen is working on a new “venture class” campaign called DISCOVER-AQ, which is focused on improving satellite measurement of air quality at the Earth’s surface. But his history with NASA goes back 20 years, and includes work on the Ozone Monitoring Instrument (OMI) on the Aura satellite and other aircraft campaigns.

Thompson, a professor of meteorology at Penn State, is also working on DISCOVER-AQ. Penn State’s NATIVE — Nittany Atmospheric Trailer and Integrated Validation Experiment — has been stationed at Langley Research Center the past two summers to measure a variety of air quality parameters, and has been deployed as far as Yellowknife, Canada, near the Arctic Circle, for the ARCTAS field campaign in 2008. Thompson joined the Penn State faculty five years ago, after an 18-year career at Goddard Space Flight Center.

Working with NASA keeps Thompson and her students engaged with the global science community. Getting her students in the field to make regular measurements helps them understand the importance of sustained observations of the environment.

“I want them to be able to think about working for NASA, either directly or for a contractor,” Thompson said. “It’s real work, real training. It gets young fresh faces into NASA. The synergism is very important.”

Zipser, a hurricane expert at the University of Utah, is taking part this summer in his 10th NASA field campaign since 1993. As one of the leaders of the Genesis and Rapid Intensification Processes (GRIP) experiment, Zipser is helping develop the flight plans for multiple aircraft that will fly over tropical storms as they develop.

“Working with NASA has given me, my students, and colleagues a broader knowledge base, a broader group of experts to work with,” Zipser said. “And I’ve been able to give a little back to NASA and use my horse-sense of storms to develop flight plans.”

Patrick Lynch, NASA’s Earth Science News Team

–Penn State researchers release an ozonesonde at Langley Research Center (top, courtesy of Sean Smith, LaRC); forest fire near Yellowknife, Canada (bottom, courtesy NASA).

A Tale of Two Kenyas: Contradictions in Air Quality Stirred Researcher’s Pursuit of Atmospheric Science

Charles Kironji Gatebe’s early years read like a cliché. He grew up barefoot and poor in the small Kenyan village of Kenda at the foot of Mount Kenya, the son of coffee sharecroppers who raised their family on pennies a day. He walked nearly 10 miles each way to school for nearly a decade. He lacked adequate texts and other school supplies.

What he didn’t lack on those long daily walks was clean air. It was the contrast between the clear skies of his boyhood home and the smog and fumes of the nation’s capital, Nairobi, that stirred within Gatebe a strong passion for science. In 1979, Gatebe (right) was selected to represent his elementary school at a national convention to celebrate the United Nations Educational, Scientific and Cultural Organization’s (UNESCO) International Year of the Child. He later won a physics prize in high school in 1984 from the Kenya Secondary Schools Science Congress. He enjoyed independent research so much that his physics teacher would allow him to conduct his own experiments in the lab alone at night or on weekends.

Gatebe’s passion, matched with natural aptitude, eventually led Gatebe to degrees from Kenya’s University of Nairobi and the University of the Witwatersrand in South Africa. Now a climatologist with a joint appointment at NASA’s Goddard Space Flight Center and the University of Maryland-Baltimore County, Gatebe has fashioned an award-winning career – including the rare honor of the World Meteorological Organization’s Young Scientist Award in 2000, and awards from the Kenyan government, German Academic Exchange Services, SysTem for Analysis, Research and Training (START), and the International Program in the Physical Sciences — for his innovative research on air pollution and its sources and effects on his country.

“Air quality in Kenya’s villages was and continues to be significantly different from the smog encountered in Nairobi. They vary so much that it seems you’re virtually in two distinct countries,” said Gatebe when asked to share what sparked his study of Kenya’s air pollution. During his graduate studies at the University of Nairobi, he devised a few climate projects that unexpectedly got the attention of the Kenyan government and United Nations Environment Program. One of those was a modeling experiment to measure vehicle pollution and predict pollution levels from the average speed and number of cars in use.

Gatebe also investigated the origins of the city’s air pollution; that is, how much Nairobi’s citizens and industry generated compared to what was transported in from other countries. “Charles’ Kenyan air quality research was quite breathtaking and significant,” said Michael King, a senior atmospheric scientist at the University of Colorado and former senior project scientist at NASA Goddard who recruited Gatebe to NASA in 1999. “It involved him regularly hiking to the top of Mount Kenya – which sits roughly on the equator — and collecting air samples of atmospheric aerosol particles that he analyzed for their composition to distinguish dust and other particles from local sources from pollutants arriving from as far away as southern Africa, India and the Sahara.”

The acclaim from the study came as a surprise, Gatebe says, but motivated him to stay the course. He knew he’d found his niche.

As a former child scientist, Gatebe is eager to inspire more kids to get involved in science. He’s dedicated himself to NASA’s Global Learning and Observations to Benefit the Environment (GLOBE) education program, and blogs about the science of current events for GLOBE’s Web site.

Gatebe’s latest work is based on what he calls an accidental discovery, not uncommon in science. In summer of 2008, he was part of a NASA field mission called Arctic Research of the Composition of the Troposphere from Aircraft and Satellites (ARCTAS). Arctic wind currents can carry a haze that affects local climate. Gatebe and colleagues flew aboard planes through smoke blown over the Pacific Ocean from land-based fires to evaluate the composition of the pollution that eventually forms Arctic haze. 

A ship passed beneath Gatebe’s plane, through his measurement field, triggering a mass of sea foam in its wake. When he later evaluated visible and near-infrared data from NASA’s Cloud Absorption Radiometer instrument that took the measurements from aboard the plane, he noticed a spike in brightness in the vicinity of the ship’s path. The bubbles in the wake increased light reflectance off the ocean.

The irony of the discovery was quite amazing to Gatebe. Ships were long thought to pollute the air and contribute to warmer climate through exhaust emissions. But they also appear to have a counterbalancing effect of cooling local ocean surfaces by as much as four percent. What he doesn’t know yet is just how much the cooling effect offsets the warming effect on the nearby environment. He hopes that others will further the work so the question doesn’t go unanswered.  

–Gretchen Cook-Anderson, NASA’s Earth Science News Team


Charles K. Gatebe (top, courtesy of C. Gatebe);  Zebras with hazy Nairobi in the distance (bottom, courtesy of Michael King).  

Soaring for Science

NASA's Global Hawk autonomous plane

The newest bird in NASA’s flock — the unmanned Global Hawk — took off at 7 a.m. Pacific time today (April 2) from Dryden Flight Research Center at Edwards Air Force Base in California. The flight is the first airborne checkout of the plane since it was loaded with 11 science instruments for the Global Hawk Pacific (GloPac) mission.

Pilots are also streamlining processes to coordinate the workload while the nearly autonomous plane is flying at altitudes above 60,000 feet (almost twice as high as a commercial airliner). Operators and mission researchers are using the day to make sure all instruments are operating properly while in flight — particularly at the cold temperatures of high altitude — and communicating clearly with the plane and ground controllers. Mission participants expect to begin collecting data when actual GloPac science flights begin over the Pacific Ocean later this month.

GloPac is the Global Hawk’s first scientific mission. Instruments will sample the chemical composition of air in Earth’s two lowest atmospheric layers — the stratosphere and troposphere — and profile the dynamics and meteorology of both. They also will observe the distribution of clouds and aerosol particles. The instruments are operated by scientists and technicians from seven science institutions and are funded by NASA and the National Oceanic and Atmospheric Administration (NOAA).

Paul Newman, the co-mission scientist for GloPac, has been blogging about the mission on Earth Observatory’s “Notes from the Field” site. Here are a few excerpts to whet your appetite…

…There is an old Latin quote: “Maxima omnium virtutum est patientia.” Or “patience is the greatest virtue.” When it comes to mounting science instruments on an aircraft, you need to continually return to that quote…

…During the integration this week, we’ve had to cut holes into the aircraft. I told Chris Naftel, the Global Hawk project manager, that we had to cut some holes into the plane for the Meteorological Measurement System. Chris replied: “I don’t want to hear anything about the holes. It pains me!” In spite of Chris’ pain, the little holes are critical for measuring winds. You’re now asking, what? Little holes? For winds? It’s actually a very slick little measurement that relies on the work of Daniel Bernoulli, a Dutch mathematician who lived in the 1700s…

Read more here …