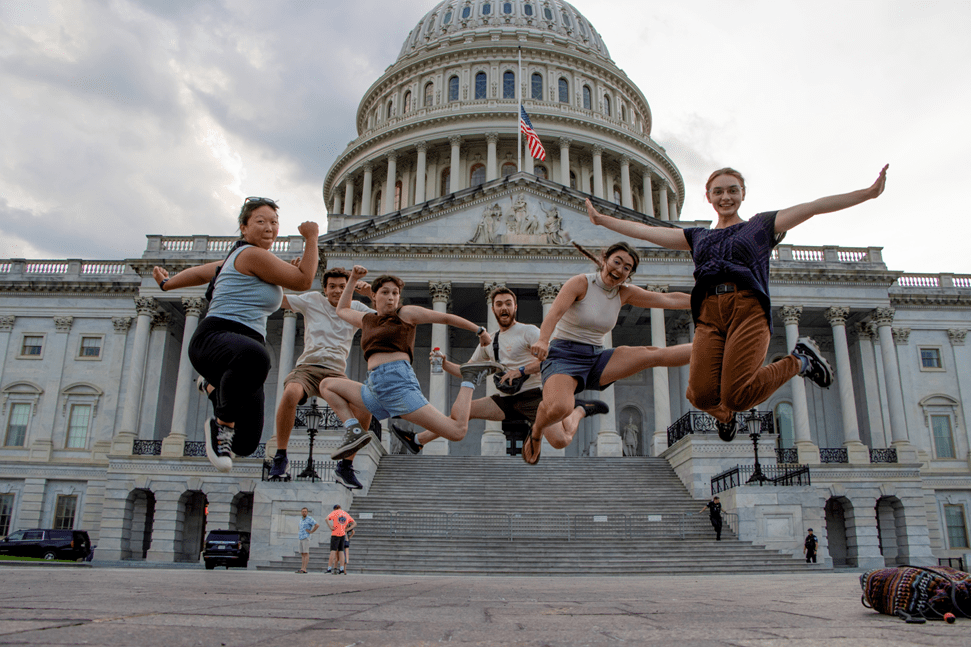
Hi, my name is Atticus and I’m a mechanical engineering student at UCLA and hobbyist photographer. The summer of 2024, I participated in NASA’s Student Airborne Research Program (SARP), an 8-week internship offering rising seniors hands-on experience as airborne scientists in training.
The program had two phases: data collection and analysis. In the first phase, we flew over the East Coast aboard NASA’s research aircraft, tracking trace gas concentrations and mapping ground topography with LIDAR, and conducting fieldwork at a saltmarsh along Virginia’s Eastern Shore. After the flights and fieldwork, we developed and completed individual research projects using the data we collected and NASA’s many publicly available datasets.
 As a mechanical engineer with little prior experience in Earth science, this was a tremendous learning opportunity and a welcomed crash course in climate change research. I learned all about the various types of scientific instrumentation, data systems, and analysis techniques, and had the chance to apply them firsthand. With lectures and interactions with faculty mentors and graduate student advisors, we received ample support to carry out our research projects while making meaningful contributions to Earth science and lasting friendships.
Between collecting air samples aboard NASA research aircraft, trudging knee deep in the mud to collect salt marsh spectra, and mapping kelp canopy from satellite imagery, here’s a glimpse of SARP 2024 through my lens.
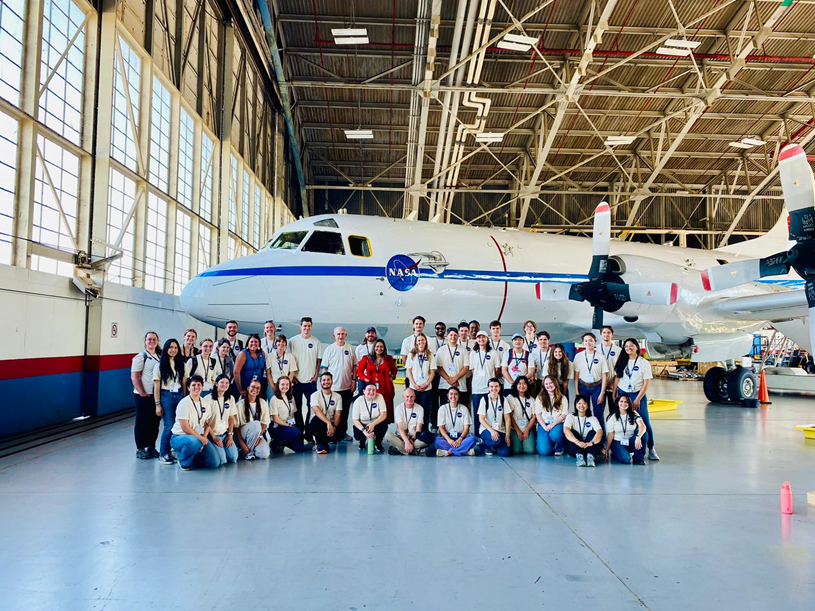
Airborne Science at Wallops Flight Facility
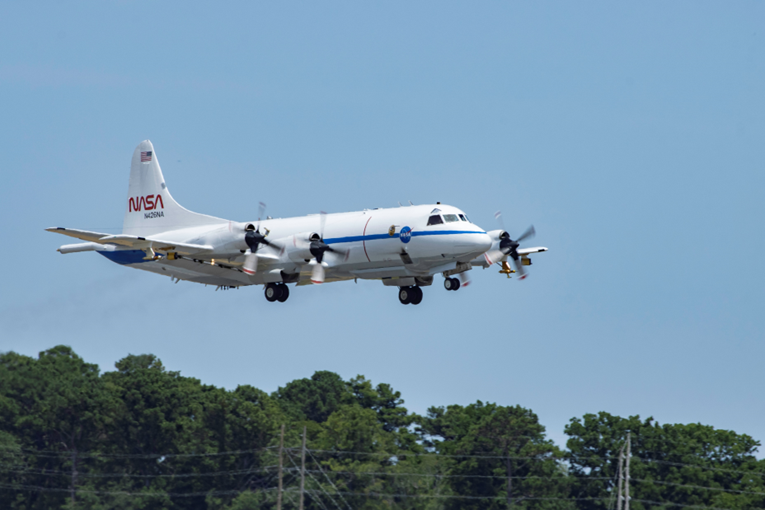
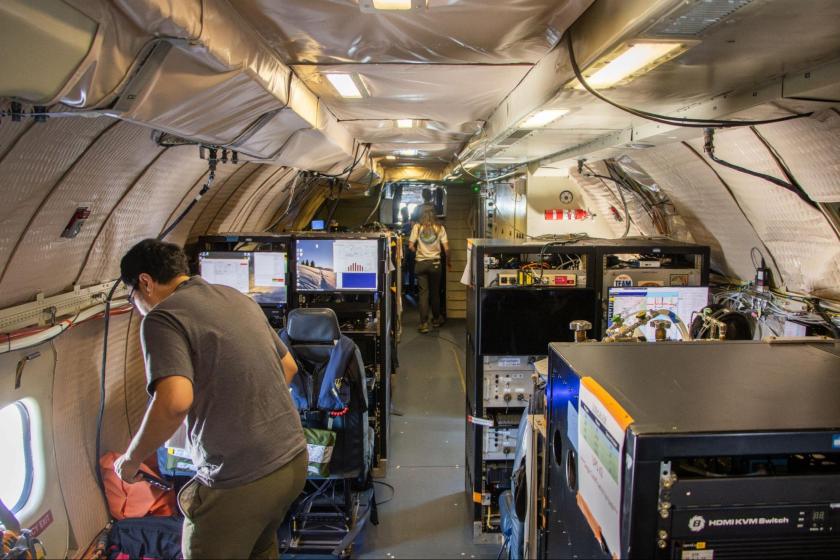
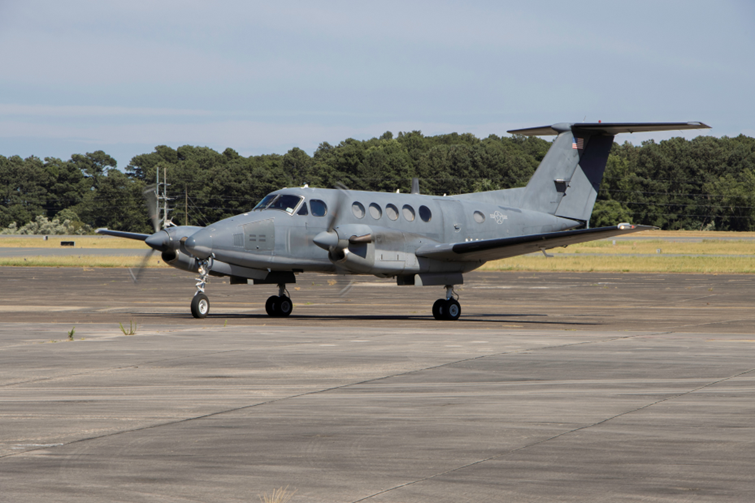
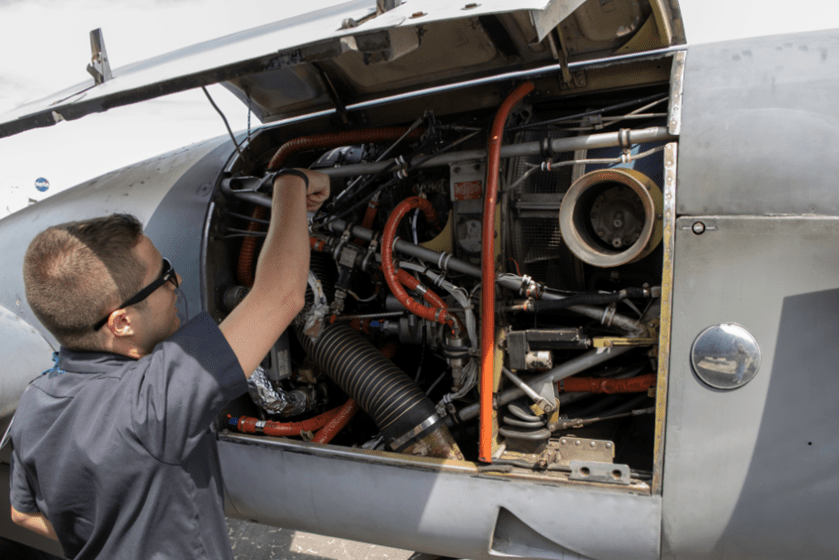
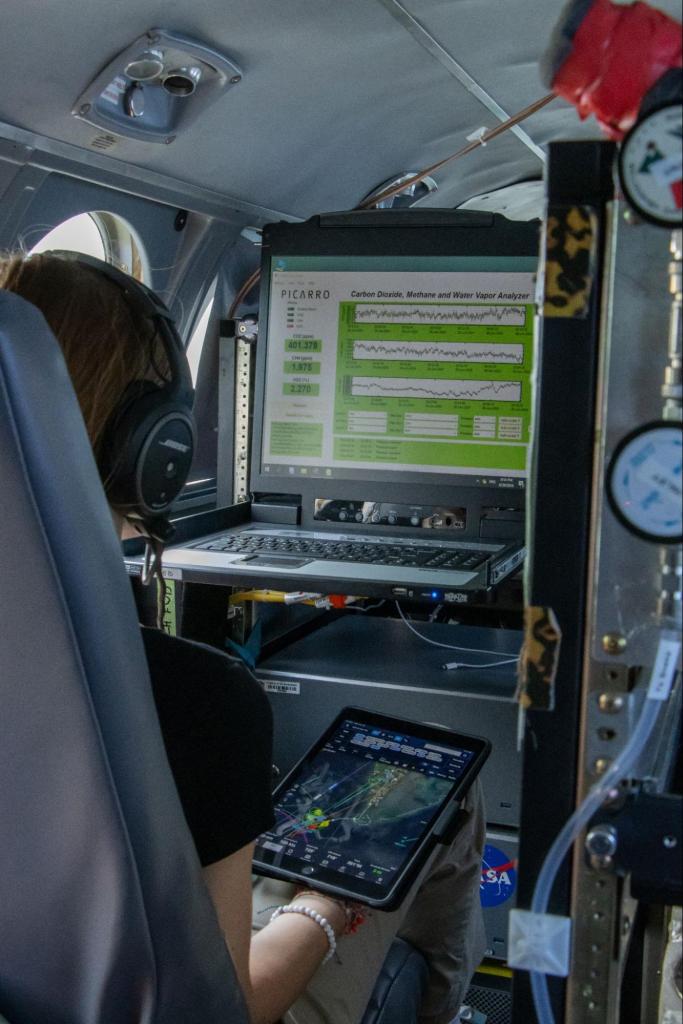
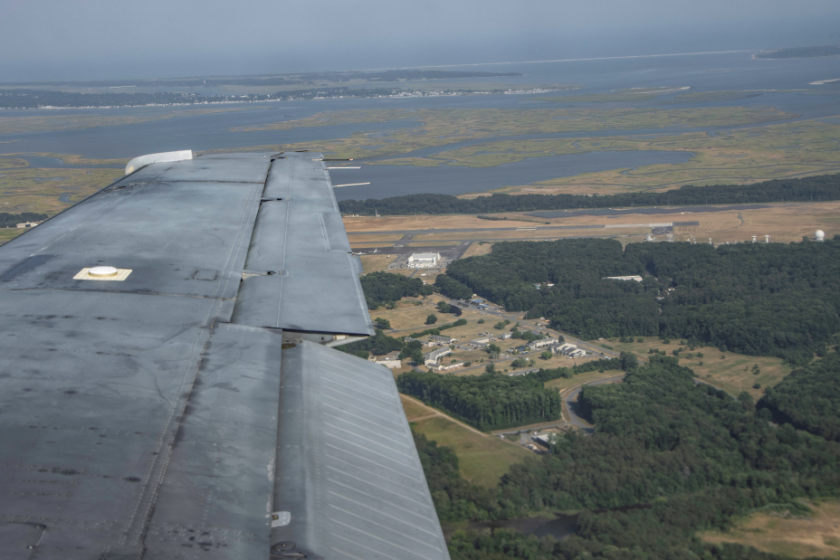
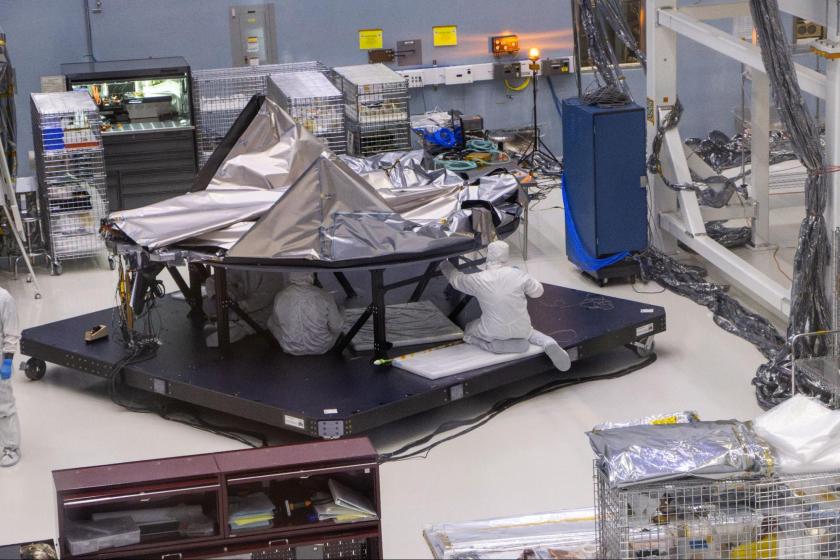
The internship began at the Wallops Flight Facility on the Eastern Shore of Virginia. We spent the first two weeks in lectures on NASA’s active research areas, attending flight and safety briefings, touring facilities, and flying aboard NASA research aircraft. For SARP 2024, we each had the opportunity to fly two or three missions on the Lockheed Orion P3 and Beechcraft King-Air B200. The P3 and B200 were both equipped with dozens of instruments that measured everything from trace gas and black carbon concentrations to ground topography and vegetation using an advanced LIDAR system. As we flew over city centers, busy highways, power plants, ocean and swamp, we tracked spikes and dips in gas concentrations and tried to pinpoint the sources and sinks.
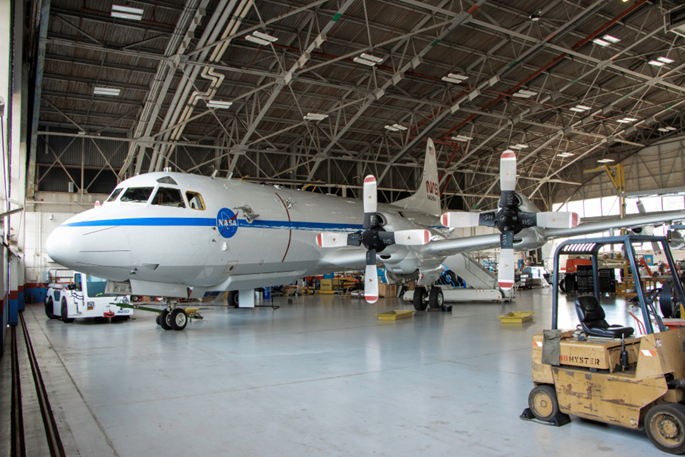
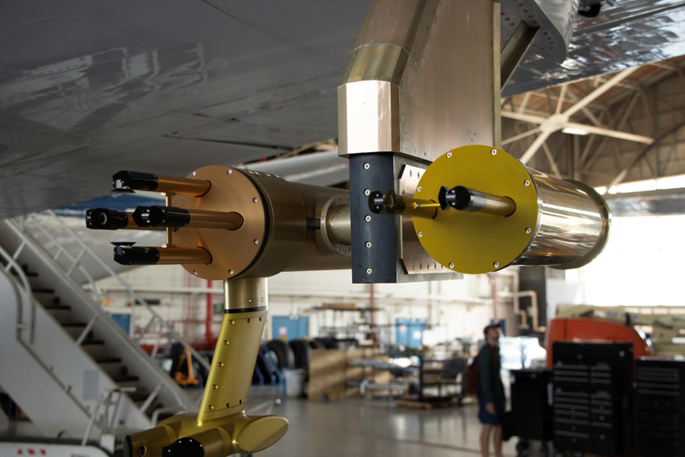
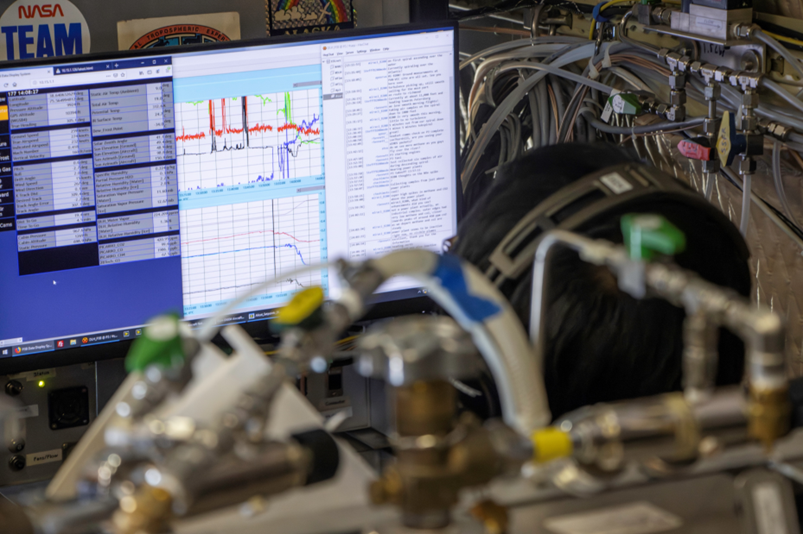
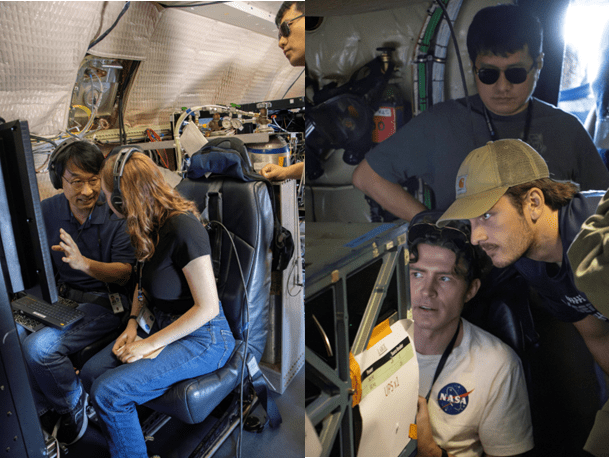

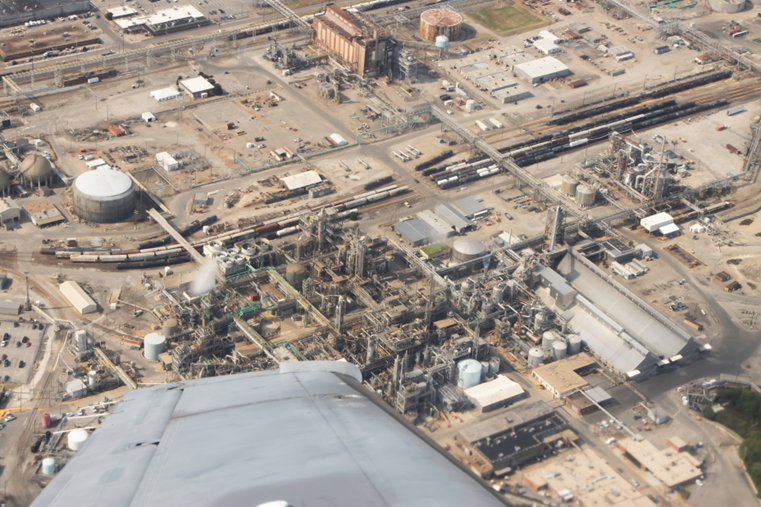
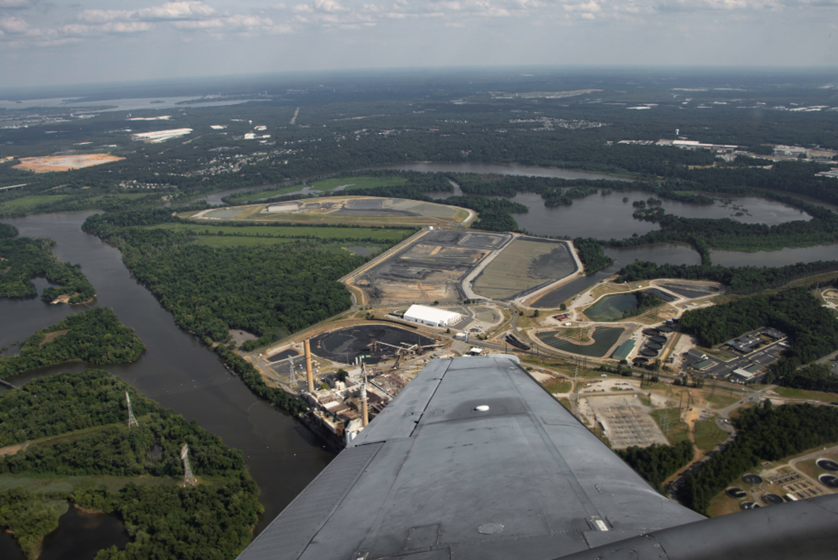
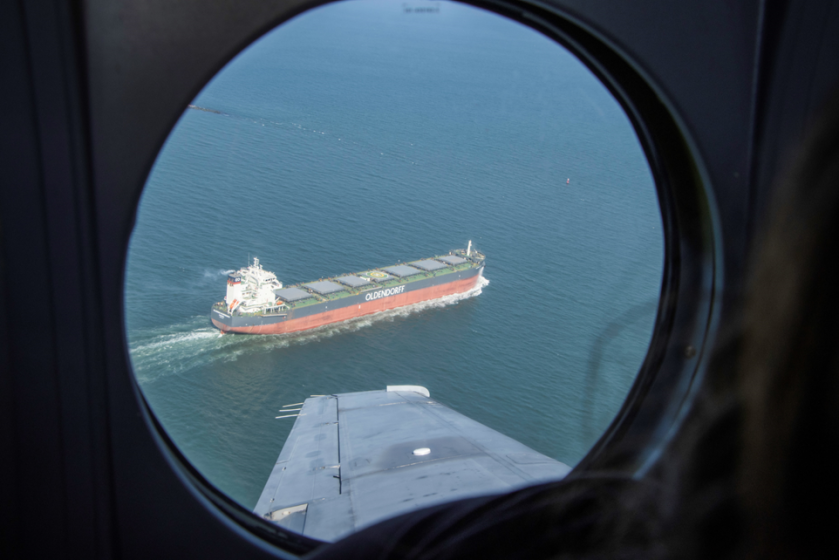
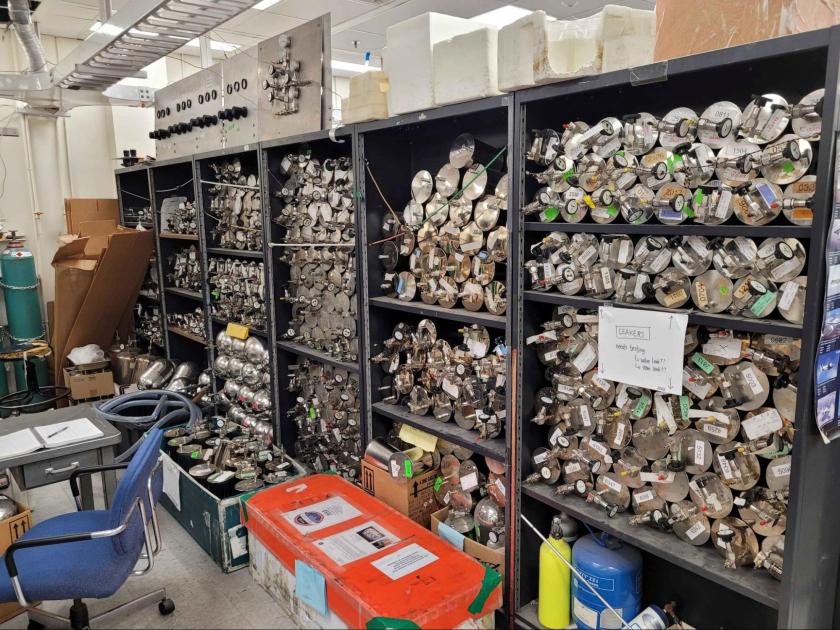
As we flew a thousand feet over power plants, factories and shipyards, we collected whole air samples upstream and downstream of the industrial sites to measure their emissions. This required careful coordination and timing as we might only be in the smokestack plume for only a second or two. These were some of the most exciting and rewarding moments of the flights.
Going into SARP, I had no idea about the role that the NASA Earth airborne science program played in climate change and pollution research. These flights shed light on a very important and unsung side of NASA, and were certainly a highlight of the internship.
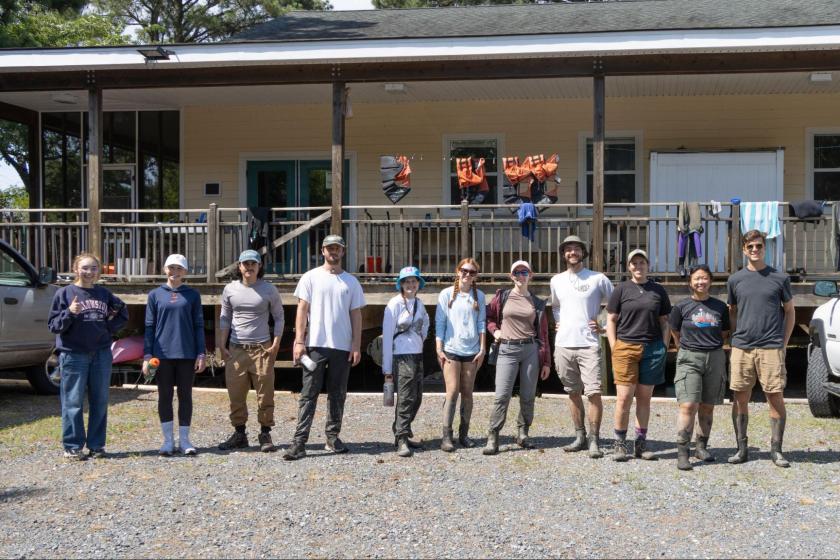
Ground Truthing and Fieldwork
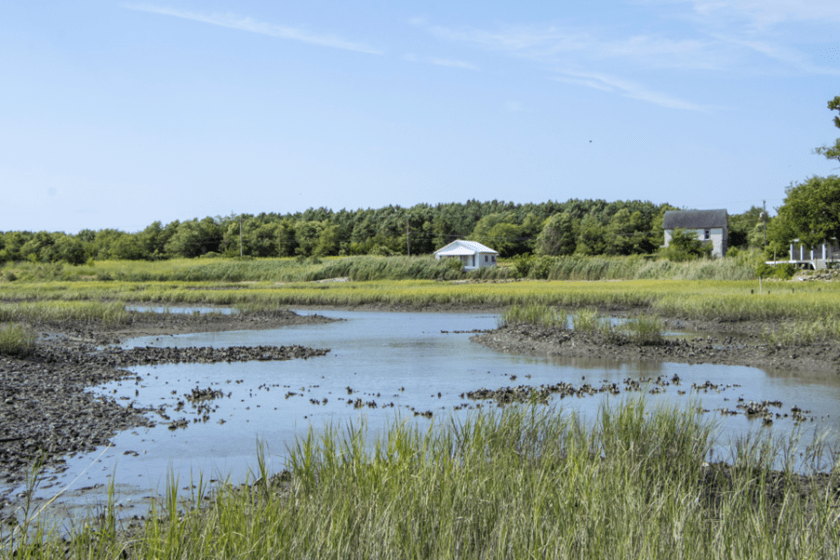
After the flights, we packed our bags and headed off to our group’s fieldwork site. As a member of the Oceans group, I went to the Virginia Coastal Reserve LTER (Long Term Ecological Reserve) on the Eastern shore of Virginia. Here we learned about the salt marshes and barrier islands and how they protect our environment against storm surge, create nurseries for marine life, naturally filter pollution from our oceans, and support Virginia’s oyster and clam fisheries.
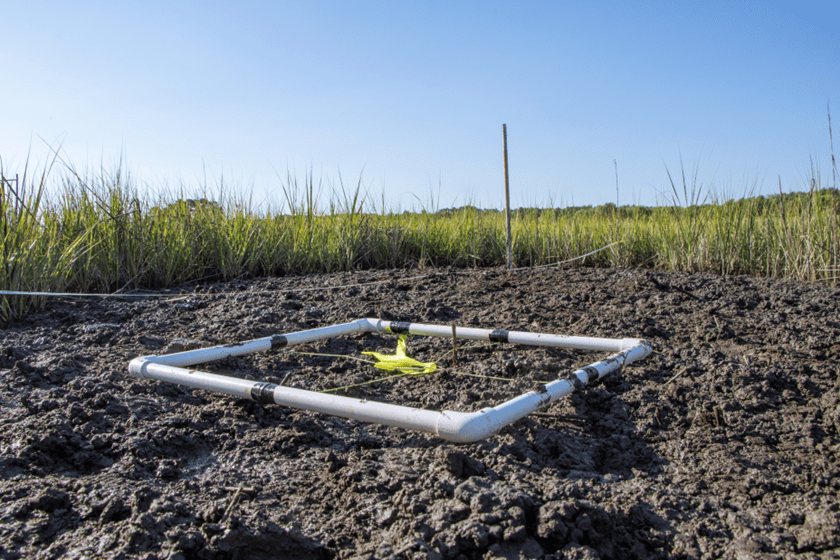
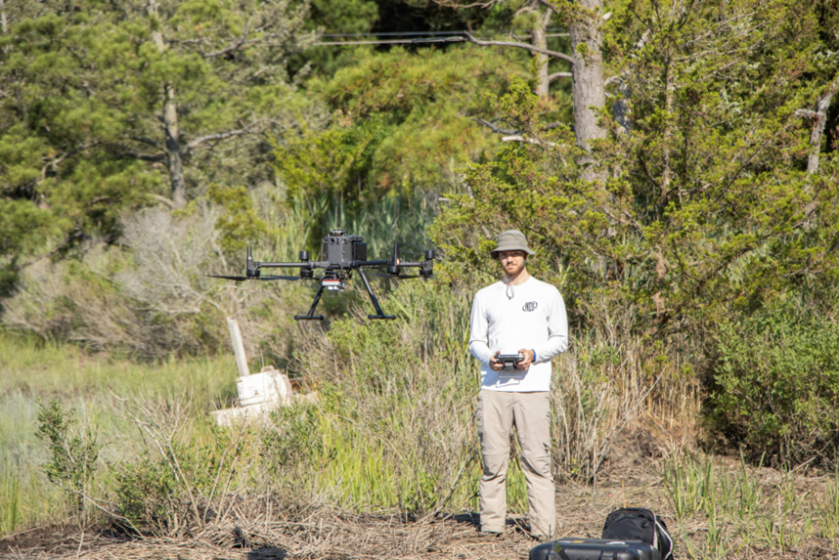
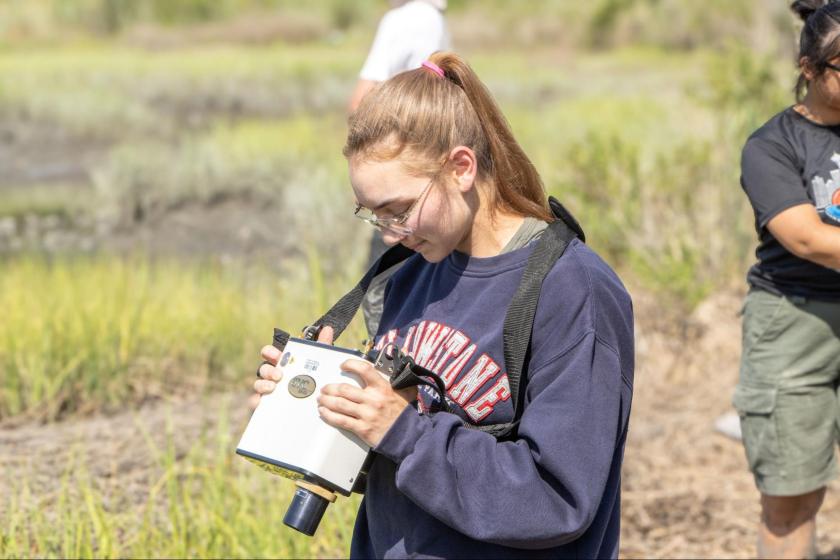
An important aspect of remote sensing is ground truthing. Here we collect ground data to calibrate drone, aircraft or satellite data. In this case, we gathered spectral data of the different cover types in the salt marshes off the Eastern Shore of Virginia. These data could be used for exploratory research, or as a basis for classifying cover types from spectral remote sensing data sources. We began fieldwork at a nearby tidal salt marsh and used a multispectral drone to map out the area and measured the spectral signature of each cover type using an optical spectrometer.
First we laid a 100m transect line with 10 evenly-spaced quadrats, which served to standardize our data collection process. We measured the absorption spectra of each quadrat and took note of the constituents and the associated cover types.
The drone flight was only ten minutes and was programmed to scan the area taking multispectral images, which would be stitched together to form a large panoramic map.
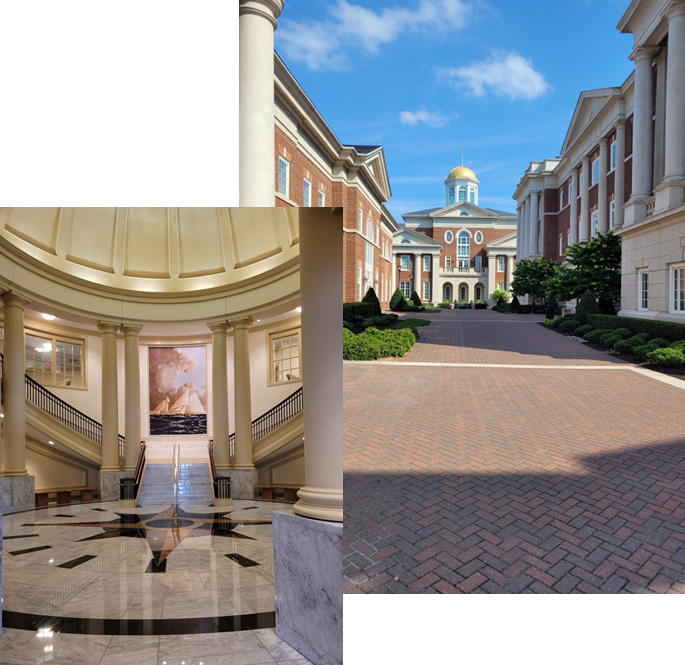
Life at Christopher Newport University
For the remainder of the internship, we stayed at Christopher Newport University (CNU) in Newport News, Virginia where we began work on our individual research projects.
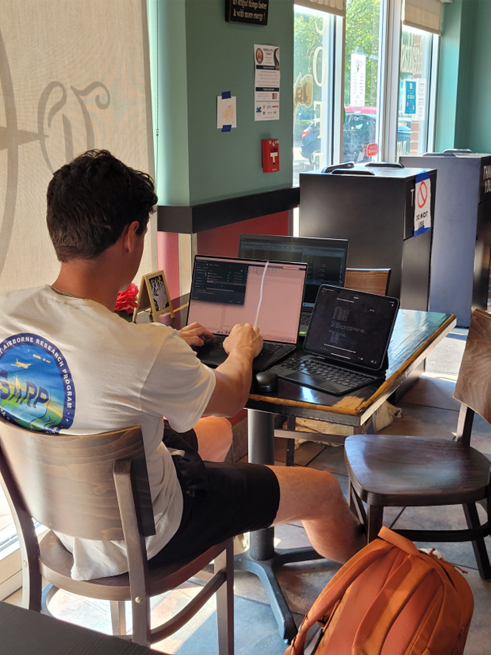
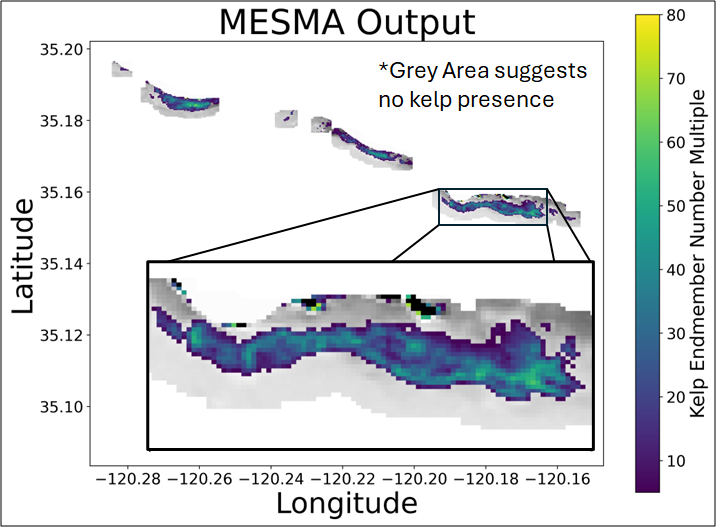
I wanted to use multispectral satellite data, and as someone who loves freediving in California’s kelp forests, I decided to pursue a project mapping kelp canopy using the new Harmonized Landsat Sentinel-2 (HLS) dataset. Specifically, I decided to look at the effect that tides and currents have on canopy detection. I hypothesized that during high tide or strong currents, while less kelp floated on top of the surface, less kelp would be detected. Being able to quantify how these factors affect canopy detection could help us either apply correction factors, or refine our uncertainty in satellite kelp detection.
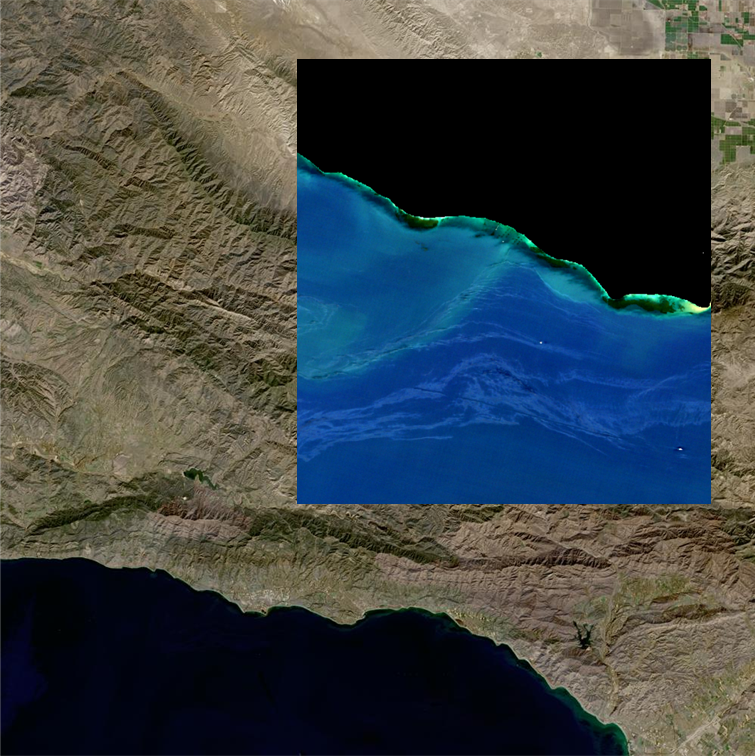
To analyze my data, I used a Machine Learning Classification model to find the kelp in satellite imagery, and then performed spectral unmixing to determine the kelp density of each pixel. If you’re interested in looking at or recreating my analysis, find my git repository here.
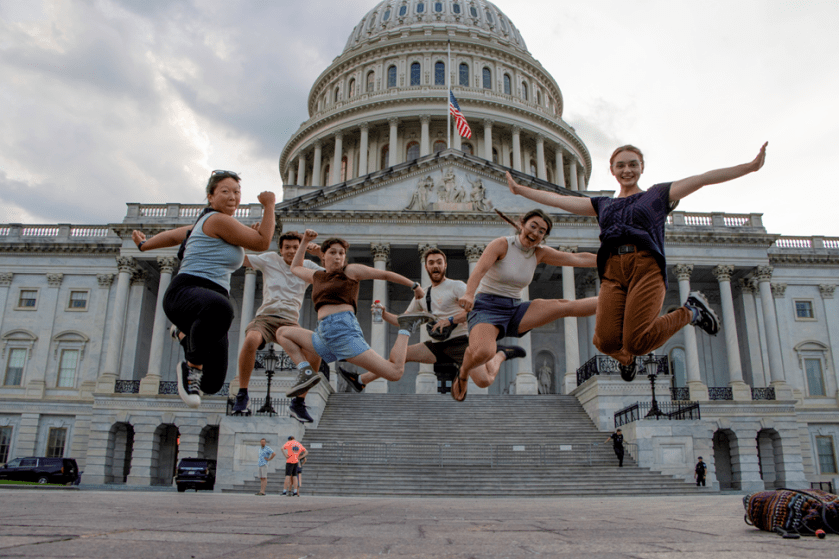
When we weren’t working on our projects, we had a lot of fun on trips to NASA facilities, research institutes, and parks!


Final Presentations + Conclusion
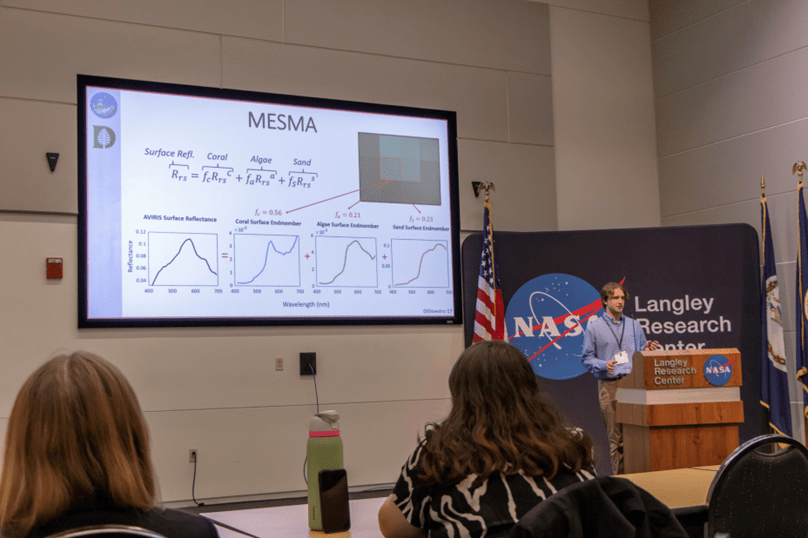
As the internship came to an end, we gave our final presentations at the Langley Research Center. Each intern gave a 15 minute presentation on their Summer research for NASA staff, scientists, and their fellow interns.
From flying among airborne scientists, touring NASA’s laboratories, and the mentorship and support that enabled me to thrive in this foreign environment, to the lifelong friends and connections I’ve made, this internship has been a life changing experience for me and an overall joy. Since finishing SARP, I plan to pursue a PhD in Mechanical Engineering with hopes of one day designing my own optical instrumentation to better understand Earth’s beautiful complexities.
Atticus Cummings/NASA's Langley Research Center