
(Check back after the New Year for the answer)

(Check back after the New Year for the answer)
Arctic sea ice is retreating at an unexpectedly rapid pace. Average ice extent in September has declined by 11.5 percent per decade relative to the 1979 to 2000 average, according to satellite measurements of the ice. Many climatologists expect that the Arctic will be ice-free during the summer in as few as thirty years if current trends continue.
Most scientists who study the issue closely agree that reducing carbon dioxide emissions is the key to stabilizing Earth’s climate. However, even if nations began curbing emissions immediately the world would continue to warm for many decades. While Earth can reabsorb some portion of carbon dioxide emissions fairly rapidly, a significant amount of carbon will remain in the atmosphere for long periods. Some 20 percent of carbon dioxide emissions are expected to remain in the atmosphere for tens of thousands of years, according to some estimates.
That doesn’t bode well for the dwindling Arctic sea ice.
However, if Mark Jacobson, an atmospheric scientist from Stanford University is right, there may still be hope for Arctic sea ice and the ecosystem it supports. Jacobson studies the climate effects of tiny airborne particles called black carbon, a scientific term for soot, the black stuff in smoke. Wood, dried animal dung, and other biofuels all produce black carbon when burned. And fossil fuels, such as coal and petroleum, are especially prolific producers of the particles.
Under a microscope, black carbon is an amorphously-shaped particle with a branching globular shape. What’s most notable about black carbon, however, is the many ways that it can warm the climate. Black carbon particles, which unsurprisingly tend to be a coal black color, warm the air directly by absorbing sunlight and converting it into infrared radiation. They also reduce the reflectivity of the surface when deposited on icy surfaces. And they infiltrate cloud droplets in ways that can cause clouds to dissipate more quickly than they otherwise might.
Together such effects can produce a potent warming effect. Last week, during a session focused on black carbon at the American Geophysical Union meeting in San Francisco, Jacobson reminded meeting attendees of a bit of news that Stanford released a few months back. Reducing soot emissions may be the fastest method – indeed the only way — of saving the Arctic ice, Jacobson noted. “On average black carbon particles stay in the air for just four or five days, so reducing emissions has an immediate impact,” he said in an interview later. “That’s not the case for greenhouse gases.”
Recent modeling, conducted by Jacobson and funded in-part by NASA, suggests that eliminating soot emissions from fossil fuel and biofuel burning over the next fifteen years could reduce Arctic warming by up to 1.7 °C (3 °F). Net warming in the Arctic, in comparison, has been about 2.5 °C (4.5 °F) over the last century.
–Video Courtesy of NASA TV
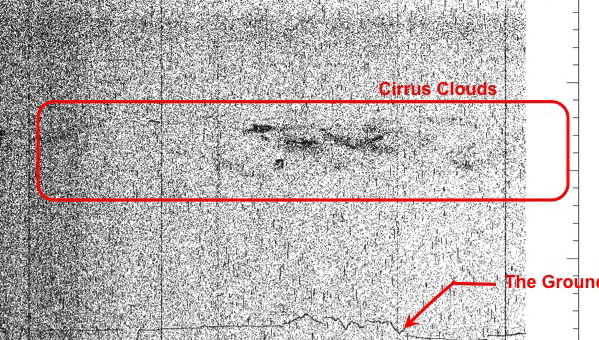
Scientists made a series of high-altitude flights this month from NASA’s Dryden Flight Research Center in Palmdale, Calif., demonstrating the scientific feasibility of surface elevation measurements to be made by one of the agency’s future Earth observing satellites, the Ice, Cloud and land Elevation Satellite-2 (ICESat-2). The first image (above) returned from a flight Dec. 8 clearly shows a layer of cirrus clouds and a high density of data points outlining surface elevation over California. Data in the image are preliminary and not for scientific use.
The data are from the Multiple Altimeter Beam Experimental Lidar (MABEL) instrument, assembled by a team led by ICESat-2 instrument scientist Matt McGill at NASA’s Goddard Space Flight Center in Greenbelt, Md.
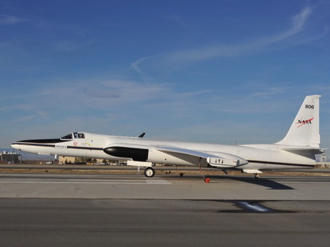 Tucked into the nose of the ER-2 aircraft (right) MABEL flew at an elevation of 65,000 feet (more than 12 miles) over five targets across the U.S. Southwest collecting surface elevation information similar to what will be collected by ICESat-2, scheduled for launch in January 2016.
“These were engineering test flights with intelligent science targets,” said Kelly Brunt, a polar scientist from Goddard who was in the field as a science liaison for flight planning. “We wanted to hit spectrum of targets that represent what the scientists are interested in, such as ocean water, fresh water, trees, snow, steep terrain and salt flats.
“The density of data collected is astounding, and will allow us to characterize what we see from space,” said Thorsten Markus, ICESat-2 project scientist and head of the Cryosphere Branch at Goddard.
To learn more, visit poster session C41A, “Measuring Earth’s Third Dimension: ICESat, IceBridge, CryoSat, and Beyond,” at 8 a.m. on Thursday, Dec. 16 at the 2010 AGU fall meeting in San Francisco, Calif.
–Kathryn Hansen, NASA’s Earth Science News Team

What on Earth was that sound? Jungle birds? Monkeys? Sirens?
Combined with the movie of swirling lights you might even have guessed some kind of spacecraft launch or radio tower.
In fact, both the sound and image are of completely natural origin. The movie shows what’s known as a pulsating aurora – a very common, but hard to see, weak aurora that blinks on and off up to 12 times per minute in the night sky.
The sound is of something no one knew was connected to these auroras until recently: a special kind of electromagnetic wave some 40,000 km higher in Earth’s magnetosphere called a chorus wave, since it sounds like birds chirping when played through a speaker. 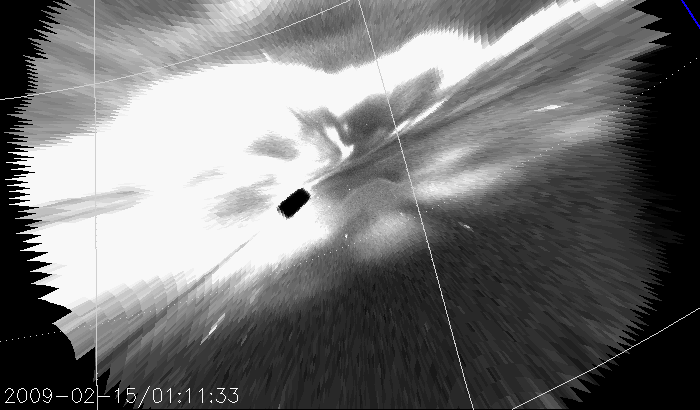
How the pulsating auroras form has long been a mystery. Stable auroras form when electrons and ionized particles from the solar wind travel down magnetic field lines towards Earth. These collide with nitrogen and oxygen particles in the ionosphere, some100 km above Earth, and the collisions send out blue, green, and red photons to create the colorful light shows of the aurora.
But no one knew what could cause an aurora to turn into a strobe light until scientists at UCLA looked at data from NASA’s THEMIS spacecraft. They discovered that the auroras pulsed in sync to chorus waves far above Earth’s atmosphere. The chorus waves apparently drive the light-inducing solar wind particles down to Earth following its own unique beat.
Linking the two phenomena does more than explain the origins of the pulsating aurora. Using the electromagnetic waves and the aurora to define end points of magnetic field lines gives scientists a new tool to physically map Earth’s constantly changing magnetic field. Knowing the way that the magnetic field moves, in turn, is crucial for understanding space weather and phenomena that can threaten Earth-observing satellites.
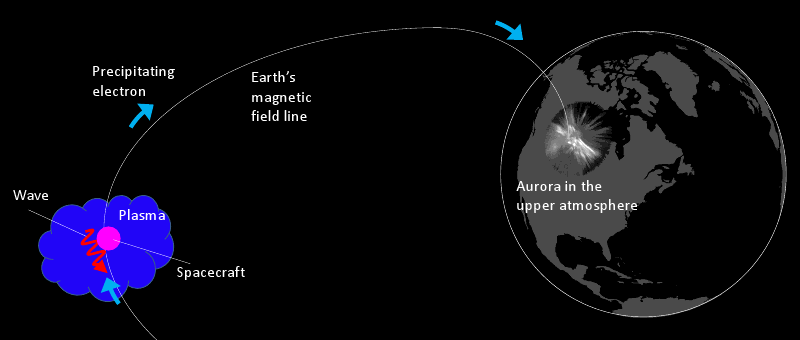
Top Image: Pulsating aurora image taken on Oct 30, 2008 in Laukvik, Lofoten Islands, Norway. Courtesy of Jan Koeman. Middle Image: A snapshot of the pulsating aurora taken by a ground-based camera. The black square in the middle is the THEMIS spacecraft. Bottom Image: Schematic diagram showing aurora over North America and spacecraft in space (magenta) embedded in the energetic plasma source (blue cloud). These two regions are connected by the Earth’s magnetic field line. Energetic plasma interacts with waves (red) and precipitate into the upper atmosphere (blue arrows) and generate aurora. The geometry of the plasma cloud determines the aurora shape. Courtesy of Toshi Nishimura

Some 25 billion tweets were sent in 2010, and surprisingly Lady Gaga didn’t dominate the list. Instead, it was the summer’s Deepwater Horizon oil spill that inspired the most activity, according to data released by Twitter this week.
Meanwhile, six months after the spill, and long after media and twitter chatter about it has subsided, scientists continue to parse out the details of the unprecedented event. I spent the afternoon yesterday in a session at AGU that highlighted the incredible array of resources the scientific community flung at the problem.
NASA is known best for its satellites (in this case, the iconic imagery of the spill captured by the MODIS instruments). Yet, as we’ve pointed out on this blog before, satellites aren’t the only tool that NASA’s earth scientists have at their disposal. In the midst of the oil spill crisis, NASA scrambled a number of aircraft bearing instruments that have a played key roles in sorting out the dynamics of the spill.
During the AGU session, Michael Freilich, director of NASA’s earth science division, emphasized the novel contributions of an airborne instrument called the Airborne Visible/Infrared Imaging Spectrometer (AVIRIS), a spectrometer that flew aboard the ER-2, a civilian version of the famous U-2 spy planes, and the Twin Otter, a much smaller propeller plan that flies at a lower altitude.
At AGU, Freilich outlined the AVIRIS contributions:
Flights were planned to do coastal ecosystem work because the hyperspectral measurements can be used to classify vegetation and to determine the impact of the oil on that vegetation, as well as to map the volume of the oil in the upper ocean over the oceanic portions of the slick. In a couple of weeks, AVIRIS flights took as much data as we usually take in an entire year or more. And whereas it usually takes two-to-three months for the AVIRIS data to be processed, calibrated, and distributed, the team working at Johnson, very early on, got it down to providing imagery and calibrated radiances to between 6 to 12 hours after a flight. Those measurements were then given to NOAA and USGS scientists, as well as analyzed by NASA and academic scientists.
The director of the United States Geological Survey Marcia McNutt also praised AVIRIS during the session for its ability to image oil on the surface, and noted that AVIRIS helped determine the lower bound on the amount of oil released. “[It] did an excellent job of determining the amount of oil that was likely to impact the shoreline,” she said. “We are very grateful for the support we received from NASA for this work,” she said.
For more information on the AVIRIS instrument and its Deepwater Horizon oil flights: see the Jet Propulsion Laboratory AVIRIS instrument page, this news feature about AVIRIS flights, and this JPL Photojournal page. There’s a great deal of raw imagery captured during various AVRIS flights here.
–Adam Voiland, NASA’s Earth Science News Team
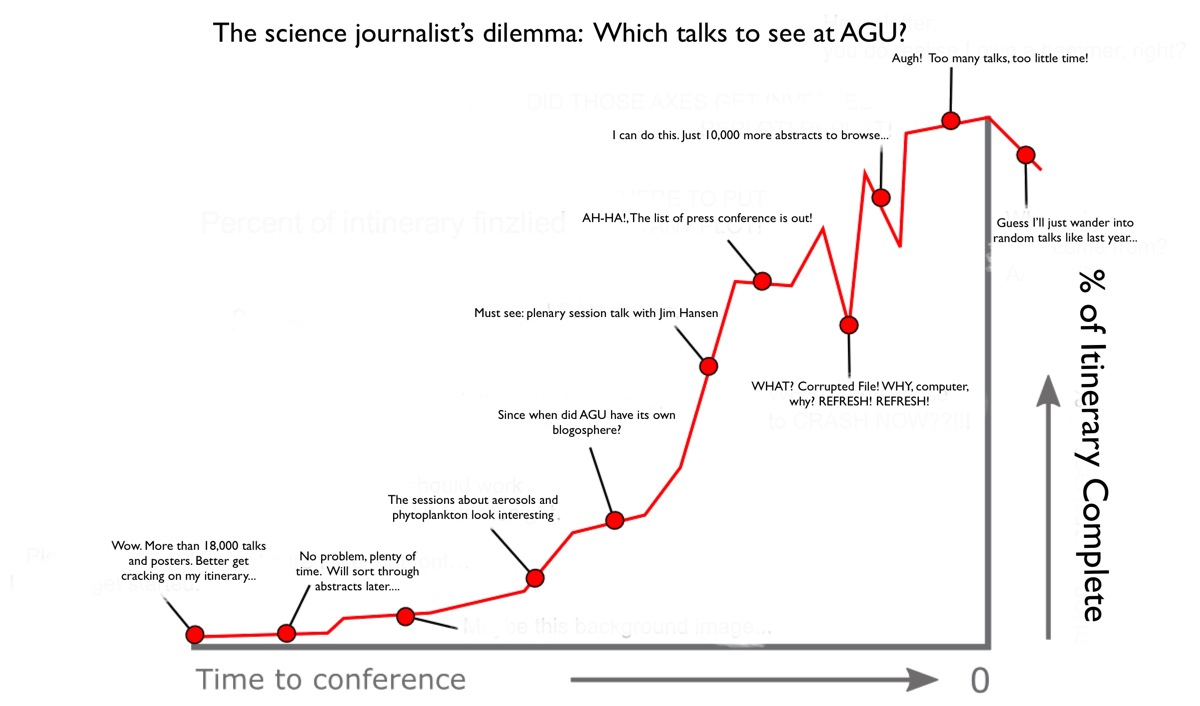
Figuring out what talks to attend at AGU can be tough.
The crux of the problem: there are more than 15,000 individual abstracts to pick through, not to mention no small number of other lectures, plenary sessions, and events vying for attention. It is simple enough if you’re a scientist — just focus on the talks and posters related to your area of expertise. It’s a bit trickier if you happen to be a science writer trying extract the zeitgeist of the whole meeting. Indeed, on deadline, the exercise of choosing talks can be near maddening.
To figure out how to focus the bulk of my time and energy this year, I decided to try something new. Rather than simply thumbing through the master list of talks highlighting the those that looked interesting, I am opting for a more quantitative approach. Last night, I downloaded a handy program called Word Counter that, among other things, can tally up the most frequently-used words in a document.
I ran the titles for each day’s sessions (both posters and oral) through the program to see what turned up. The output was fascinating: a bird’s eye view of the topics that scientists are talking about the most. Take the Monday morning session. Word Counter reports that the five most cited words are water (109 mentions), aerosol (100), climate (77), mantle (67), and ice (66). Not exactly shockers (though I wouldn’t have expected aerosol to be so high), but knowing that what these most “buzzed-about” topics did make it much more interesting to go back and pick through abstracts.
Stayed tuned. At the end of the meeting, I will be post more keyword results from Word Counter. Also, a hat tip to the Highly Allochthonous blog for this post, which was the source of inspiration for the graphic above.
–Adam Voiland, NASA’s Earth Science News Team
Most Mentioned Topics: Water (109), Aerosol (100), Climate (77), Mantle (67), Ice (66)
 Water, aerosol, and climate are the three most widely-used terms in the AGU titles for the Monday morning talks, according to my Word Counter tally.
It’s not just the hydrology talks; water in all its various forms (vapor, ice, liquid) come up in a broad range of contexts (agriculture, clouds, water quality) Topping my list as most interesting: The set of posters exploring connections between hydrology and human health. Who knew researchers were trying to predict cholera outbreaks using remote sensing?
Aerosols (read this if you’re not familiar with why the small airborne particles matter) are a topic every student of earth science ought to know something about. The particles have become one of the hottest areas of research among scientists as they’re not particularly well-understood, yet have a big impacts on human health and climate. There’s a cloud-aerosol session worth swinging by to find out how the problematic particles modify clouds. If I have time, I also plan to stop by a sessions about mineral dust. There’s a lot more dust wafting about in the air than you’d think, and this is your chance to find out what it might mean for the climate.
Most Mentioned Places: California (46), Arctic (35), China (28)
The summer’s CalNex campaign has produced a flood of studies about the Golden State; many of them focus on parsing out the relationship between air quality and climate. The Arctic is another big theme, particularly in a session about the future of polar science. In China, scientists dig deep beneath the continent for clues about the crust in Asia.
The Morning’s Press Conference
New Views of Urban Heat Islands, 11:00h
3 Intriguing Sessions, Oral
Urban Areas and Global Change I, B11J Moscone West: 2008 Monday 0800h
Impacts of Mineral Dust Aerosol on Global and Regional, Climate I, A11K Moscone West: 3004 Monday 0800h
SinoProbe: Deep Exploration in China I, T11F Moscone West: 2016 Monday 0800h
3 Intriguing Poster Topics
Crafty Hydrological Experiments Under Financial Constraints Posters, H11A Moscone South: Poster Hall Monday 0800h
Hydroepidemiology: Understanding Connections Between Hydrology and Human Health I Posters, H11D Moscone South: Poster Hall Monday 0800h
Urban Areas and Global Change I (joint with A, GC, H, PA) C McIntosh, M Beckley
B11J Moscone West: 2008 Monday 0800h
6 Standout Talks/Posters
0800h B11J-01 Contrasts between urban and rural climate under climate change scenarios (Invited): K W Oleson, G B Bonan, J J Feddema
0820h B11J-02 Climate change and heat waves in Paris and London metropolitan areas:
0800h ED11A-0576 POSTER Cellphones as a Distributed Platform for Black Carbon Data Collection N Ramanathan, M Ramana, M L Lukac, P Siva, T Ahmed, A Kar, I Rehman, V Ramanathan;
0800h B11D-0388 POSTER Response of high elevation rocky mountain (Wyoming, USA) forest carbon dioxide and water vapor fluxes to a bark beetle epidemic: J M Frank, W J Massman
0800h B11C-0367 POSTER Mitigating greenhouse gas emissions with agricultural land management changes: What practices hold the best potential?: A J Eagle, L Olander, C W Rice, K Haugen-Kozyra, L R Henry, J S Baker, R B Jackson
Hydrology and Human Health: Predicting Cholera Outbreaks using Remote Sensing Data: A S Jutla, A S Akanda, S Islam 0800h H11D-0830 POSTER (TK)
3 Standout NASA-Related Talks/Posters
0812h GC11A-02 NASA and polar science in the coming decade: T P Wagner, J A Kaye, (NASA HQ)
0854h A11K-05 Response of the water cycle of West Africa and Atlantic to radiative forcing by Saharan dust (Invited): W K Lau, K Kim ; (NASA Goddard)
0800h H11I-0926 POSTER Water Availability in the Tigris-Euphrates River Basin and the Middle East from GRACE: K Voss, J S Famiglietti, M Lo, C de Linage, S C Swenson, M Rodell (NASA JPL)

A huge blizzard hammered the Midwest this weekend. The picture above, captured on December 7 (a few days before the latest load of snow) by NASA’s Terra satellite, shows much of the Midwest was already draped in white. Credit: NASA/MODIS Rapid Response System
 Fascinated by earth science? Then follow along on our new NASAonEarth Twitter feed to receive a steady stream of earth science news, notes, and more. This week we are in San Francisco for the American Geophysical Union meeting; keep an eye on the feed for updates from the world’s largest gathering of earth scientists. We also recommend the NASA_EO and EarthVitalSigns feeds for more on NASA earth science.