Rising Temperatures in the Midst of Heavy Snow?

The last few months have been a bit odd. Too much snow in the mid-Atlantic. Too little for the Winter Olympics in Vancouver. And a dusting nearly everywhere else. Meanwhile, a blizzard of confusing and often conflicting commentary has left many people asking: Is the climate really warming? Warming faster than ever? Or perhaps just weirding out?

Since NASA scientists have been tracking global temperatures and climate change for decades, we checked in with researchers from across the agency to get their take on the state of Earth’s climate (which, it’s worth noting, isn’t the same thing as Earth’s weather). The result is a collection of feature stories, videos, and web interactives that describe what we’ve found on NASA’s Global Climate Change Site. Here’s a sampling:

•     Why the Arctic Oscillation has made this winter one to remember (Article)

•     How the ocean’s natural rhythms can hide or accentuate global temperatures (Article)

•     Why the last decade has been the warmest on record (Article)

•     On the record about the temperature record (Q&A)

•     Piecing together the temperature puzzle (Video)

•    2009 Temperature update (Video)

•     Sorting out the squiqqles in the global temperature record (Interactive graphic)

•     Watching the world’s changing temperature (Data Visualization)

•     Snaps from space: The impact of a warming world (Image gallery)

–Adam Voiland, NASA’s Earth Science News Team

Richard Alley on Earth's Biggest Climate Control Knob


Click here for a multimedia presentation of Richard Alley’s AGU talk.  (Credit: AGU)

Scientists aren’t known for being the savviest of public speakers, but Penn State’s Richard Alley is that rare researcher who knows how to give a talk. Alley — who’s willing to sing, dance, and gesticulate vigorously to get a point across — gave a lecture about carbon dioxide to an overflow crowd of scientists at the American Geophysical Union meeting this year that’s well worth watching.

Blogger and University of Toronto computer scientist Steve Easterbrook has an excellent blow-by-blow of the talk, but the heart of it came down to this point, which Alley made on his last slide:

An increasing body of science indicates that CO2 has been the most important controller of Earth’s climate. 

If you want the details, (and the details are a pleasure to sit through in this case because of Alley’s gregarious speaking style) AGU has posted video and slides of the full talk. Still want to know more about carbon dioxide? NASA’s Jet Propulsion Laboratory (JPL) released new details about the distribution of carbon dioxide in the troposphere, the region of Earth’s atmosphere that is located between 5 to 12 kilometers, or 3 to 7 miles, above Earth’s surface. (JPL also released a ten question quiz about the gas that you can access here).  

Meanwhile, Alley participated in a NASA science update back in 2005 that explored the nature of sea level rise, a topic that NASA researchers continue to investigate and that you can explore interactively using our Sea Level Viewer.

–Adam Voiland, NASA’s Earth Science News Team

Smelling the Air in Kanpur

Winter haze piles up against the Himalayas above the Indo-Gangetic Plain.      (Credit: Earth Observatory)

“When the plane was about 30 minutes from touchdown, we could start to smell the air,” said David Giles. “It was shocking.”

Giles — a young scientist at NASA’s Goddard Space Flight Center — was en route to Kanpur, a large Indian industrial city on the banks of the Ganges river. Dust and soot tend to hover over the region, which is sandwiched between the sharp edge of the Tibetan Plateau to the north and the highlands of the Deccan Plateau to the south.

There’s so much soot in the air that satellites can routinely see a cloud of haze blanketing the region.

The bowl-like Indo-Gangetic Plain is second only to some parts of China for having the heaviest load of air pollution in the world. In the spring, when dust blows in from the deserts to the West, aerosols from factories, buses and trucks, and fires are especially heavy. So much so, in fact, that NASA researchers suggested recently that dust and soot may be driving the retreat of Himalayan glaciers by altering the monsoon.

Giles was in Kanpur to man one of NASA’s AERONET stations in the region as part of the ongoing TIGERZ campaign. He spent 17 days in Kanpur hauling the instrument around and getting harassed by local police officers, the occasional herd of roaming sheep and dust storms. In between all that, he spent the bulk of his time collecting measurements to determine whether dust and soot can glom onto one another to create new types of hybrid aerosols.

They do, he found, a seemingly mundane point but one that’s of considerable interest to the scientists trying to sort out how these two types of aerosols affect the climate. He presented his results in detail this week to colleagues at the American Geophysical Union fall meeting in San Francisco.

I nabbed him after his talk in the afternoon, to have a beer and talk through his travels. I asked him what was the most memorable part of the trip to India. “Well, it was unbelievably hot,” he said with a laugh. “Temperatures routinely hit 105 degrees.”

And how was the air? “You’d get used to it after a while,” said Giles, “but, at first, in the taxi, we were holding our sleeves over our mouths just to avoid breathing the stuff.”


Giles and colleagues using sun photometers to measure aerosols from a rooftop in Kanpur.  (Credit: Giles)

–Adam Voiland, NASA’s Earth Science News Team

The Mysteries of Muck (and the Collapse of the Laurentide Ice Sheet)

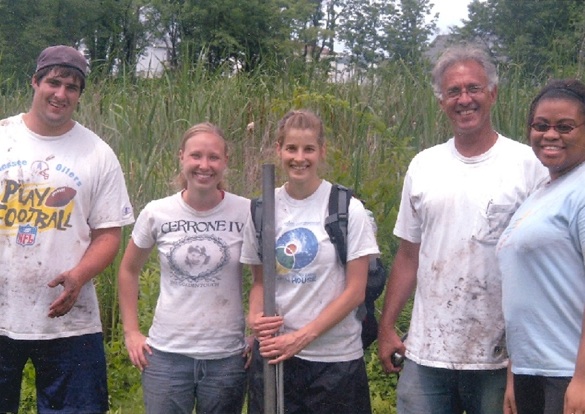
Field assistants tromped through bogs in Harriman, NY to collect sediment cores that NASA
scientist Dorothy Peteet is using to date the retreat of the Laurentide Ice Sheet.  Credit: Peteet

I spent big chunks of my childhood mucking through the lakes and bogs of New England with my brothers and looking for any number of critters hidden in the silt.

Turtles, of course, were the main draw (minus the snappers, which we knew were capable of mangling a toe or finger with a passing chomp), but actually snagging one always was a rare treat. Bullfrogs, salamanders, and newts were our standard catch.

If only we’d had a microscope. Watching Goddard Institute for Space Studies (GISS) botanist Dorothy Peteet show images of tiny fragments of pollen, seeds, and fossils that settled to lake bottoms and sat largely unchanged for thousands of years reminded me of the extraordinary oddness–and beauty–that’s lurking in the most unsuspecting of places.

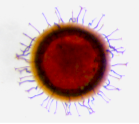
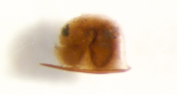
Look, for example, at this fossilized head shield of a daphnia, or water flea, which Peteet showed during presentations at GISS and the American Geophysical Union meeting last December. It’s a miniscule planktonic crustacean with a transparent body and a heart that beats visibly:


Or this statoblast, a peculiar little reproductive pod that can withstand desiccation and freezing and buds from aquatic creatures called bryozoans:


Or this one, a fossilized leaf of a fruit-bearing, cold-loving tundra plant, perhaps a blueberry:


Peteet isn’t poking around in the mud just for fun like my brothers and I did as kids, though. She’s collecting bog cores and scrutinizing the bits of fossilized plants and animals, which can be dated quite precisely using radiocarbon techniques, that turn up in the cores. Her goal is to pinpoint the timing of the collapse of the Laurentide Ice Sheet, a massive block of ice that stretched as far as Long Island during the peak of the last ice age. With Arctic ice currently undergoing rapid retreat, sorting out how the Laurentide Ice Sheet collapsed has big implications for understanding how climate change might proceed.

By analyzing material from some of the first creatures to colonize glacial lakes after the ice retreated, such as those water fleas, Peetet can estimate the date the ice sheet collapsed. Her findings suggests that the collapse occurred about 15,000 years ago, which would put it five-to-ten thousand years later than other dating techniques (particularly one influential technique that involves dating the beryllium from boulders dropped by the retreating ice sheet). 

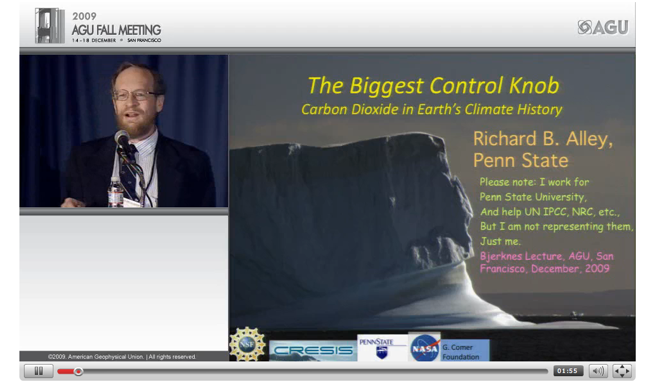
“This was surprising, and it’s generated some controversy,” she told her colleagues. “I’d like to have your ideas about what’s going on.” To learn more about the topic, you can watch, listen, or view a pdf of Peetet’s full presentation here

Share your stories about exploring the muck in your neighborhood, your ideas on the dating controversy, and we’ll make sure that Peteet sees them and posts a reply.


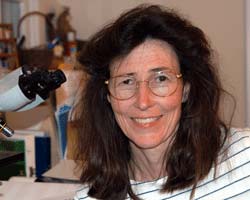
Botanist Dorothy Peteet

                                                                                                                                                                 
–Adam Voiland, NASA’s Earth Science News Team       

Tour NASA's New Climate Reel

We’re less than two weeks away from the United Nation’s long awaited Copenhagen Climate Change Conference. In anticipation of the event, NASA has compiled a climate resource reel that highlights ten of its most compelling climate videos and visualizations. 

Video topics range from a 3-D tour of the Earth’s rapidly changing cryosphere, and the unexpected role that honey bees can play as climate data collectors, to NASA’s efforts to understand the ozone layer. 

Two of the videos offer details about NASA’s new climate satellite GloryOne of them discusses Glory’s Total Irradiance Monitor, a sensor that will help monitor the sun’s fluctuations. The other  — titled Hello Crud — delves into the perplexing world of airborne particles called aerosols

You can see all ten of the top picks at NASA’s Global Climate Change website. Additional climate-related videos and animations are available through NASA’s Scientific Visualization Studio.


–Adam Voiland, NASA’s Earth Science News Team

Can Air Pollution Cause Lightning Storms?


Strange as it may seem, the most recent Image of the Week entry from the Climate and Radiation Branch at Goddard Space Flight Center suggests that air pollution does indeed exacerbate lightning storms. The graphic, created by Goddard meteorologist Thomas Bell, shows that rainfall and lightning rarely peaks over the weekend in the southeastern United States. In fact, lightning hasn’t peaked on a weekend during any year since 1998, Bell has shown after combing through meteorological data from 1998 to 2009. After publishing a number of scientific papers on the topic, Bell thinks he knows why: air pollution (which is at its highest levels midweek and lowest levels on the weekend) can strengthen thunderstorms, particularly in the unstable and humid air of the Southeast.

The figure shows the day of the week favored by rainfall and by lightning in each summer from 1998 to 2009 in the southeastern United States (click here for a map of the area included in the analysis). The “clock plots” on the left and right indicate the day of the week when mean activity was at a maximum. The numbers indicate the year the data comes from. The rain estimates are based on TRMM and other satellite observations. The lightning data were collected by ground stations that are part of the National Lightning Detection Network. Credit: NASA/Bell


To find out more, I ran some questions about the connection between pollution and lightning by Bell via email:

What On Earth: Why does air pollution have any bearing on lightning or rainfall, and why is the connection more noticeable over the Southeast than other parts of the country? 

Thomas Bell: Our explanation is that the storms need to start their growth in a hot, humid environment to give the pollution “something to work with.” The pollution causes the storm to climb to higher altitudes, because it causes the cloud droplets being formed in the storm to be smaller than they would be in a clean environment. They’re lighter and are carried up higher than usual, where they freeze (releasing latent heat), which pumps the storm up more than would happen in clean air.

The environment needs to be hot in order to have the capacity to push the storm up to altitudes where freezing can occur. The environment also needs to be humid because when the storm grows more vigorously it “sucks” air at its base up more strongly, pulling in more moisture, which then provides additional energy to the storm as the moisture condenses during its climb. The western half of the country is fairly dry—even though it can be hot, there isn’t much “fuel” (moisture) to feed a storm when it tries to grow more vigorously. The Southeast is especially hot and humid in the summer, so that’s where the effect shows up best, according to our theory.

What On Earth: Are there particular types of air pollution that have more or less impact on rain and lightning?

Thomas Bell: We don’t have a good answer to this as yet. The pollution should be the kind that affects cloud droplet growth. If we had to finger something, we’d probably choose the kinds of particulates that are emitted by diesel engines, because it seems that the weekly cycle in pollution is due, to a considerable extent, to the weekly cycle in transportation (probably trucking). More trucks are on the roads from Tue-Thu than they are the rest of the week. But this is more conjecture than a well-documented explanation.

For more context on Bell’s findings, see these earlier Image of Week entries, take a look at these news stories, or read these peer-reviewed journal articles. And, when you’ve done all that, head over to the Earth Science Picture of the Day page (which we’ve written about previously) and enjoy these spectacular pictures of lightning. Here’s an eerie one taken in the German town of Bad Mergentheim
Lightning over a German town.                                                    (Credit: Jens Hackmann via EPOD)


–Adam Voiland, NASA’s Earth Science News Team