AGU2011: How Shifting Storm Tracks Are Amplifying Climate Change


Tropical cyclones and hurricanes generate the most headlines, but it’s mid-latitude storms churning through heavily populated parts of North America, Europe, and Asia that make the weather most of us actually experience.

Climate models predict that these mid-latitude storms should shift poleward and that the intensity and frequency of the storms could change as global temperatures rise, but actual evidence of such a shift has been difficult to pin down. However, a recently published analysis of 25 years of cloud data captured by satellites offers a compelling piece of evidence that suggests storm tracks are indeed shifting.

The research, led by (former) Scripps Institute of Oceanography scientist Frida Bender, shows that storms tracks have shifted poleward, narrowed, and grown less cloudy since 1983, particularly in the Southern Hemisphere. The analysis, based on data from the International Satellite Cloud Climatology Project, finds that storm tracks have shifted by about 0.4 degrees over the last 25 years.

What’s more, the analysis suggests that changes in the location and intensity of storms could amplify global warming. The researchers detected what amounts to a 2 percent decline in storm tracks over the 25 year record. The decline in cloudiness is of particular importance because it suggests that intensity of storms is likely decreasing. And since clouds reflect large amounts of sunlight, reduced cloudiness means that ocean surfaces beneath storm systems are likely growing warmer.

Graeme Stephens, the director of NASA’s Center for Climate Science at the Jet Propulsion Laboratory, underscored the importance of the study in a piece published by Nature Climate Change noting:

Bender and colleagues’ study reminds us of the importance of changes in the large-scale clouds associated with frontal storms in storm-track regions. Not only do the polewards shifts in storm-track location profoundly affect precipitation patterns in mid-latitude regions, but associated changes in cloudiness also exert a significant positive feedback on global warming.

Text by Adam Voiland. Frida Bender presented a poster about the topic  at an American Geophysical Union Meeting on Dec. 6, 2011. The full paper is available here. Video of Midwest tropical storm originally published by NASA’s Earth Observatory. 

To What Degree is Extreme Weather Linked to Climate Change?


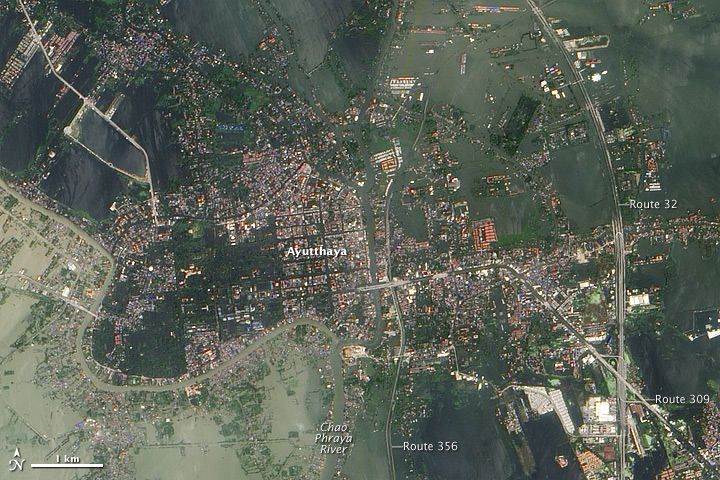
As flood waters continue to inundate Thailand and drought parches Texas, the Intergovernmental Panel on Climate Change and Goddard Institute for Space Studies Director James Hansen have both released new statements about the connection between extreme weather and climate change. Although linking extreme weather to climate change has generated controversy in the past, both of the new reports point plainly to a connection.The IPCC, an international organizational that represents the scientific consensus of hundreds of leading climatologists, put it this way in the executive summary of its new report.

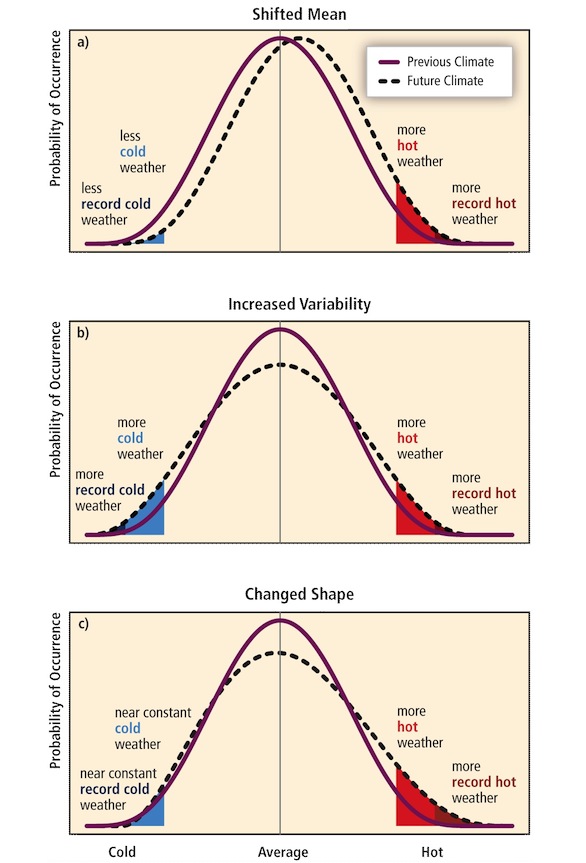
It is very likely that there has been an overall decrease in the number of cold days and nights, and an overall increase in the number of warm days and nights, on the global scale, i.e., for most land areas with sufficient data. It is likely that these changes have also occurred at the continental scale in North America, Europe, and Australia.There have been statistically significant trends in the number of heavy precipitation events in some regions. It is likely that more of these regions have experienced increases than decreases, although there are strong regional and subregional variations in these trends.

There is medium confidence that some regions of the world have experienced more intense and longer droughts, in particular in southern Europe and West Africa, but in some regions droughts have become less frequent, less intense, or shorter, e.g., in central North America and northwestern Australia.There is evidence that some extremes have changed as a result of anthropogenic influences, including increases in atmospheric concentrations of greenhouse gases. It is likely that anthropogenic influences have led to warming of extreme daily minimum and maximum temperatures on the global scale. There is medium confidence that anthropogenic influences have contributed to intensification of extreme precipitation on the global scale.

There is limited to medium evidence available to assess climate-driven observed changes in the magnitude and frequency of floods at regional scales because the available instrumental records of floods at gauge stations are limited in space and time, and because of confounding effects of changes in land use and engineering. Furthermore, there is low agreement in this evidence, and thus overall low confidence at the global scale regarding even the sign of these changes.


Meanwhile, Hansen has released the draft of a new paper (pdf) that also tackles the topic of extreme weather and climate. He’s somewhat less equivocal in his summary of the state of the science:

The “climate dice” describing the chance of an unusually warm or cool season, relative to the climatology of 1951-1980, have progressively become more “loaded” during the past 30 years, coincident with increased global warming. The most dramatic and important change of the climate dice is the appearance of a new category of extreme climate outliers. These extremes were practically absent in the period of climatology, covering much less than 1% of Earth’s surface. Now summertime extremely hot outliers, more than three standard deviations (σ) warmer than climatology, typically cover about 10% of the land area. Thus there is no need to equivocate about the summer heat waves in Texas in 2011 and Moscow in 2010, which exceeded 3σ – it is nearly certain that they would not have occurred in the absence of global warming. If global warming is not slowed from its current pace, by mid-century 3σ events will be the new norm and 5σ events will be common.

Text by Adam Voiland. Lead image of flooding in Ayutthaya published originally by NASA’s Earth Observatory. Extreme weather curves published originally by the IPCC. Land trends over land published originally on James Hansen’s Columbia University website.