On March 11, Teppei Yasunari, 31, a visiting scientist at Goddard Space Flight Center, heard that a massive earthquake off the coast of Japan had rocked his homeland and unleashed a deadly tsunami. For Yasunari, an atmospheric scientist who studies the climate effects of tiny airborne particles called aerosols, the frantic days that followed have offered powerful lessons in both patience and science communication as Yasunari grappled with the news that one of his best friends was missing and that a nuclear plant in Fukushima prefecture seemed poised to send a plume of radioactive steam aloft. We sat down with Yasunari to hear his perspective on the disaster.
WoE: You are both an Earth scientist and Japanese. What went through your mind when you heard about the tsunami?
Yasunari: Like everybody, I was shocked. There are no words to describe it. It was hard to believe the video clips I was seeing on the web.
WoE: I know you grew up in Kyoto and Tsukuba, but have you spent any time in Sendai?
Yasunari: Some. I went to undergraduate college in Aomori prefecture, which is not so far from Sendai. I have visited friends who live in Sendai a number of times.
WoE: Were your friends from college ok? 
Yasunari: One of the first things I did after I heard the news was try to contact one of my best friends from Hirosaki University who now lives in Iwate prefecture, which is just immediately north of Miyagi prefecture, the prefecture the earthquake hit the hardest. I tried emailing and calling, but I couldn’t get through. All lines of communication were down. I tried calling friends of friends. Nothing worked. Finally, I registered his name in Google Person Finder.
WoE: How long were you in limbo?
Yasunari: About three days. Finally, I saw something on Person Finder that said he was probably ok. A friend of his from grade school had heard from somebody else that a firefighter had found him. I later heard through Person Finder that he’d been moved to someone’s home, but I still haven’t been able to email or call him. On March 22, I did get an e-mail directly from him. He said his house has been completely destroyed by the tsunami. It was such a relief to have finally heard from him directly.
WoE: I imagine you must have been glued to the Internet looking for information.
Yasunari: Yes, especially Twitter, Facebook, and Japanese SNS. Since the phone and power is out in some parts of Japan, these sites are often the quickest way to get information. My personal Twitter feed is @TJ_Yasbee.
WoE: Did you look to Twitter for scientific information about what was going on with the earthquake and nuclear plant?
Yasunari: Yes. Actually something surprising happened on Twitter. Since I have studied the long range transport of aerosols, I calculated some air mass transport patterns using the NOAA atmospheric dispersion model called HYSPLIT when I heard about the possibility of a radioactive plume, I wanted to help, so I made some simple figures that showed what direction, based on the model, a plume might move.
WoE: And you tweeted the figures? 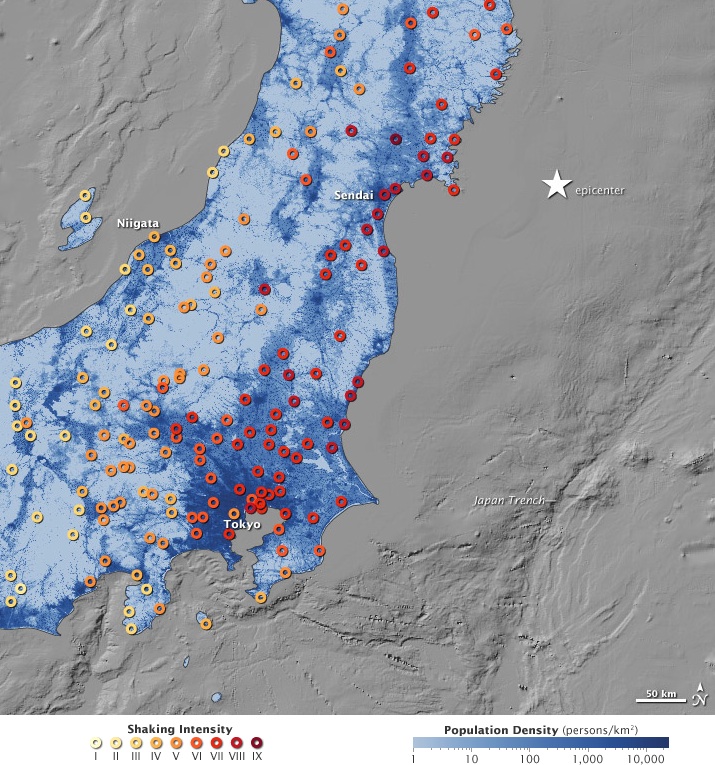
Yasunari: Yes. I only had less than 300 followers at that point. However, a physicist from the University of Tokyo, Ryugo Hayano, saw the figures and contacted me by email. He ended up tweeting his comments with my figure to his more than 40,000 followers. Neither of us could have imagined how quickly that tweet spread. It wasn’t long before newspapers were contacting me to use the figures. I couldn’t believe it.
WoE: Forty-thousand followers is quite a lot for a scientist.
Yasunari: He is well known. He tweets from @hayano. Now he has more than 150,000 followers in just a couple of days because of the earthquake.
WoE: Did you see a surge of followers on Twitter as well?
Yasunari: Yes, originally I had about 300. Now I have more than 2,100.
WoE: How did people react to the figures?
Yasunari: The model I made the figures with has quite a coarse resolution, and it can’t show any more than a broad view of how a plume might move. But people in Japan are so worried about the threat of radiation and eager for information that some of them treated it like it was very fine resolution and accurate.
WoE: So did the newspapers end up using the figure?
Yasunari: In the end, in consultation with a scientist from NOAA, we decided that it would be more confusing than helpful for the public. We asked the newspapers not to use them, and I took them down from Twitter. I learned a lot from this.
WoE: You can’t really delete a tweet, though, can you?
Yasunari: No, but I had tweeted it through Twitpics, and professor Hayano had use a similar site called Plixi, so we were able to take the figures down.
WoE: It certainly raises interesting questions about social media and science communication. Do you wish you had never tweeted the figure in the first place?
Yasunari: Yes and no. The tweet was intended just for my small number of followers, but I never realized how quickly it would spread. Of course, I expected it would spread some, but I didn’t expect it to go viral. In the future, I will be much more aware that the public doesn’t pay much attention to the uncertainties when I show a figure.
At the same time, I wish they would. Twitter and other social media can be a very convenient way for scientists to communicate, so I don’t want to say that scientists should never use social media or have a blog. I guess the best thing to do is try to find a balance between showing too much information and too little.
WoE: What about your family? Were they affected by the earthquake?
Yasunari: I contacted my family immediately after the earthquake. They were fine because they live in a western part of Japan, about 500 miles away from Sendai. We were extremely lucky. My father, also a scientist, was supposed to be in Sendai on business the day of the earthquake. Fortunately, he canceled the trip the day before he was suppose to leave because he was busy with other things.
WoE: How lucky. Does your father also study aerosols and climate?
Yasunari: No, but he is also an atmospheric scientist. He focuses on meteorology and climatology related to Asian monsoons. In fact, he has collaborated with Bill Lau, the chief of the branch I’m in at Goddard. Both Bill Lau and my father are examining the idea that aerosols can have an important impact on the monsoons — a hypothesis called the “elevated heat pump.”
WoE: Is that a topic that you study as well?
Yasunari: In some ways, yes. I recently published a paper that will help quantify how much black carbon and dust are affecting the rate of Himalayan glacier retreat. Another study, led by a scientist from the Pacific Northwest National Laboratory, cited both my paper and my father’s paper at the same time. It was the first time double Yasunari reference in the same paper.
WoE: Thanks for talking to us, and best of luck to your friend.
Yasunari: You’re welcome. I know Japan will overcome this difficult situation.
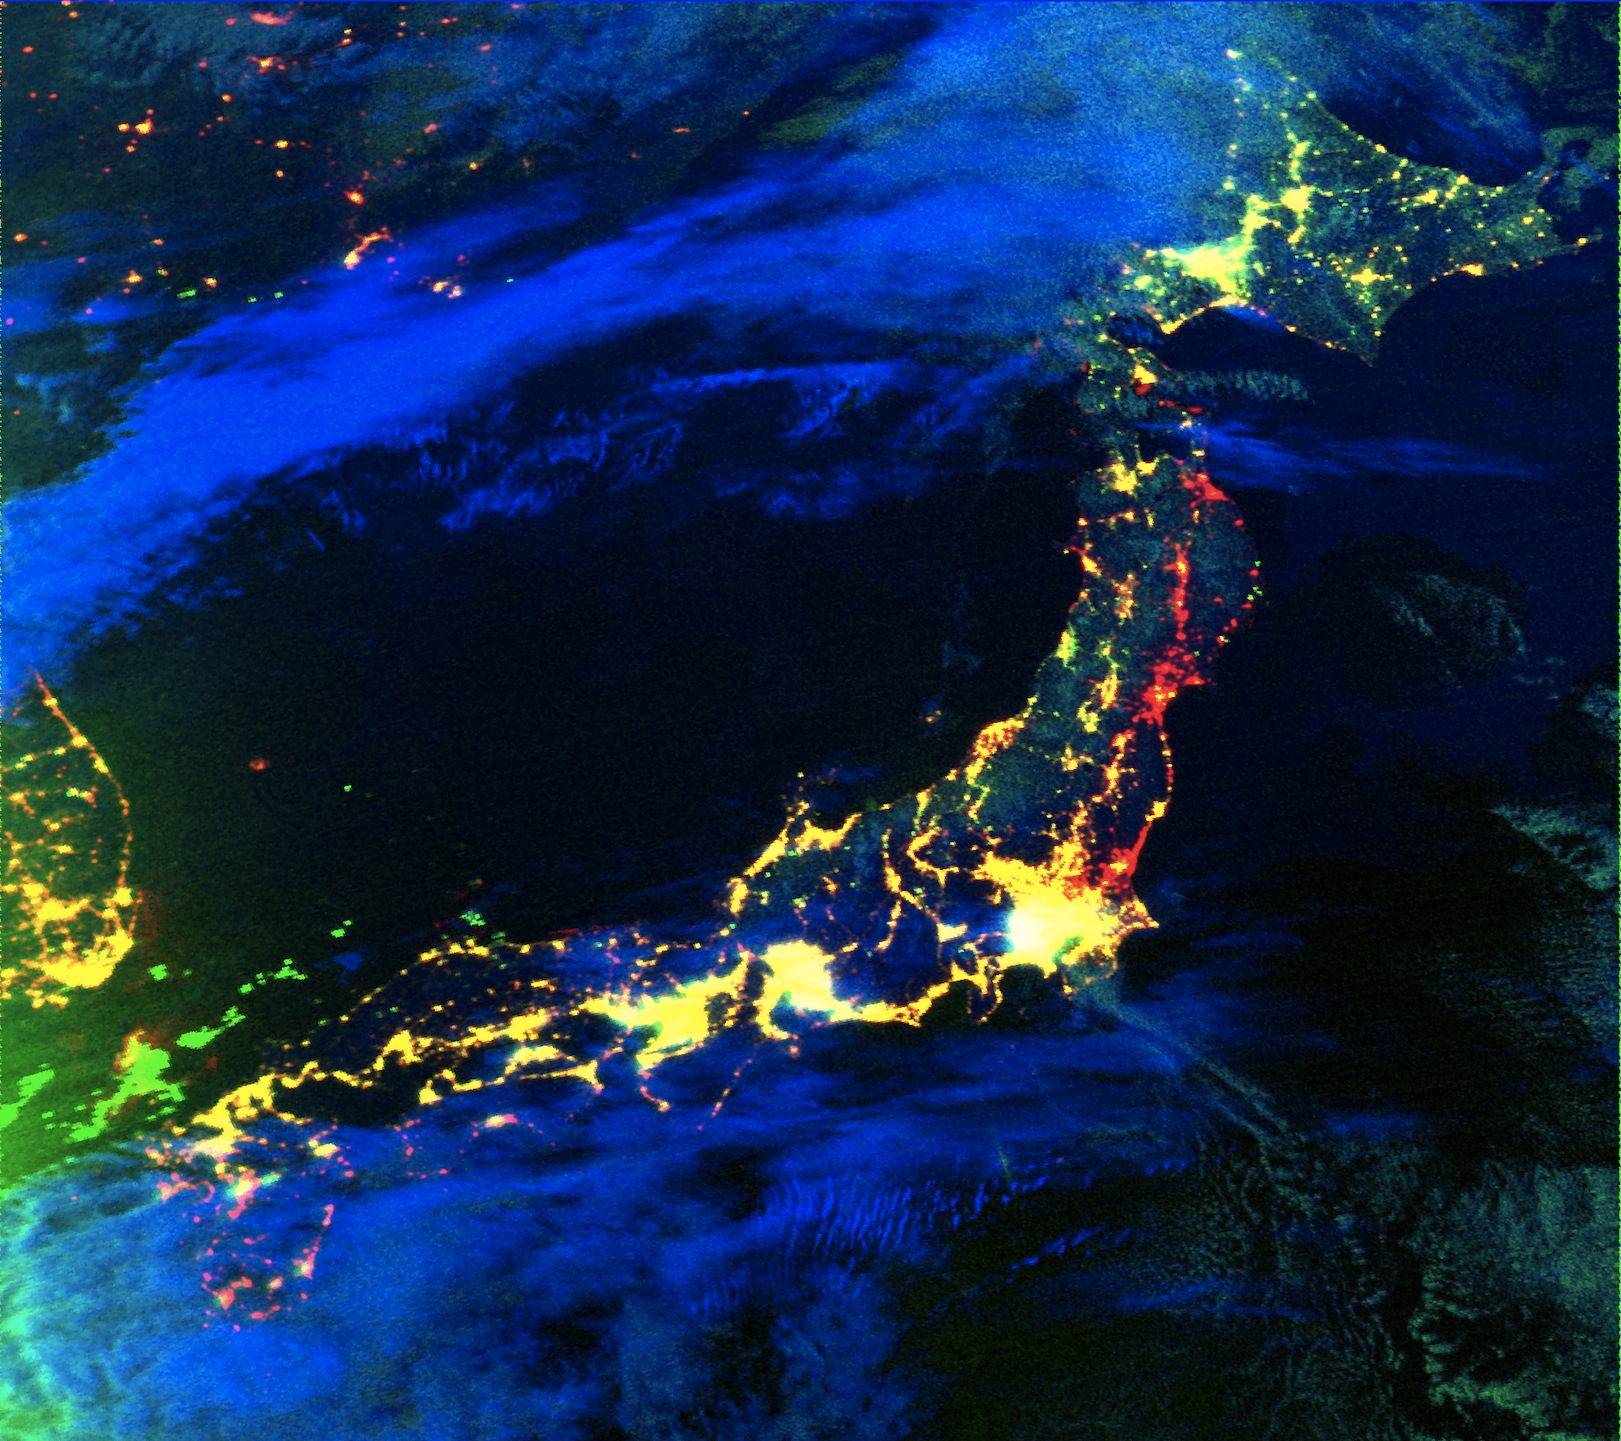
Top Image: A United States Air Force satellite observed the widespread loss of electricity in parts of northeastern Japan after the earthquake. The image, a composite, shows functioning electricity from 2010 and 2011. Red indicates power outages detected on March 12, 2011, compared to data from 2010. For more information about the map, please visit this page. Credit: NASA Earth Observatory/NOAA National Geophysical Data Center.
Middle Image: Teppei Yasunari in his office. Credit: NASA/Adam Voiland
Lower Image: A shaking intensity map based on USGS data shows ground motion at multiple locations across Japan during the earthquake. A shaking intensity of VI is considered “strong” and can produce “light damage,” while a IX on the scale is described as “violent” and likely to produce “heavy damage. For more information about the map, please visit this page. Credit: NASA Earth Observatory/Rob Simmon & Jesse Allen
–Adam Voiland, NASA’s Earth Science News Team
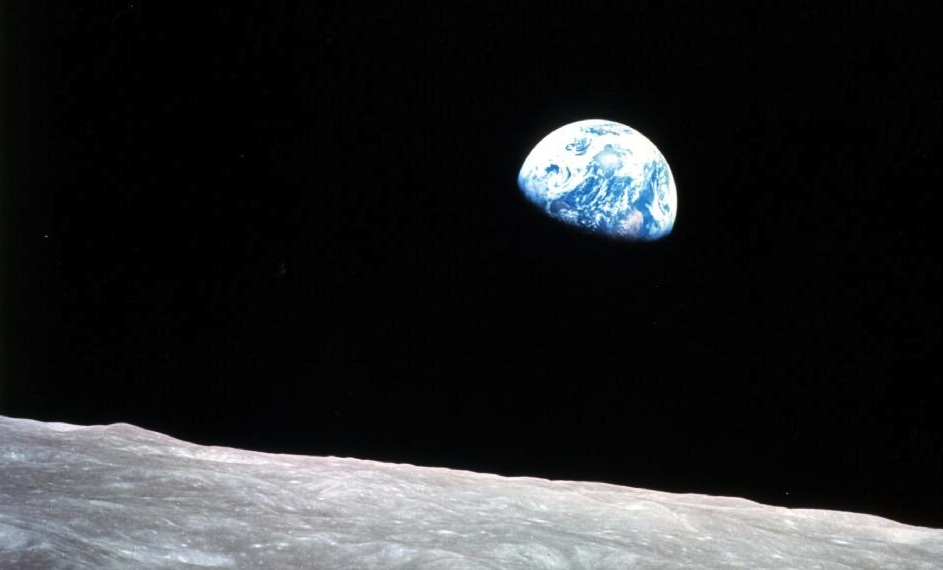
 NASA history that reminded me that the line between Earth science and manned spaceflight hasn’t always been so stark.


 This past winter, for the second year in a row, seemed pretty extreme in both Europe and the United States. So this is a good time to check quantitatively how seasonal climate change is stacking up against expectations.