Massive Air Pollution Event Highlights Sulfur Dioxide Trends in China


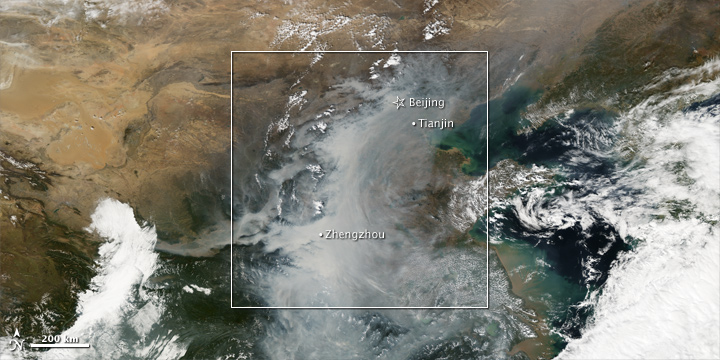
This spectacular cloud of smog and haze formed over eastern China last week when a high-pressure weather system moved in to the area, allowing industrial and burning byproducts to settle with little disturbance from winds. As NASA’s Earth Observatory reported, NASA satellite instruments detected extremely high levels of sulfur dioxide, which most likely came from various industrial processes such as coal-burning power plants and smelters (facilities that melt or fuse ores in order to extract usable metals).

Satellites also detected high levels of aerosols — most likely sooty black carbon or organic carbon particles from wildfires and fossil fuel burning – that absorb sunlight and “trap” heat. In fact, the air was so thick with the light-absorbing particles at times that seeing the midday sun clearly would have been difficult. Bearing this out, news media reported numerous traffic accidents associated with the lack of visibility.

How does this event fit into broader pollution trends in the region? A study published earlier this year in Atmospheric Chemistry and Physics offers some insight. The authors, which included a researcher from Goddard Space Flight Center, analyzed sulfur dioxide emission trends in China since 2000 and made a number of notable observations. These included:

  • From 2000 to 2006, total sulfur dioxide emissions in China increased by 53 percent from 21.7 teragrams to 33.2 teragrams, an annual growth rate of 7.3 percent per year.

  • Geographically, emissions from northern China increased by 85 percent whereas emissions from the south increased by only 28 percent.

  • However, emissions started to decline in 2006, primarily due to the wide application of flue-gas desulfurization (FGD) devices in power plants.


Want more details? You can read the full paper here [PDF].

–Adam Voiland, NASA’s Earth Science News Team, Image courtesy of NASA’s Earth Observatory

Glory Versus the Curse of the Black Carbon


Kick back, make yourself some popcorn, and enjoy one of the latest offerings from NASA Television: a tongue-in-cheek trailer about the horrors of airborne particles called aerosols. Black carbon plays the villain, and it’s this sooty particle (which comes from wildfires, campfires, various industrial processes, and diesel fumes) that gets the blame for “cursing” atmospheric scientists with a “scourge of ignorance”.

Plenty of specialists here at Goddard Space Flight Center will tell you that, over the years, we’re making real progress understanding aerosols, but there’s little doubt that the tiny airborne droplets and particles have given climatologists headaches over the years.

Back in March of 2009, James Hansen, director of the Goddard Institute for Space Studies, laid out the key obstacles underpinning what he called the “Nasty Aerosol Problem” in a presentation he gave in Copenhagen. As he puts it in one slide: 

* “We do not have measurements of aerosols going back to the 1800s – we don’t even have global measurements today.

* Any measurements that exist incorporate both forcing and feedback.

* Aerosol effects on clouds are very uncertain.”

    NASA’s upcoming Glory mission, which carries a promising new gizmo for studying aerosols called the Aerosol Polarimetery Sensor (APS), looks to be our next best shot for getting a better handle on the problematic particles. Glory is hardly the only NASA effort addressing aerosols, but I’ve certainly noticed that nothing rivals a satellite mission (as opposed to, say, ground or aircraft campaigns) when it comes to generating buzz in the hallways.

    You can learn more about Glory here, here, and here. And why not follow Glory on Twitter or Facebook?

    –Adam Voiland, NASA’s Earth Science News Team

    Hungry? Try a Honeypot Ant…


    If I’ve learned anything as a science writer, it’s that scientists produce such a flood of fantastically odd factoids that boredom isn’t much of an occupational hazard. Heck, the chances that deep boredom will strike during work are right down there with the odds a cataclysmic disaster will obliterate humanity come 2012.  (Pretty much impossible, in other words.)

    I got a healthy reminder of this last week when a bug expert—an entomologist, in proper scientific parlance—by the name of Benoit Guenard turned me on to some photos of a truly bizarre genus of ant called Myrmecocystus.  A slice of one of those photos—a group of jaw-droppingly obese honeypot ants hanging from the roof of a nestbecame our most recent “What On Earth is That?”

    This particular type of ant, which lives in deserts, is like something out of The Matrix.  When food is plentiful, honeypot colonies select certain workers—entomologists call them repletes—to serve as food receptacles for the group. The other workers tuck the repletes away in a safe spot, and then literally stuff them with food until the back sections of the repletes literally swell up like water balloons.

    Grape-sized repletes so fat they cannot walk are common. When food gets short, hungry workers just wander over to a replete, poke and prod it a bit, and wait for it to upchuck lunch. If that’s not bizarre enough, it turns out that rival honeypot ant colonies have a habit of raiding one another and plundering–then enslaving–repletes.  Stranger yet, it’s not just ants that have a taste for repletes; they’re something of a local delicacy among certain tribes in Australia.


    Guenard, it so happened, was the perfect guy to ask about weird ants such as Myrmecocystus. He is in the midst of—get this—an effort to classify all the ant genera in world. That may not sound like much, but it’s an enormously ambitious task when you consider that biologists have yet to name something like half of the ant species scurrying around us.  

    Nobody knows the total number of ant genera in the world, or species for that matter, Guenard tells me, since biologists have never managed to cobble together a systematic search at the scale required. That’s not for lack of effort. In the nineties, an ambitious effort to name every single species on Earth (not just ants but all species) in a mere 25 years—the equivalent of a Moon shot for taxonomists–flamed out when the tech bubble burst and the project lost its funding. Other efforts to classify smaller bits of ecological real estate have suffered similar fates.

    Still, there are biologists out there like Guenard doing their best to continue counting. Guenard, a graduate student at the University of North Carolina, participates in the Global Ant Diversity Project, an effort led by his adviser Rob Dunn and sponsored, in part, by NASA. (I first met Dunn at a NASA-sponsored Ecological Forecasting conference where he was explaining how he uses satellite data to predict global patterns of ant diversity. Check out this PowerPoint if you want to learn more about how that works). 

    Guenard updates the growing ant database as new information turns up in the scientific literature, but he also keeps an astonishing website and blog that brims with eye-popping photography and commentary about ant species that I’m willing to bet you never knew existed. Take a look, for example, at these Pachycondyla chinensis doing battle with some hapless-looking termites. Or look at this pint-sized worker intimidating a hermit crab dozens of times its size. 


    I certainly couldn’t get enough ants from the website, so I gave Guenard a few calls this week to pick his brains about ants and honeypot ants in particular. Here’s a clip from our conversation in which we discuss, among other things, the scientific value of ant licking, replete raiding, and how to tickle an ant to make it spit.


    –Adam Voiland, NASA’s Earth Science News Team

    Earth Buzz: Summer Temps, Icy Interactive, and More

    How Warm Was This Summer?
    …The 4th warmest on record. The Goddard Institute for Space Studies has all the details.  (NASA, Earth Observatory, GISTEMP)

    Interactive Ice
    The world’s ice–on both sea and land–is changing.  See it with your own eyes. (Eyes on the Earth)

    December 2012
    You’re not going to die.  The world’s not going to end.  Can we talk about something else now, please? (
    JPL Video)

    G. Projector, What?
    You’ve never heard of it, but it’s the best map processing software on the internet.  (
    Elegant Figures)

     
    Inside AERONET
    Goddard’s Brent Holben offers a tour of the robots on his roof (NASA Explorer)
     
    Venus + Moon + Lake
    …Equals a breathtaking photo. (Earth Science Picture of the Day)
    Tweet of the Week
    Look mom, no Photoshop! Check out this awesome image from our friends @APOD An Airplane in front of the Moon bit.ly/ckMCri  (NASA_GoddardPix)
     
     
    –Adam Voiland, NASA’s Earth Science News Team
     
    Summer 2010 temperature image courtesy of the NASA Earth Observatory

    Behind the Scenes With Scientists Who Created A Global Air Pollution Map

    Yesterday, NASA posted an article about a new global map of health-sapping PM2.5 air pollution. The Dalhousie University researchers who made the map used data from NASA’s MISR and MODIS satellite instruments, as well as information from a computer model called GEOS-Chem. You can read the news story here (or the accounts from Wired, Public Radio, and UPI), but we also wanted to share some of the audio from our interview with the scientists for those who want more details. The scientists being interviewed are Aaron van Donkelaar and Randall Martin; the person asking the question is Goddard-based science writer Adam Voiland.

    What was the most interesting thing you found from this analysis?  

    Why go to the trouble of making this map?

    What’s the heavy band of particulate matter in Africa? Is dust bad for our health?

    Martin: There’s no lower bound on health effects

    Have other researchers done this kind of analysis?

    Are these data ready for prime time?

    How did you combine data from both satellite instruments?


    –Adam Voiland, NASA’s Earth Science News Team

    What On Earth Was That #3 ?

    Last week, we showed you this mystery image. What was it? As a number of readers—including Brad Halderman (comment #3), Budi Prasteya (comment #7), and others—correctly guessed, you’re looking at a cropped version of one of the famous “sailing stone” tracks located on the Racetrack Playa in Death Valley National Park.

    Since the 1940s, researchers have documented the distinctive furrows behind rocks at a number of dried out lake beds in Death Valley. Yet, nobody has actually seen the rocks move or proven definitively how the tracks form. Animals, earthquakes, and gravity have all been ruled out. Some researchers have suggested that the composition of the rock might be a factor, but tests have shown most of the boulders are run-of-the mill dolomites, basalts, limestones, gneisses, and schists that aren’t unusually slippery.

    One of the best theories left standing: a combination of wind, mud, and ice. The area receives strong gusts of wind, and episodic bursts of rain that can create slicks of mud for brief periods. During cold weather, thin layers of ice can carpet the playa, and many scientists believe that wind, with the help of ice and mud underneath—has enough force to slide the boulders.

    Though science journalist Brian Dunning has an interesting video that shows the movement of ice on the playa, no one has filmed wind actually moving the rocks. In the meantime, researchers (including a recent group sponsored by NASA) continue to investigate the phenomenon, as a NASA news story reported earlier this summer. 

    –Adam Voiland, NASA’s Earth Science News Team

    The image above is available through  NASA Goddard’s photo and video flickr feed

    Earth Buzz: Beautiful Igor, Smoke, and More


    Beautiful Igor
    Astronauts have called the massive storm in the Caribbean
    “Igor the Horrible”, but from above the monster of a storm sure looks stunning. (Earth Observatory)

    Up in Smoke

    Fascinated by fire? It’s not just firefighters and arsonists. NASA researchers, such as Langley’s Elena Kukavskaya, make careers of tracking smoke. (Langley)

    Beetle-Mania
    Mountain Pine beetles could be priming the pump for huge wildfires in the Rocky Mountains. (NASA Explorer)

    GogBlog Video Rewind
    Hurricane Alley sends storms barreling up the Atlantic coast every year in late summer and early fall, but how do the giant storms actually form and why? (Geeked on Goddard)

    Evolution from Afar

    NASA’s ASTER instrument offers a satellite view of the world-famous Australopithecus Afarensis Lucy. (My Big Fat Planet)

    Icy Adventures
    Learn how just one satellite–the recently departed IceSat–measured the thickness of ice sheets, the health of sea ice, and even the height of the world’s forests. (Goddard Cryospheric Sciences Branch)

    Satellites, Ice Sheets, and Earth’s Shifting Surface(Oh My)
    New calculations suggest the melting of the Laurentide ice sheet has shifted Earth’s surface and center of mass. (JPL)


    Stayed Tuned

    The annual Arctic Ocean sea ice minimum is coming in the next few weeks (as is the annual maximum of the ozone hole over Antarctica). In the meantime, check out this snapshot of the polar region captured by Aqua in early September. (NASA.gov)

    Image courtesy of the NASA Earth Observatory

    What On Earth (Sound) Is That? #4

    Regular readers know the drill by now: Every other Friday we post a snippet of one of the many strange and fascinating bits of earth science that pass through our inboxes here at What On Earth, and then you all have a week to show off your science savvy by hazarding a guess (or two or three, if you’d like) in the comments. The last clue was an easy one, but we’re predicting this one–our first sound–will stump most of you.  Listen up, and prove us wrong…


    Remember, the answer usually has something to do with….
    a) Earth Science
    b) NASA


    Something on your mind? Email us suggestions and feedback at nasawhatonearth@gmail.com  

    Earth Buzz: Peering into Earl's Eye, Sailing Smoke, and More


    Flying Over Earl’s Eye

    Scientists aboard NASA’s DC-8 flying laboratory headed straight for Earl’s eye Wednesday as the storm bore down on the Eastern Seaboard. (GRIP Mission Page)

    Eerie View of Frank
    NASA’s Global Hawk snapped this extraordinary view of Tropical Storm Frank from 60,000 feet. (NASA.gov)

    Smoke Sailing High
    Satellites captured evidence that massive Russian fires lofted smoke aerosols an impressive 12 kilometers up. (Earth Observatory)

    El Niño Strengthens
    A new type of El Niño, which has its warmest waters in the central-equatorial Pacific Ocean, rather than in the eastern-equatorial Pacific, is becoming more common and progressively stronger. (JPL)

    New Earth Observer
    Take a look at the latest issue of the Earth Observer [pdf] for details about NASA projects Aquarius, SORCE, and AIRS. (Earth Observer)

    The Dynamic Earth
    Yep, as this video nicely lays out, NASA studies that. In fact, understanding and protecting the planet is a key part of NASA’s mission. (EOSPOS)

    Tweet of the Week
    NASA GRIP MISSION PHOTO! Hurricane Earl Caught in a GRIP – image taken from the DC-8 aircraft today over Earl:… http://fb.me/Ih2s7jq2 (NASAHurricane)

    –Adam Voiland, NASA’s Earth Science News Team

    Larger image available here