What to Expect from the Arctic

Guest science writer KarenRomano Young reports from the ICESCAPEmission:
The U.S. Coast Guard Cutter Healy, our chunky red-and-white icebreaker, sits at the gates of the Arctic Ocean. In the wee hours this morning, the sun set and quickly rose again, and a rainbow stretched up into low clouds. The ICESCAPE mission had reached station 5 of a seven-stop transect of the Bering Strait, between Fairway Rock — resembling Kong Island, but with pointy ears — and Little Diomede (U.S.) — something like the “Cliffs of Insanity” in The Princess Bride. Close by is Big Diomede (Russia), topped with fog.

Movie references aside, this is a dramatic spot in which to find yourself when you wake up in the morning — or in the evening, as is the case for the half of the science crew working the night shift to process the samples.

It seems that no matter how many times a scientist has been to sea, it doesn’t get old. Greg Mitchell (below right), a specialist in ocean optics from the Scripps Institution of Oceanography, reckons he has spent about four years of his life aboard ships. His first trip to the Arctic was in 1987, his first year at Scripps. Mitchell’s research has taken him all over the world — to Antarctica and back again many times — but he hasn’t been inside the Arctic Circle since 1989. He expects change. Greg Mitchell

Observing the system…..and how it interacts with the edge of the sea ice…..and what’s going on with the ice melt…..and how it affects the ocean…..those principles won’t be any different than they were 20 years ago. “What we’re clearly seeing is that the sea ice is reducing more and more all the time,” said Mitchell. “This means less sunshine reflecting off the ice back into space, and more getting into the ocean.”

He expects the increase in sun-light on the sea to do three things:

  • “The light that’s not reflected will heat the ocean, accelerating the warming and accelerating the melting of the sea ice.”
  • “As the ocean warms it becomes more stratified. If you dive in a lake in the summertime, it’s warmer at the surface. But as you dive down, you feel the cold. That’s because the warm water is lighter than the cold water, and it stays at the surface. That’s thermal stratification. As you warm the ocean, it’ll stratify more and that will create a warm layer with a lot of light for algae to bloom (as long as they have nutrients).”
  • “More light in the ocean should cause more total photosynthesis in the Arctic, so we’ll lose habitat for polar bears but we’ll gain habitat for plankton.”

Like the rest of us, Mitchell is concerned about that. “I’m not saying it’s a good trade off. I think we should leave things alone. But the system’s changing, and as it changes we don’t know what the consequences of those changes will be. It’s hard to say what we could do. What we really need to do is to find a way for humans to have smaller footprint on earth. So we need to understand the processes better and then we need to model it.”

That’s why he’s here.

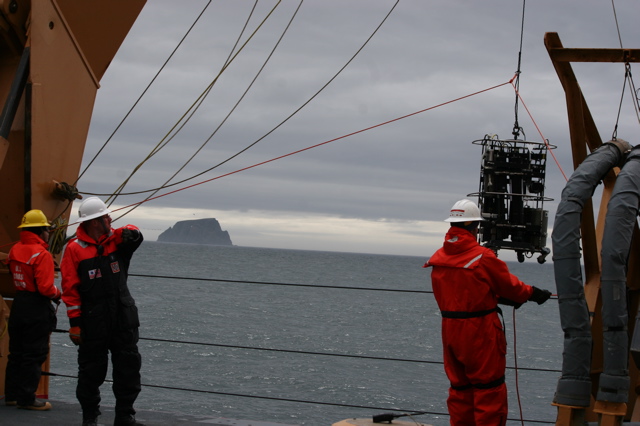
Mitchell, along with his group from Scripps, is involved in ground-truthing the optical properties of the Arctic Ocean (photos at the top and bottom of this post). That is, he’s helping to ensure that what they see at the surface squares up with the methods NASA satellites use to assess ocean color, an indicator of the level of chlorophyll and, by proxy, phytoplankton. NASA’s satellites measure the color of the ocean by flying over the earth and picking up blue, blue green, and green. If there’s not a lot of algae, the ocean is blue. If there is a lot of algae, the ocean is green.

But color is just one way of looking at phytoplankton levels. In order to truly assess the situation — for example how much carbon dioxide the phytoplankton are taking in – scientists need to assess the processes at work in the sea. “The optics don’t tell us this, so we have to take water samples, process the water, and then relate that to the optics we measure from the ship,” Mitchell said.

The global mapping you can see on the NASA site uses mathematical equations developed from the shipboard work. Satellite validation and calibration is based on the findings of scientists who go to sea and study the water to see what’s living there. Mitchell’s research group claims responsibility for about 20 percent of the global observations used by NASA for their models to convert satellite-measured optical measurements to chlorophyll estimates.

lowering gear from the Healy

The data contributes to models that allow prediction of primary production — the growth and health of organisms — under various conditions. Mitchell’s instruments include a small optical profiler — a fish-shaped instrument lowered from the Healy’s bow — and an optical package of instruments that measure water properties when it is lowered from the powerful A-frame at the stern.

“As ecologists, we don’t want to just know what color the ocean is,” he said. “We want to know how much plankton there is.” He walks to the edge of the ship and looks over the rail. “Now what we’re seeing out here is green water. There’s a lot of chlorophyll.” That means a strong pulse of phytoplankton, busy photosynthesizing the extra sunlight.

All photos shot by and courtesy of Karen Romano Young

Soaring for Science

NASA's Global Hawk autonomous plane

The newest bird in NASA’s flock — the unmanned Global Hawk — took off at 7 a.m. Pacific time today (April 2) from Dryden Flight Research Center at Edwards Air Force Base in California. The flight is the first airborne checkout of the plane since it was loaded with 11 science instruments for the Global Hawk Pacific (GloPac) mission.

Pilots are also streamlining processes to coordinate the workload while the nearly autonomous plane is flying at altitudes above 60,000 feet (almost twice as high as a commercial airliner). Operators and mission researchers are using the day to make sure all instruments are operating properly while in flight — particularly at the cold temperatures of high altitude — and communicating clearly with the plane and ground controllers. Mission participants expect to begin collecting data when actual GloPac science flights begin over the Pacific Ocean later this month.

GloPac is the Global Hawk’s first scientific mission. Instruments will sample the chemical composition of air in Earth’s two lowest atmospheric layers — the stratosphere and troposphere — and profile the dynamics and meteorology of both. They also will observe the distribution of clouds and aerosol particles. The instruments are operated by scientists and technicians from seven science institutions and are funded by NASA and the National Oceanic and Atmospheric Administration (NOAA).

Paul Newman, the co-mission scientist for GloPac, has been blogging about the mission on Earth Observatory’s “Notes from the Field” site. Here are a few excerpts to whet your appetite…

…There is an old Latin quote: “Maxima omnium virtutum est patientia.” Or “patience is the greatest virtue.” When it comes to mounting science instruments on an aircraft, you need to continually return to that quote…

…During the integration this week, we’ve had to cut holes into the aircraft. I told Chris Naftel, the Global Hawk project manager, that we had to cut some holes into the plane for the Meteorological Measurement System. Chris replied: “I don’t want to hear anything about the holes. It pains me!” In spite of Chris’ pain, the little holes are critical for measuring winds. You’re now asking, what? Little holes? For winds? It’s actually a very slick little measurement that relies on the work of Daniel Bernoulli, a Dutch mathematician who lived in the 1700s…

Read more here …

Are the Oceans Really Stuffed to the Gills with Carbon Dioxide?

Two months ago, NASA’s Timothy Hall and colleagues published a study that described how they had estimated the amount of manmade carbon dioxide absorbed by the ocean since the start of the industrial era.

Oceans absorb about a third of the carbon dioxide that humans release into the atmosphere, so sorting out a long-term record of carbon uptake is of great interest to climate scientists.

To create their record of the ocean’s uptake of carbon, Hall and Samar Khatiwala, the lead author of the study, devised a clever mathematical technique that proved to be a considerable advance. When Hall’s study appeared in the journal Nature, he assumed the creation of this new long-term, continuous record would headline the news.

But journalists gravitated toward something else entirely: a brief mention that the amount of carbon dioxide absorbed by the ocean seemed to be experiencing, as the researchers put it, “a small decline in the rate of increase in the last few decades.”

“Seas Grow Less Effective at Absorbing Emissions”, one headline trumpeted. Another article compared the world’s oceans to a fish “stuffed to the gills” with carbon dioxide and another reported a “sudden and dramatic drop in the amount of carbon dioxide being absorbed by the sea.

Given the caveats included in the original study, all of this caught Hall slightly off guard. I’ll let Hall, who summarized his reactions to the coverage for What On Earth, pick the story up from here:

My coauthors and I had viewed the ability to estimate the history of ocean uptake of anthropogenic carbon as the highlight of the paper. Previously, observationally-based estimates had only provided a few snapshots in time, and we were proud of the cleverness of our techniques.

It seems clever mathematical techniques, however, don’t make good press releases. Interestingly, coverage of the paper has not focused on the fact that we can estimate the uptake history. Instead it has focused on apparent reductions in the rate of uptake over the last 2 decades.

The figure below shows our estimate of ocean uptake since 1775. The first impression is the rapid increase since 1950, coinciding with the rapid rise in carbon emissions to the atmosphere. The oceans have prevented about 1/3 of anthropogenic carbon emissions from accumulating in the atmosphere. A closer reading of the curve reveals a reduction in the uptake’s rate of increase after about 1980, even while emissions continue to increase.

Scientists have long suspected that ocean carbon uptake would eventually be unable to keep pace with rising emissions. Basic aqueous chemistry tells us that, as dissolved carbon in seawater increases, seawater becomes less able to absorb new carbon. Eventually, the absorption saturates. The slowing down of the increase rate may be an early signal of this saturation.

However, recent changes in uptake were not our focus when we performed the study, and more importantly we did not analyze the statistical significance of the slowdown. We plan further analysis on these trend variations. What we can say is that there are physical reasons to suspect a reduction in the ocean’s capacity to keep pace with increasing carbon emissions, and that there are now strong observational hints for recent reductions.

Hall advises reading this story, which also appeared in Nature. It’s less dramatic and more technical than most of media accounts, but it is a more accurate representation of the paper.

–Adam Voiland, NASA’s Earth Science News Team
   Image Credit: (EPOD/K. Chrisodoulopoulus)

Deep Thoughts on the Ocean and a Scientist's Responsibility

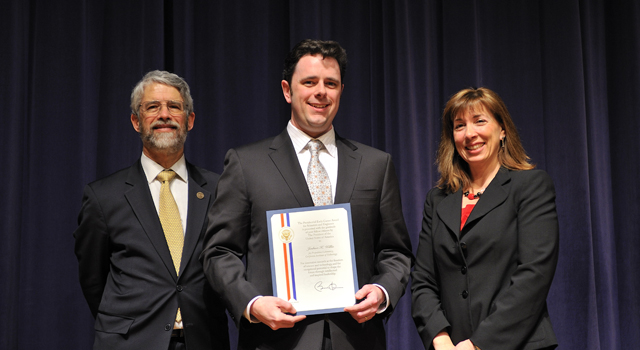
Oceanographer Josh Willis of NASA’s Jet Propulsion Laboratory was recently honored by the White House as a recipient of the Presidential Early Career Award for Scientists and Engineers (PECASE). Willis studies the ocean — particularly the height of the sea surface — with satellite data, though he also works with colleagues who put instruments below the surface of the water. By blending such measurements, he has already made a scientific mark in the study of sea level rise. We caught up with Josh — shown below with White House science advisor John Holdren and NASA deputy administrator Lori Garver — to discuss his inspiration, the importance of the ocean, and the necessity of communicating science.

WhatOnEarth: When you were a child, what did you want to be when you grew up? When did you decide you wanted to be an ocean scientist?

Josh Willis: When I was 9 or 10, I found a book about Einstein’s Theory of Relativity that my parents had lying around the house. I remember reading it and then peppering my parents with questions they couldn’t answer. (This was long before Google, mind you.) So for a long time, I wanted to be a physicist. A couple years of graduate school in physics convinced me otherwise, and I started studying oceanography at the Scripps Institution of Oceanography. Studying the ocean and climate appealed to me because I got to use all the physics and math I learned, but it was also closer to home and of practical importance to a lot of people. Plus, it’s just fun to say “oceanographer” whenever people ask me what I do.

WhatOnEarth: What is the best scientific paper you have written?

Willis: It’s tough to say. Sometimes the papers I think are important are different from the ones that other scientists remember best. But my papers on the causes of sea level rise — based on comparisons between satellite altimeter data, observations of ocean temperature changes, and changes in ocean mass measured by the GRACE satellite — were interesting and fun to write.

WhatOnEarth: What is the most important thing that few people know about the ocean?

Willis: The ocean is the silent martyr of global warming. We always think of global climate change in terms of the warming atmosphere, but it is actually the ocean that absorbs almost all of the extra heat and a whole lot of CO2. The warming contributes to sea level rise and changes ocean ecosystems, while the extra CO2 makes the ocean more acidic, threatening plankton and other tiny critters that make up the foundation of the oceanic food chain.

WhatOnEarth: Why do you feel compelled to talk to the public about your science?

Willis: Communicating our work is a really important part of doing science that most scientists sort of neglect. Figuring out new things about the world around us is only helpful if we communicate them to everyday people. Plus it’s fun and exciting to talk to non-scientists because the questions are often fun and interesting, and I come away feeling inspired and invigorated.

WhatOnEarth: What is the funniest or strangest question you’ve ever gotten?

Willis: I often get a chuckle out of the people who say that global warming is a vast conspiracy among scientists. Scientists love to prove each other wrong, and most of the time we can barely agree on simple questions like “why is the sky blue,” much less orchestrate a conspiracy.

WhatOnEarth: Is the PECASE award an affirmation or an inspiration for your career?

Willis: This is definitely a great honor and inspiration. When President Obama met with us, one of the first things he told us was how nice it was to honor a group of scientists still in the early stages of our careers. “All of you folks are younger than me!” he said. But he also made it clear that he expected a lot from us in the future. That’s a pretty big inspiration when the President tells you he’s expecting great things. And it’s a pretty big responsibility, too. I guess that means it’s probably time to get back to work now…

Mike Carlowicz, NASA’s Earth Science News Team

Rising Temperatures in the Midst of Heavy Snow?

The last few months have been a bit odd. Too much snow in the mid-Atlantic. Too little for the Winter Olympics in Vancouver. And a dusting nearly everywhere else. Meanwhile, a blizzard of confusing and often conflicting commentary has left many people asking: Is the climate really warming? Warming faster than ever? Or perhaps just weirding out?

Since NASA scientists have been tracking global temperatures and climate change for decades, we checked in with researchers from across the agency to get their take on the state of Earth’s climate (which, it’s worth noting, isn’t the same thing as Earth’s weather). The result is a collection of feature stories, videos, and web interactives that describe what we’ve found on NASA’s Global Climate Change Site. Here’s a sampling:

•     Why the Arctic Oscillation has made this winter one to remember (Article)

•     How the ocean’s natural rhythms can hide or accentuate global temperatures (Article)

•     Why the last decade has been the warmest on record (Article)

•     On the record about the temperature record (Q&A)

•     Piecing together the temperature puzzle (Video)

•    2009 Temperature update (Video)

•     Sorting out the squiqqles in the global temperature record (Interactive graphic)

•     Watching the world’s changing temperature (Data Visualization)

•     Snaps from space: The impact of a warming world (Image gallery)

–Adam Voiland, NASA’s Earth Science News Team

Greenhouse Molecules Laid Bare

The Earth is a bit like the human body; its temperature is very finely balanced, and when it gets slightly out of whack, big things can happen. In the case of our home planet, gases in the atmosphere play a vital role in maintaining this delicate equilibrium, by balancing the absorption and emission of all the electromagnetic radiation (microwaves, infrared waves, ultraviolet light and visible light, for example) reaching the surface of the Earth.

As reported recently, the Earth is getting warmer. Scientists believe the main driver behind this warming trend is rising levels of man-made greenhouse gases. These gases, which we pump out into the air, act to trap heat radiation near the surface of the Earth that would otherwise be sent back out into space. Carbon dioxide (CO2) is the Paris Hilton of greenhouse gases, and gets a lot of face time because its concentration in the atmosphere has increased relatively rapidly since the Industrial Revolution. But methane, nitrous oxide, hydrofluorocarbons (HFCs), chlorofluorocarbons (CFCs) and perfluorocarbons (PFCs) are also important agents of global warming. Some of them are actually much more potent than CO2 and they stick around for hundreds to thousands of years longer. This has some scientists concerned that these B-listers could actually impact global temperatures significantly more than CO2.

greenhouse warming cartoon

In a new paper, Partha Bera and colleagues at NASA’s Ames Research Center and Purdue University put these gases under the microscope to find out exactly why they are such powerful heat trappers. They focus on CFCs, HFCs and PFCs — all chemicals containing fluorine or chlorine — that are used in medicine, fridges, and as solvents, among other things. By probing the molecular structure of these compounds, they have found that molecules containing several fluorine atoms are especially strong greenhouse gases, for two reasons. First, unlike many other atmospheric molecules, they can absorb radiation that makes it through our atmosphere from space. Second, they absorb the radiation (and trap the heat) very efficiently, because of the nature of the fluorine bonds inside them. (In technical terms, fluorine atoms create a larger separation of electric charge within the molecule, and this helps the molecular bonds absorb electromagnetic radiation more effectively.) HFCs and other fluorine-based gases have been called “the worst greenhouse gases you’ve never heard of.” Now we know why.

Until now, scientists had not looked in detail at the underlying physical or chemical causes that make some molecules better global warmers than others. Bera and colleagues say that their work should help improve our “understanding [of] the physical characteristics of greenhouse gases, and specifically what makes an efficient greenhouse gas on a molecular level.” They hope their findings will be used by industry to develop more environmentally-friendly materials.

Amber Jenkins, NASA’s Global Climate Change team 

An Award-Winning Scientist Who Came in from the Cold


NASA-funded researcher Ben Smith digs a snow pit at a West Antarctic Ice Sheet Divide core
site to try to infer the annual rate of snowfall. Credit: Ben Smith

Researchers who study glaciers and polar dynamics often get into it for the love of the field work — the challenging terrain, technicological adventures, and thigh-deep snow.

Benjamin Smith, a researcher at the Polar Science Center at the University of Washington’s Applied Physics Laboratory, was no exception. As a fledgling physicist in the 1990s, his first summer job after college turned into an eye-opening adventure — a 3-month stint at the Kamb Ice Stream in Antarctica as a field assistant mapping buried crevasses with snow-penetrating radar. The rest, as they say, was history.

These days, Smith is enjoying a rare honor as one of two NASA-supported researchers to receive the Presidential Early Career Award for Scientists and Engineers (PECASE), awarded at a White House ceremony last month.

WhatOnEarth: Field work was your entry into studying glaciers. Are you involved  in Arctic or Antarctic field work now?

Smith: After a few years of field work, I discovered that though being out in cold is great, the quicker way to learn about glacier change is by doing remote sensing work. That requires a great deal of data analysis indoors. So with that notion, I got onboard as part of NASA’s ICESat I mission while working on my doctorate in physics.

WhatOnEarth: What work do you believe was the basis for your presidential award?

Smith: Well, I have a few projects that I’ve been fortunate enough to be involved in.

Not too long ago, I wrote a paper where we found that several lakes beneath the glaciers in Antarctica have gained or lost water in the last five years, and at a rate much faster than things usually happen in Antarctica. We’ve been seeing lakes that fill or drain in half a year. In one case, 3 cubic kilometers of water drained last year from one of these lakes. That’s about the size of Lake Washington in Seattle.

My main objective in all of this is to figure out where that water went and how it has affected other subglacial lakes and glaciers downstream. Have those glaciers sped up from the water flowing under them? The warmth of the surface bed beneath glaciers allows them to slide faster. If you add more water, there’s potential for glaciers to slide faster. 

I’m also part of a team that is helping to design the ICESat II satellite – a project we hope will build on the success of ICESat I. The satellite will boast several laser beams rather than one, so it’ll provide much better spatial coverage of the Earth’s surface to measure glacier mass and area.

 
President Obama honored PECASE awardees, including Ben Smith and Josh Willis, in January at the White House.
Credit: The White House


WhatOnEarth: Were you aware that you’d been nominated for the PECASE award?

Smith: No. I was completely unaware of it until I was notified by the FBI about a background check! I can tell you I was relieved when I found out the background check regarded my visit to the White House. I understand now that my nomination was put forward by colleagues at NASA. Somehow, my nomination came out on top of the pile, and that’s pretty cool.

To read a few of Ben Smith’s ICESat-related scientific papers, click the topics below.

Ice stream elevation changes observed by ICESat

Increased flow speed on an East Antarctic glacier

An inventory of subglacial lakes detected by ICESat

Gretchen Cook-Anderson, NASA’s Earth Science News Team


How Do Global Soot Models Measure Up?


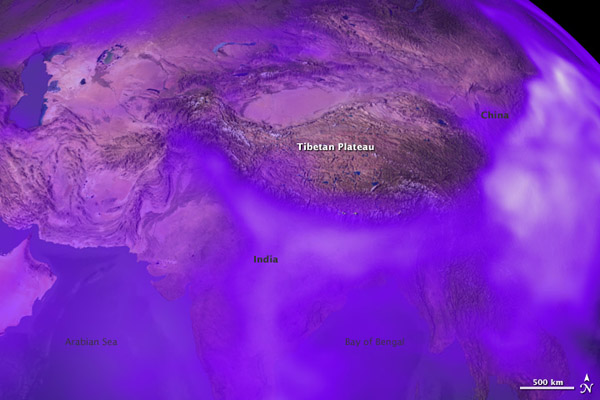
A image from a simulation that shows the spread of black carbon aerosols in Asia. Areas where the air was thick with
the pollution particles are white, while lower concentrations are transparent purple. (Credit:
Earth Observatory)

As NASA atmospheric scientist Eric Wilcox recently told Time magazine, emerging evidence suggests that a short-lived type of air pollution called black carbon—known popularly as soot—can exacerbate global warming by absorbing incoming solar radiation.

Yet pinning down precisely how much the black carbon exacerbates warming is no easy task, research conducted by Goddard Institute for Space Studies climatologist Dorothy Koch suggests. The study, published in Atmospheric Chemistry and Physics tracked how the predictions from 17 global black carbon models compared with actual measurements collected by airplane, satellite, and ground-based sensors. It shows, among other things, that models generally underestimate black carbon’s warming effect on climate.

Koch tested all the models in three ways. In the simplest of the three, she compared the models’ predictions to the amount of black carbon measured at the surface, finding that they matched real life reasonably well.

Her second test compared the models’ predictions to black carbon measurements made higher in the atmosphere using airplanes, and the results were much less clear cut. Though the models usually had too much black carbon over pollution sources, most had too little over remote regions such as the Arctic.

Koch’s final and most important test looked at how much solar radiation black carbon actually absorbs, an indicator of the amount of warming the particles actually produce. Again, the results were mixed. The models were largely accurate over North America and Europe, but were not for areas that have high levels of black carbon such as Central Africa, Southeast Asia, and the Amazon.

In a write-up on the Goddard Institute for Space Studies web site, Koch summarizes her findings this way:

We concluded from this study that most models have enough black carbon at ground level in polluted regions, too much in the atmosphere above source regions, but not enough in the Arctic where black carbon may play an important role in contributing to Arctic warming and ice/snow melt. The models’ soot generally does not absorb enough sunlight and therefore these models would underestimate black carbon heating effects. This probably results from underestimating the absorbing properties of the particles rather than the amount (mass) of black carbon.

Wondering how climate modelers can continue to close the gap between model predictions and reality? Koch put forward some advice on how to fine-tune the next generation of aerosols models. Her top three:

1) Account for mixing between black carbon and other components of the atmosphere,
2) Incorporate better measurements of particle size and source amount in some regions.
3) Continue to mine ongoing satellite and field campaigns for data about black carbon.

You can read more GISS science briefs and NASA news stories about black carbon here, here, and here.

–Adam Voiland, NASA’s Earth Science News Team