By Andrew Dzambo / SÃO TOMÉ AND PRÍNCIPE /
Andrew is a PhD student at the University of Wisconsin-Madison.
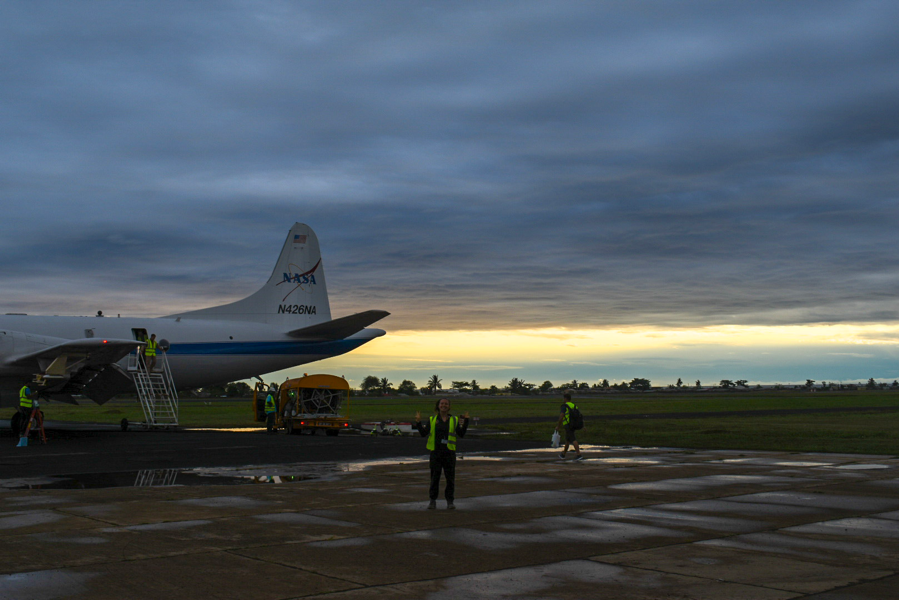
Climate models are essential tools to predict climate’s evolution in the next few decades and beyond. Given current computational capabilities, most global models cannot resolve every scale and process; therefore, we often parameterize (i.e. simplify) the mathematical representation of the processes to obtain results in a reasonable amount of time.
Cloud processes are among the most difficult to parameterize for a number of reasons: clouds form on many different spatial scales, have highly variable time scales, and require simultaneous knowledge of a large number of factors that affect their evolution. Precipitation processes are even harder to capture in climate models because they occur on more highly variable spatial and time scales.
Additionally, the presence of aerosols, such as smoke or dust, further complicates the problem because aerosols’ effects on cloud and precipitation processes often depends on the type and amount of aerosol present. Overall, our knowledge of how aerosols interact with clouds and precipitation is highly uncertain, especially over remote areas like the ocean. In order to better understand these processes and their impacts on the global radiation and energy budgets – essentially, how heat moves around our planet – we require highly accurate measurements of these aerosol and cloud interactions.
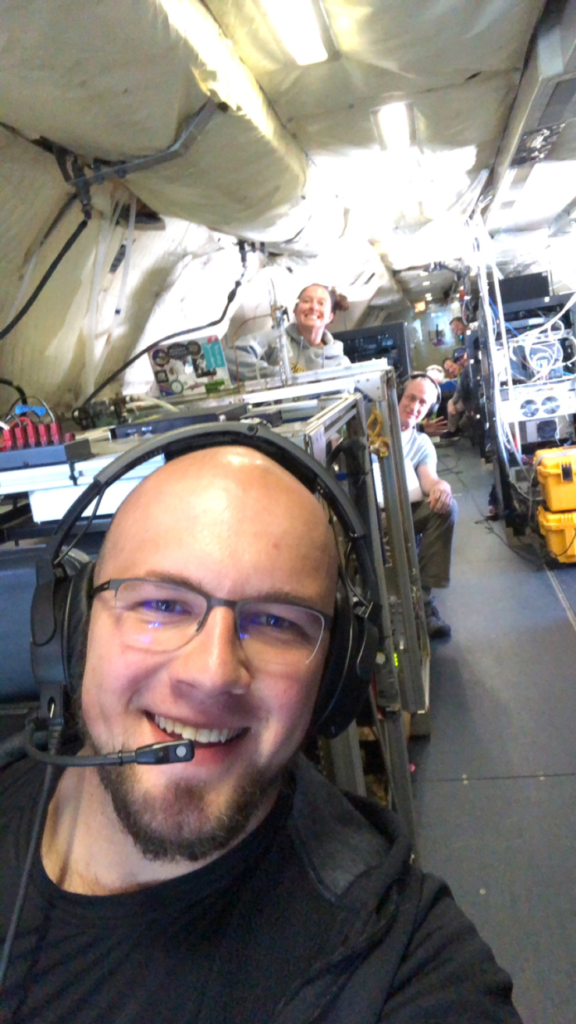
NASA’s Observations of Aerosols above Clouds and their Interactions, or ORACLES, field campaign has set out to do just that. We are collecting a highly thorough, robust dataset aimed at challenging our current theories about cloud/aerosol interactions and how aerosols affect cloud and precipitation processes in stratocumulus clouds. These clouds might not be as visually stunning as ones associated with severe weather, but to atmospheric scientists, they are very important because they cover a large fraction of Earth’s subtropical oceans and have a large impact on earth’s energy budget. The ORACLES campaign, taking place over the Southeast Atlantic Ocean, bridges an observational data gap where ground and airborne observations are presently limited.
Weather radars were first developed during World War II, and radar technology has since expanded considerably. In the United States, WSR-88D radars are capable of observing (nearly) the entire country and are capable of notifying meteorologists of impending rain, snow, or destructive storms. But these radars are designed primarily to detect rainfall or ice particles larger than a small drizzle droplet. However, stratocumulus clouds are made up of even tinier cloud droplets, so the weather radar is not the best observing tool for them. Instead we need a radar system specifically designed for cloud detection.
Enter the NASA Jet Propulsion Laboratory’s 3rd generation Airborne Precipitation Radar (APR-3). With development beginning back in 2002, this radar system operates at three frequency bands used to measure thin clouds and light precipitation (W-band), light to moderate precipitation (Ka-band) and moderate to heavy precipitation (Ku-band). This is the first airborne radar system capable of measuring the atmosphere at three frequencies for the same location, which means it can simultaneously detect clouds and precipitation.
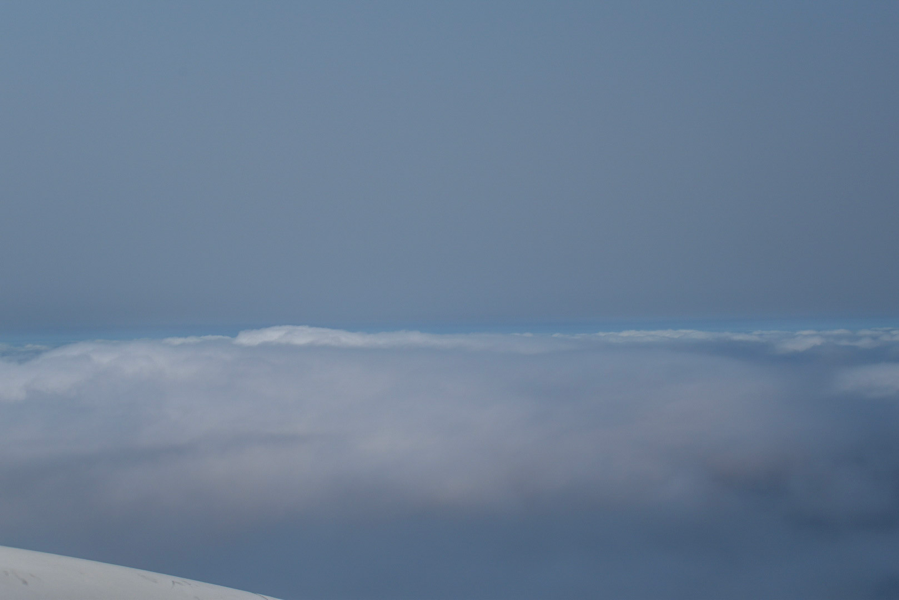
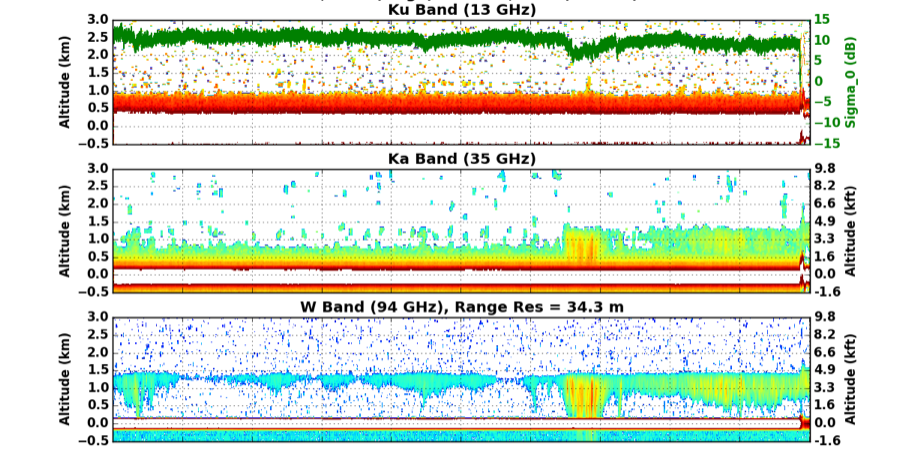
During the ORACLES campaigns from 2016 through 2018, the stratocumulus cloud decks we see most often frequently go undetected by the lower frequency Ku and Ka channels. But by including the high frequency W-band radar we can now see the stratocumulus cloud and characterize its structure at a very high resolution.
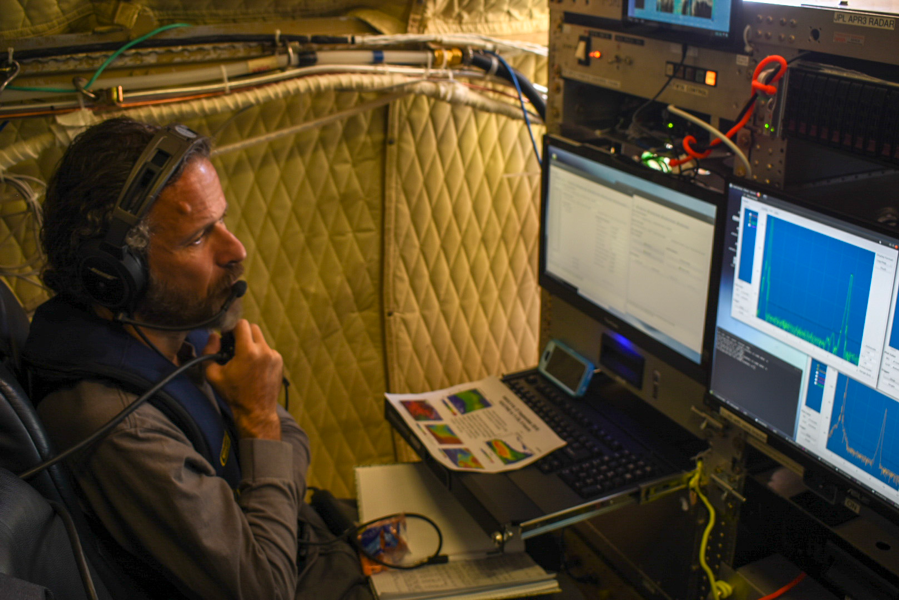
Occasionally, the APR-3 system in ORACLES measures both the cloud and precipitation. Detecting precipitation in multiple radar frequencies is useful as the high frequency W-band measurements commonly attenuates when precipitation gets too heavy – meaning the signal is somewhat lost because precipitating raindrops are too large. On the other hand, the other radar bands (usually Ka-band for ORACLES) can see this precipitation with little to no fading of the signal. The end result is that the multiple channels gives us the ability to better characterize the precipitation that’s happening. In turn, that gives us an opportunity to possibly provide a more accurate estimate of precipitation magnitude in these stratocumulus regions.
The ORACLES APR-3 contributes one component of a highly robust dataset designed to study the effects of aerosols on cloud and precipitation processes. Other direct and remote sensing instruments from the ORACLES field campaign collect highly detailed information about aerosol type and amount in the atmosphere – both of which are needed to properly assess cloud/aerosol interactions and their net effect on precipitation. Ultimately, ORACLES will greatly improve how we describe aerosol/cloud/precipitation interactions in future climate models.
