By Ellen Gray /NASA’S WALLOPS FLIGHT FACILITY, VIRGINIA/
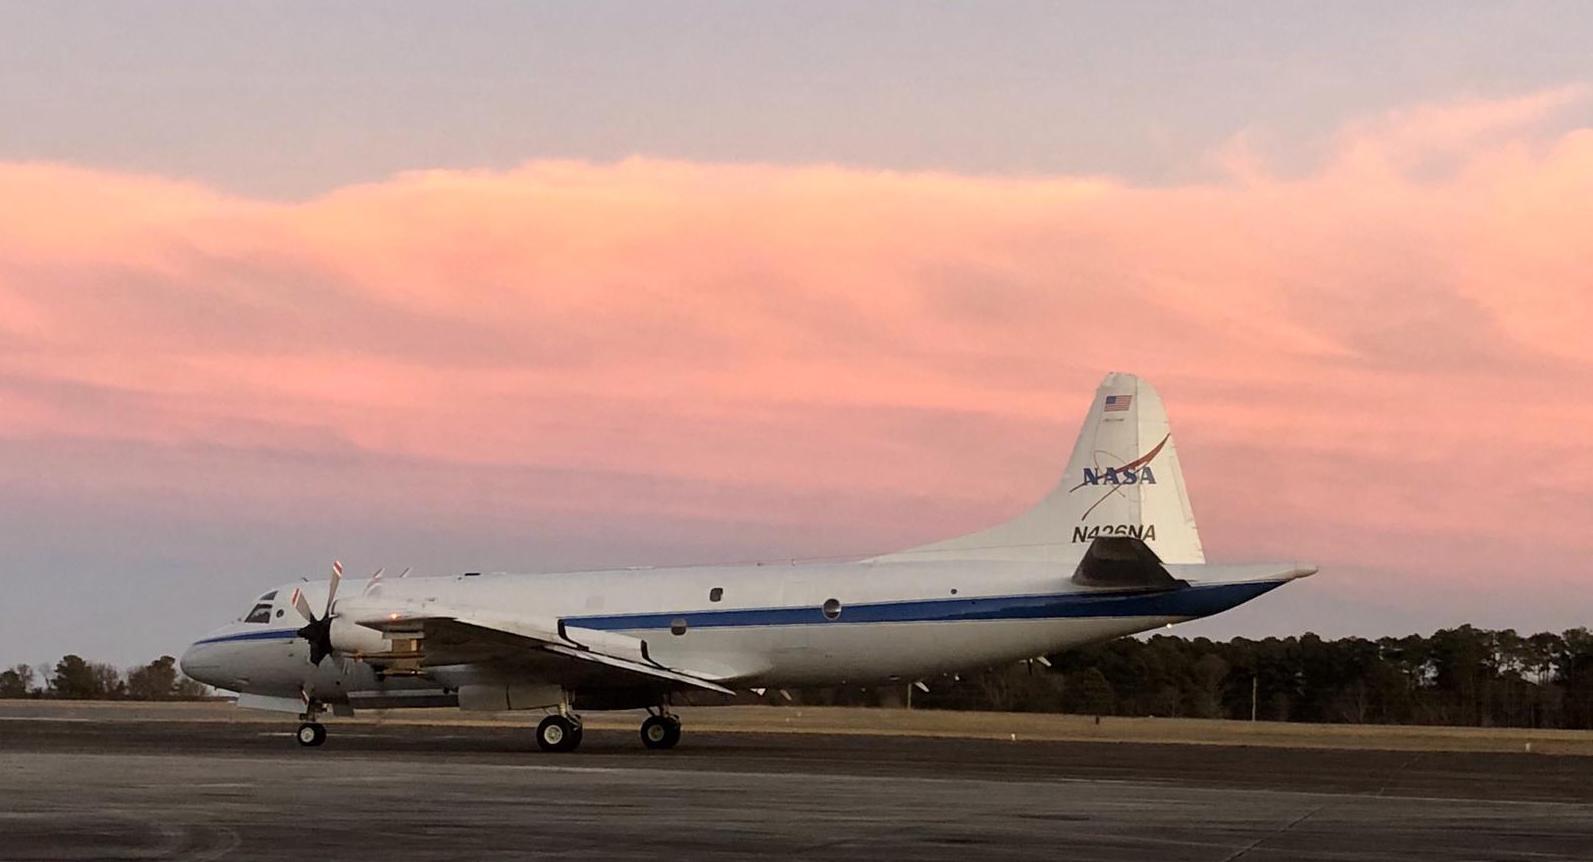
After a cloudy and rainy morning, by 1:50 pm the sun had come out and the skies were clear for take-off at NASA’s Wallops Flight Facility in Virginia. The P-3 Orion research aircraft outfitted with eleven instruments to measure conditions inside snow clouds was heading north to a storm system over New York and Vermont for the second science flight of the Investigation of Microphysics and Precipitation for Atlantic Coast Threatening Snowstorms, or IMPACTS field campaign.
NASA’s high-flying ER-2 was already in the air. Based out of Hunter Army Air Field in Savannah, Georgia, it had an extra hour to fly so that the two planes—the ER-2 at 60,000 feet and the P-3 starting at 18,000 feet—would arrive at the same time and fly along the same path to make simultaneous measurements.

Since we were flying into bad weather, I was worried about a bumpy ride—and we got it. Our flight path led us out over the ocean first to approach Long Island from the south. At thirty minutes after take-off Claire Robinson from NASA’s Langley Research Center prepped the first of two dropsondes to drop from a tube at the back of the plane into the storm over the ocean. A dropsonde is a small instrument package in what looks like a paper-towel roll. It has a parachute and a radio transmitter that sends data on temperature, humidity and wind speed as it falls, giving a vertical profile of the atmosphere from the plane to the ground.

While Claire was watching her monitor for the plane to be over the right spot, we hit turbulence that made it feel like we were going over bumps on a roller-coaster. It got bad enough we needed to return to our seats in the ten minutes between the first and second dropsondes. The turbulence evened out fairly quickly though, especially once we were back over land where the upward movement of air was less severe. Bumps returned periodically throughout the flight, but it ended up being smoother overall than expected.
After the dropsondes were away we continued north over Connecticut and western Massachusetts where we turned left to start the first of three bowtie flight patterns, two over southeastern New York and one over Vermont. Bowties are these large triangular patterns that approach the storm from many different angles.


“The atmosphere is not a layer cake,” said atmospheric scientist Sandra Yuter from North Carolina State University, when I spoke with her before the flight. She’s in charge of plotting the flight paths to maximize the science measurements based on the forecasts two-days ahead of time, which she then sends to the pilots and aircraft coordinators who will iterate on it to make the final flight plan.
The atmosphere is instead more like a cake with a marbled interior—swirls and wiggly lines sliced one way, large patches and different swirls when sliced another. “We’re not expecting the same cross-sections in different parts of the storm,” Sandra said. “Bowties give you those multiple angles.”
At the top of the first bowtie over New York, we started out at 18,000 feet, high above the freezing level (0°C). (About half-way through we descended to 16,000 feet at the request of Air Traffic Control.) Mike Poellot of the University of North Dakota and today’s Flight Scientist, sitting in the cockpit to coordinate between the science team and the pilots, asked over the headset, “Cloud probes what are you seeing?”

In the main cabin, Greg Sova, a grad student at the University of North Dakota and Starboard Wing Instrument Operator, answered the first of many such check-ins. On his monitor, streams of tiny pictures from his instrument scrolled by. The tiny pictures were of cloud, ice, and snow particles, most less than a millimeter big, that had just been imaged at ~300 mph.
On that first pass of the bowtie, he was seeing from the cloud probes, “Columns and dendrites but a lot of shattering.”

Columns and dendrites are types of snow crystals and were also common in later check-ins as we continued on. So were aggregates, a bunch of snowflakes stuck together in a mass, thin needles, and at lower altitude, spheres that were probably water droplets as we did the second bowtie at lower altitude where the air temperature was warmer. Sometimes it was mix of all three. At times it would switch back and forth as we passed through air with different characteristics—remember that marble cake analogy?
At one point on the northern bowtie over Vermont, Greg reported that we’d passed from seeing more liquid droplet spheres to being back in crystals of snowflake plates, dendrites, with a column or two. Then he added, “And as soon as I said that we’re back into small spheres.”
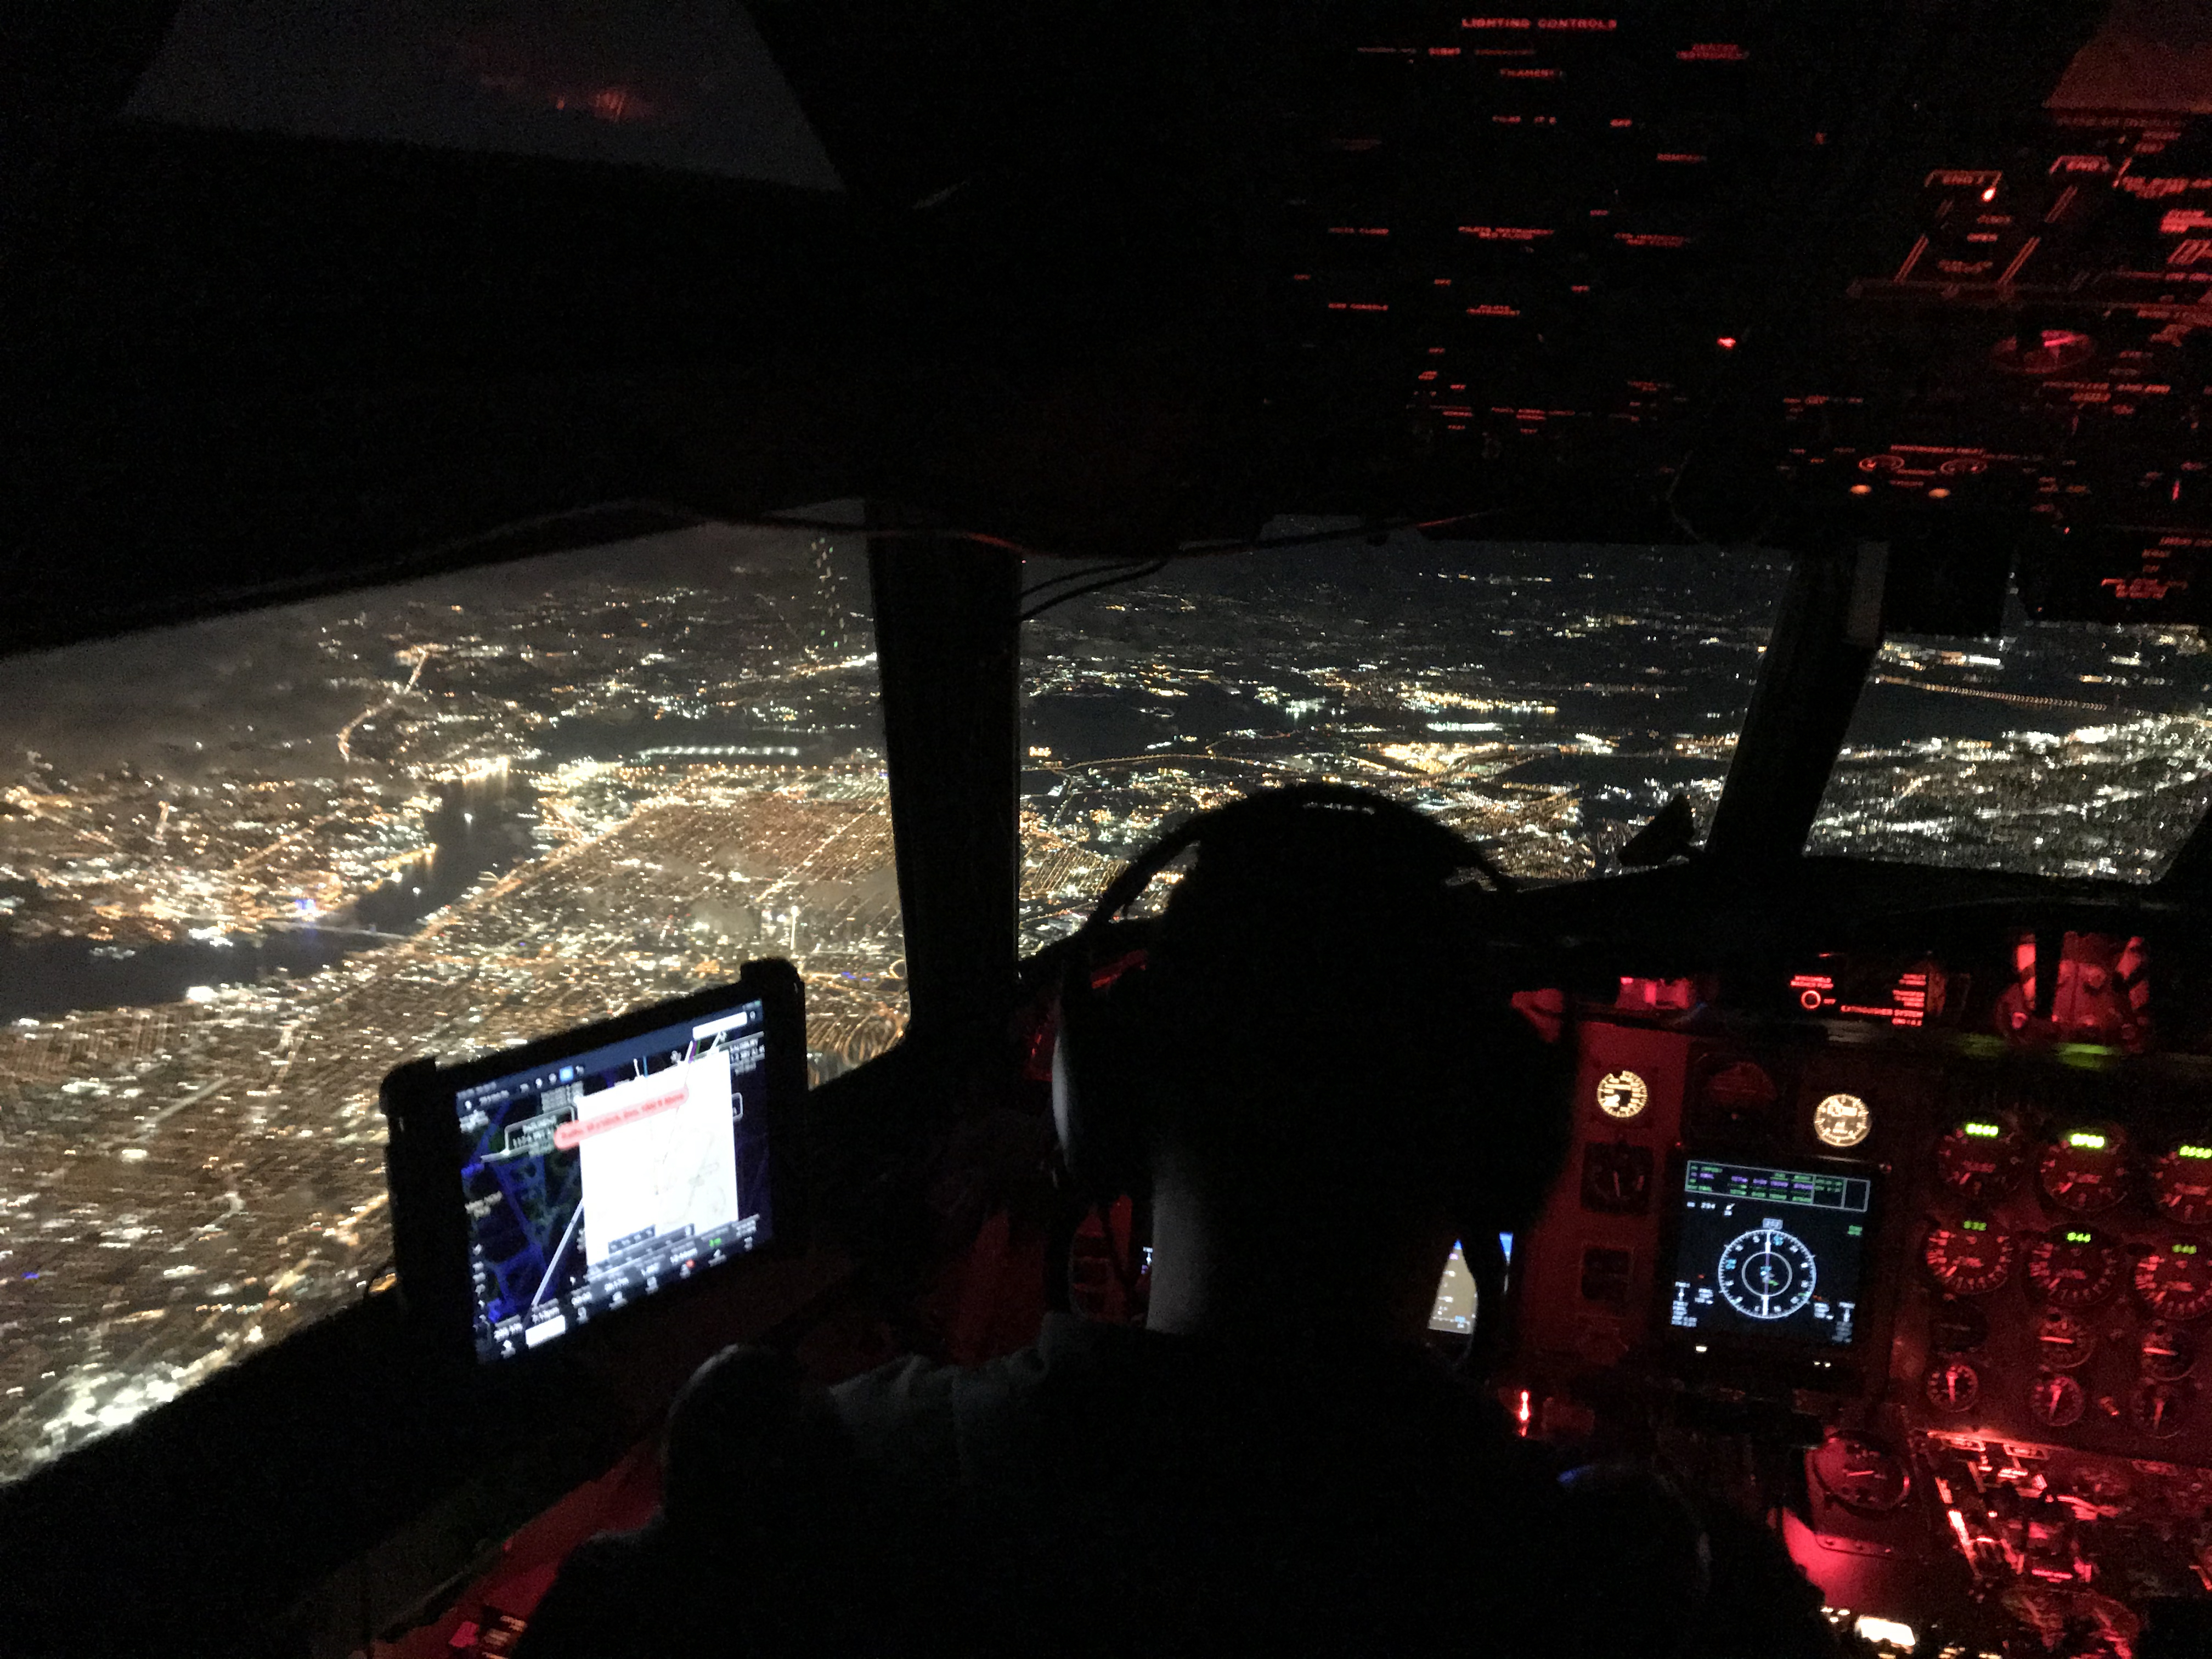
While the P-3 flew through the clouds, the ER-2 paced us from high above with its suite of remote sensing instruments. The two planes were in sync, for the most part passing over the same legs of the bowties less than 5 minutes apart. Each bowtie took about an hour, and a little after 6:00 pm we dropped to 12,000 feet for the flight home, while the storm system continued east.
“I think was good mission,” Mike said when we got back. “The instruments seem to work well, aircraft coordination seemed to go well, and we definitely got into some weather. A lot of precipitation down low that was occurring, and I think it was more along the lines of what we’re looking to do in this project.”
In the days that follow, the instrument teams will begin processing the data they collected, while the forecasters look out for the next storm on the horizon.