Liftoff! Aircraft Experiments Take Flight for NASA’s S-MODE Mission

By Dragana Perkovic-Martin, Principal Investigator for DopplerScatt at NASA’s Jet Propulsion Laboratory // SOUTHERN CALIFORNIA //

The first of three aircraft participating in the S-MODE campaign has arrived at Moffett Field in California. The NASA King Air B200 aircraft, carrying two science instruments – DopplerScatt and MOSES – landed on October 18th and is preparing for its first flight early in the morning on October 19th. The weather conditions have been changing and incoming storms in northern California are throwing a wrench into our planning for the airborne part of the campaign. 

NASA King Air B200 aircraft on arrival at Ames Research Center carrying DopplerScatt and MOSES instruments. Credit: Erin Czech / NASA Ames Research Center.

My name is Dragana Perkovic-Martin and I am the Principal Investigator for DopplerScatt, an instrument that simultaneously measures ocean vector winds and surface currents. DopplerScatt is a key part of the S-MODE Earth Ventures Suborbital Project. The instrument is currently aboard NASA’s King Air B200 aircraft  to collect data for the S-MODE mission. Meanwhile, I am at my pseudo control center at home,  following every minute of the deployment, acting as a point of contact for aircraft communications, and jumping in when things go south with DopplerScatt.

DopplerScatt is a radar and as such it is perfectly happy operating in cloudy conditions since its signals can penetrate the clouds, but it needs the wind to roughen the ocean surface for good data quality. Unlike DopplerScatt, the other instrument aboard this aircraft – MOSES – is an optical instrument (infrared camera to be more precise). That means MOSES can only collect data in clear weather, so no clouds. While high winds and no clouds are not mutually exclusive, the current weather outlook for the week is not great. The science team will have to closely follow forecasts and models and decide at the last moment whether the aircraft should take off. It will be a week at the edge of our seats! 

Ready for flight! Hector Torres Gutierrez (JPL) and Delphine Hypolite (UCLA), DopplerScatt and MOSES operators, ready to board the King Air B200 for the first S-MODE pilot campaign flight. Note just left of the aircraft stairs is the DopplerScatt white cone radome (radar signal transparent material).
Ready for flight! Hector Torres Gutierrez (JPL) and Delphine Hypolite (UCLA), DopplerScatt and MOSES operators, ready to board the King Air B200 for the first S-MODE pilot campaign flight. Note just left of the aircraft stairs is the DopplerScatt white cone radome (radar signal transparent material). Credit: NASA

On Tuesday morning, the King Air B200 took off at 8:20 am for a reconnaissance flight of the S-MODE area. The weather front was coming in and so it was a race between the aircraft and the clouds. The first reports from the aircraft operators were good: the winds were high enough for DopplerScatt to get good data and MOSES was managing to capture data through gaps in the cloud cover.

A little over four hours later, the King Air B200 landed, delivering the precious data “cargo” to the hangar at NASA Ames, where the DopplerScatt processing machine is housed. The images from the real-time processor aboard the aircraft promise a really good data set.  The satellite data obtained by the science team is capturing a very interesting ocean circulation feature within the S-MODE sampling area and the science team is abuzz trying to reposition the autonomous marine robots to capture the feature. 

Sea surface temperature images from the Visible Infrared Imaging Radiometer Suite (VIIRS) instrument show a warm water intrusion propagating into the S-MODE area (black polygon) from the western boundary and a cold water filament propagating into the S-MODE area from the northwestern boundary.  Left image obtained on October 18th 2021, right image corresponding to October 19th 2021. Credit: NASA
Sea surface temperature images from the Visible Infrared Imaging Radiometer Suite (VIIRS) instrument show a warm water intrusion propagating into the S-MODE area (black polygon) from the western boundary and a cold water filament propagating into the S-MODE area from the northwestern boundary. Left image obtained on October 18th 2021, right image corresponding to October 19th 2021. Credit: NASA

While we prepare for the second flight of the NASA King Air B200 this afternoon, the media is having a field day – coming along to watch, photograph and film our experiments. Today’s flight is aimed at mapping the ocean feature that has formed in the past few days in the northern end of the S-MODE sampling area. The winds are forecast to be just high enough for DopplerScatt to perform its measurements. 

Federica Polverari (JPL DopplerScatt operator) in action during S-MODE media day. Credit: NASA

Meanwhile, back at my home control center, I’m using a software called FlightAware to track the aircraft while in flight. The display can include weather, and today this shows a patchwork of rain and clouds out there. Fingers crossed that it is not raining at the collection site, as DopplerScatt’s signal is attenuated in rain.

After the plane took off and arrived at the data collection area, we lost communication as the satellite connection must have been affected by weather in the area. 

We get one more good flight for the DopplerScatt instrument, but it’s bad luck for MOSES. The cloud cover was thick and extended from approximately 5,000 to 24,000 feet, making it impossible for the camera to image the ocean surface. Perhaps we’ll have better luck Friday when cloud conditions appear to be favorable for an early morning flight. 

NASA’s King Air B200 aircraft fueling pre-flight on a rainy morning at Moffett Field in California. Credit: NASA

There was lots of excitement in the pre-flight instrument power on, as one of the DopplerScatt servers had trouble booting. The DopplerScatt team mobilized over the phone and resolved the issue – sigh of relief! The whole team is glued to their cell phones in the morning, and we may have to investigate the issue upon landing. 

Today’s flight is the first combo experiment of the campaign. The NASA King Air B200 and the Twin Otter  aircraft will be flying, carrying the MASS instrument operated by the Scripps Institute of Oceanography (SIO), in addition to autonomous Saildrones and recently ship-deployed drifters. The Saildrones have been sampling the area overnight and are reporting a disappearance of the cold filament. The science folks suspect that the warmer water has pushed the cold filament deeper because it’s not as visible from overhead. 

October 22nd 2021 flight tracks by the Twin Otter (red lines) and King Air B200 (blue lines) superimposed on the sea surface temperature map, ship, and saildrone data collected overnight.
October 22nd 2021 flight tracks by the Twin Otter (red lines) and King Air B200 (blue lines) superimposed on the sea surface temperature map, ship, and Saildrone data collected overnight.

After a frantic back and forth during the flight to identify the source of monitor malfunction on DopplerScatt, things have settled back to normal. The flight was executed successfully and we will perform some more ground trouble-shooting to make sure that DopplerScatt is ready for the next flight, which will probably be on Monday October 25th.

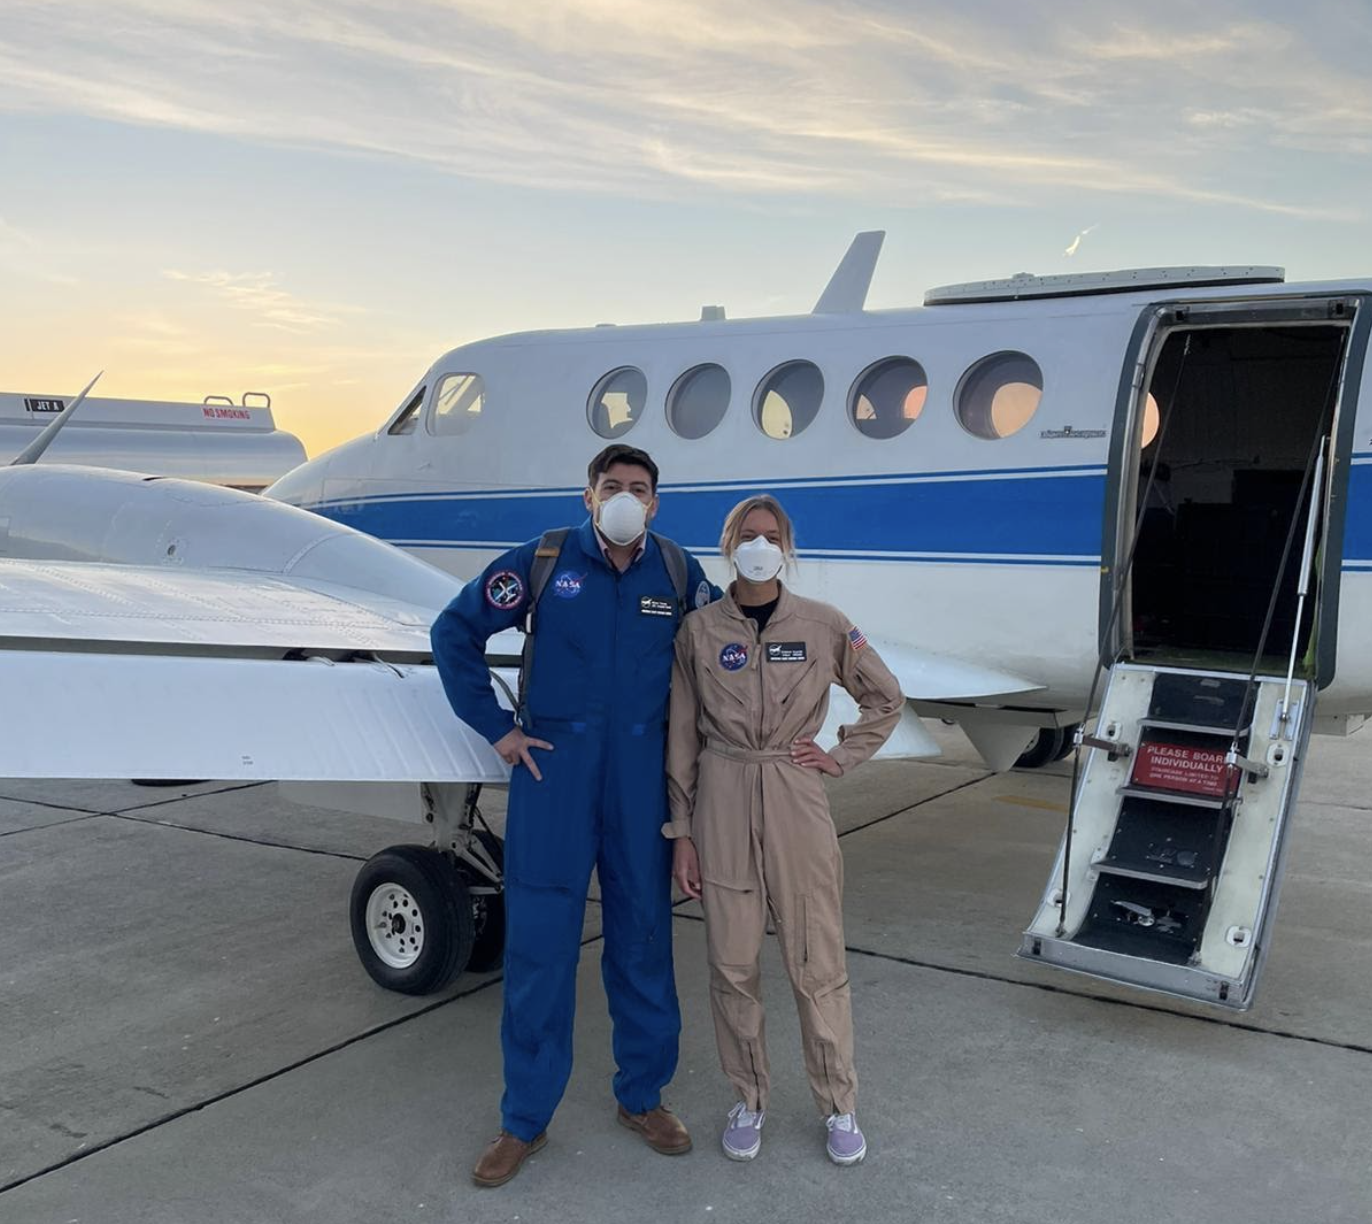
Hector and Delphine, the instrument operators flying aboard the King Air B200, shared their impressions of the flights from their high-altitude view: 

“The plane flew offshore West of San Francisco and after a cloudy and turbulent takeoff, the ocean appeared perfectly clear at the altitude of 26,000 ft. Operating smoothly thanks to both skills and practice, in coordination with the pilots, we traced an array over the ocean and collected great quality data. When we saw oceanic structures with clean, sharp gradients appearing on our screens we were overjoyed!  The months of preparations were starting to pay off. These structures are exactly what we have come to measure. The other aircraft, the Twin Otter, has also joined the data collection and will provide a very useful data comparison. The plane tracks were successfully changed to optimize the overlap of the two data sets. What a great day for S-MODE,” they told me.

Now quiet resumes while the data are being processed by our teammates. That’s a wrap for the first week of the S-MODE pilot campaign airborne activities!

Too Remote, Too Wild, and Too Cold: Helping Satellites See Arctic Greening With Boots on the Ground

Pixel walkers (left to right) Logan Berner, Patrick Burns, Ben Weissenbach, Julia Ditto, Madeline Zietlow, Russell Wong. Photo by Roman Dial.

by Roberto Molar Candanosa

Far up in northern Alaska, Logan Berner’s legs are burning with pain from trekking over tussocks in grassy valley bottoms and rugged, cloud-choked mountain passes. He’s spending a couple of weeks of 2021’s summer traversing the mountainous Brook Range, carrying just the essentials to sustain him in the expanse of the Alaskan Arctic. There, where North America ends, tundra and mountains make up one of the continent’s most pristine landscapes.

The Brooks Range is not the sort of environment where people just go for a hike. It’s too remote, too wild, and too cold. There are no human trails other than what’s left behind by moose, bears and other wild animals roaming the region. It’s the kind of terrain that will get you in trouble, the kind that would put you face to face with a hungry grizzly bear or give you hypothermia.

Rain gear is non-negotiable. 2021 marked one of the wettest summers on record in the range, and some days in the trek feel like an endless walk through a car wash. Stopping for more than a few minutes (even to eat) will make your body too cold from the whipping wind and pouring rain near freezing temperatures.

Roman Dial leads the team in the barren mountains of northern Alaska’s Brooks Range. Photo Courtesy Logan Berner

Berner, a research ecologist from Northern Arizona University, went out there to join a group of biologists led by Roman Dial, a professor of biology and mathematics at Alaska Pacific University who had been traversing the range on foot for nearly a month. Covering nearly 800 miles in about three months, the team used their smartphones to take pictures and jot down extensive notes about the vegetation they passed, noting when and how the type and density of trees, shrubs and other plants changed along their way.

By combining those notes with techniques that analyze greenness from space, the team wants to gain a better understanding on the extent and nature of the impacts of climate change right at the boundary between Arctic tundra and boreal forest. The idea is to use that data, recorded the old-fashioned way with boots on the ground, and link them with NASA’s long-term satellite observations.

The Arctic is warming nearly twice as fast as other regions on Earth, and the impacts extend beyond glaciers melting, sea ice shrinking and other types of vanishing polar ice. They reach most deeply into places such as the Brooks Range, where Arctic tundra—a harsh, treeless ecosystem where mostly small plants grow—has become increasingly greener.

Earth-observing satellites have detected Arctic tundra becoming greener in recent decades as the growing seasons became warmer and longer. Landsat satellite observations indicate that about 22% of the Arctic became greener from 2000 to 2016, while 5% became browner. Adapted from Berner et al. (2020).

Over the last four decades, satellites have detected that greening, as well as some browning, where extreme weather, insect pests, and other disturbances reverse the greening trend. But even though satellite records suggest Arctic tundra ecosystems are changing in response to atmospheric warming, important details remain unclear about why specific regions have greened or browned in recent decades.

“Arctic greening is really a bellwether of global climatic change,” Berner said. “We know that this greening signal in part reflects warmer summers, increasing the amount of plant growth that’s occurring on the landscapes, so that the satellites are seeing this increase in leaf area.”

Researchers from Northern Arizona University traveled on an 11-day segment with Alaska Pacific University scientists, who completed a summer-long trek through the western Brooks Range in northern Alaska. Photo Courtesy Logan Berner

Already, the effects of these vegetation changes point towards other impacts as the Arctic tundra becomes more productive and shrubbier.

For example, Berner explained, thriving shrubs could out compete smaller plants that serve as important subsistence resources, like blueberries, which help sustain northern human communities. Dial also has observed that these vegetation changes can re-shape the landscape and affect how caribou and other migratory animals navigate the Brooks Range, also affecting the availability of subsistence resources for isolated villages depending on wildlife.

On the flip side, new spruce tree forests can also help insulate the thawing permafrost and possibly reduce the release of deep pools of carbon stored within it, adding more heat-trapping gases into the atmosphere.

“In that sense, [greening] might slow the rate of climate change by keeping that organic-rich permafrost carbon soils frozen and locked away,” Berner said.

To better understand impacts of climate change on vegetation in the Alaskan Arctic, a group of researchers are linking long-term NASA satellite observations with ecological field data collected while trekking through the Brooks Range in northern Alaska. Photo by Roman Dial.

Because of the unknowns revolving around Arctic greening and browning, field data serves as a crucial complement to satellite observations. Gradients of vegetation stripe the Brooks Range, making it an ideal location to sample from, as the mountains form a natural barrier that separates the boreal forest of Alaska’s interior from the Arctic tundra of Alaska’s North Slope.

NASA’s satellites can track large-scale vegetation changes from space. But 700 miles up in space, they mostly get a top-down view of the terrain. By venturing into the wilderness to collect the extensive ecological field data that is impossible to capture from space, Berner and Dial’s team are helping the satellites “see” more and better.

The team is combining their detailed notes from the ground with satellite observations of the region by the Landsat program. Ultimately, linking both datasets can help scientists learn more details about where, why, and how large patches of the Arctic’s flora are changing.

“Being on the ground and walking through these landscapes gives you a much better sense for what these landscapes are,” Berner said. “It gives you an understanding of these ecosystems that you just can’t get by sitting at a computer and crunching data.”

Boreal forest gives way to sparse tundra while heading north into the Brooks Range. Photo by Logan Berner.
Boreal forest gives way to sparse tundra while heading north into the Brooks Range. Photos courtesy Logan Berner and Roman Dial

The team was able to trek and take data largely thanks to Dial, who has travelled over 5,000 miles throughout the Brooks Range during the last four decades. As part of that exploration, Dial developed ingenious ways to travel light for extended periods of times, making it more manageable to collect data from the field.

“When doing fieldwork in remote Arctic, Antarctic and alpine environments, survival comes first, so you can sometimes feel lucky to perform any research along the way at all,” Dial said. “But our methods of travel have evolved to the point where we can travel light and comfortably—dealing with rivers and bears and rain and wind. By integrating that light and comfortable mode of travel with smartphones and simple tools like tape measures and tree increment borers, as well as other apps on our phones that can measure heights, we can actually collect valuable and useful data across vast swaths of wilderness.”

What really makes recording data on the field possible is what Dial named “pixel walking,” a unique way in which a group of trekking scientists document observations about the vegetation as they see it on the ground, logging changes in plant types, attributes, and location continuously. Their protocols to record that information cover 30-square-meter plots of land, or  a pixel of a view from a Landsat satellite.

Most previous field research has involved establishing field plots and meticulously characterizing the plant community in each one. That does provide valuable information, but the approach is expensive, limited in extent and time-consuming. Because field plots tend to be small and few, it can be difficult and prohibitively expensive to cover large areas accurately, and to match them with observations from space.

With a smartphone app developed by Dial’s team, the trekkers note the tallest plant community and its physical structure as might be seen from an orbiting satellite. They also record what isn’t so easy to see from space: the understory and ground cover. As they walk, they record on their smartphones’ app the identity and density of each of three layers of vegetation. The app also records the geographic location with the phone’s GPS.

Scientists record visual observations of plant community composition and density through the Brooks Range in northern Alaska. Photo by Roman Dial.
Scientists record visual observations of plant community composition and density through the Brooks Range in northern Alaska. Photo by Robert Burns.

“It’d be very expensive to collect this kind of data with a helicopter,” Dial said. “This is a really important aspect of ground truthing and calibrating what the satellites see with what’s on the ground. From satellites we only know that the reflectance values are changing over time, but we don’t know what it is that’s changing on the ground. So this is a way to find out what is really happening with plant communities and the Earth’s surface and relate it to the last 20 years of satellite data.”

Berner, supported by NASA’s Arctic Boreal Vulnerability Experiment (ABoVE for short) and Dial’s team, supported by NASA’s Alaska Space Grant, the National Science Foundation’s Established Program to Stimulate Competitive Research, and the Explorers Club/Discovery, are already working to link their field observations with satellite data. What they’ll learn can also help inform future research in other parts of the Arctic.

“What is the greening that we see? Is the greening an increase in willows, for example? Is it an increase in birch? Or is it an increase in alders? Or is it an increase in trees?” Dial said. “Having a small team like mine actually on the ground to provide the ABoVE program with ground-based data—that’s really what ABoVE is doing well. It’s just a really wonderful marriage between field data collection and remote sensing.“