NASA’s S-MODE Mission: “Sea-ing” through Rainbow-Colored Glasses

By Sarah Lang, Ph.D. student at the Graduate School of Oceanography, University of Rhode Island. // Aboard the Bold Horizon //

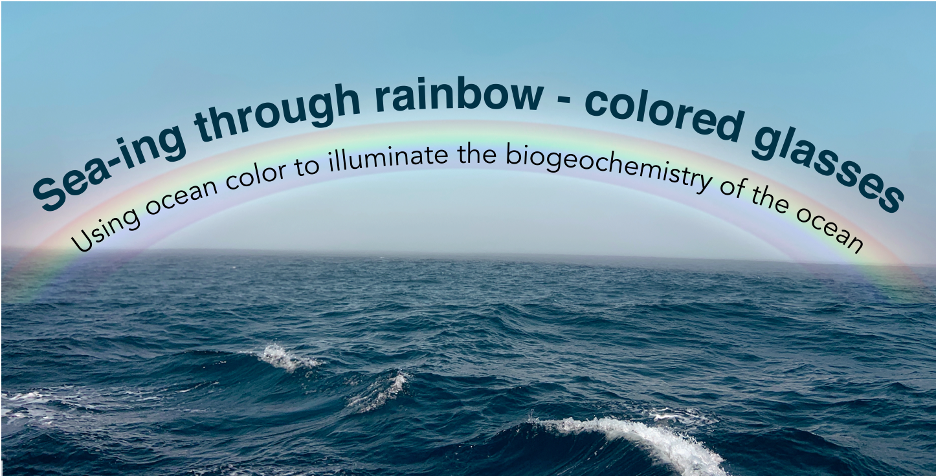
If you asked a random person about the color of the ocean, they would probably tell you that it’s some shade of blue or green. But perhaps that shade of blue looks slightly different to you than it does to the random stranger you’re bothering about the color of the ocean.

The way you see color depends on many things: the way an object interacts with incoming light, the color of that incoming light, and even the way your eyes perceive that light. The stranger likely has cone cells in their eyes that perceive light differently than yours.

When light from the sun enters the ocean, it is scattered or absorbed by phytoplankton (microscopic organisms in the ocean that produce oxygen, take up carbon dioxide, and serve as the base of the marine food web), organic matter, minerals, and other constituents in the water, as well as the water itself.

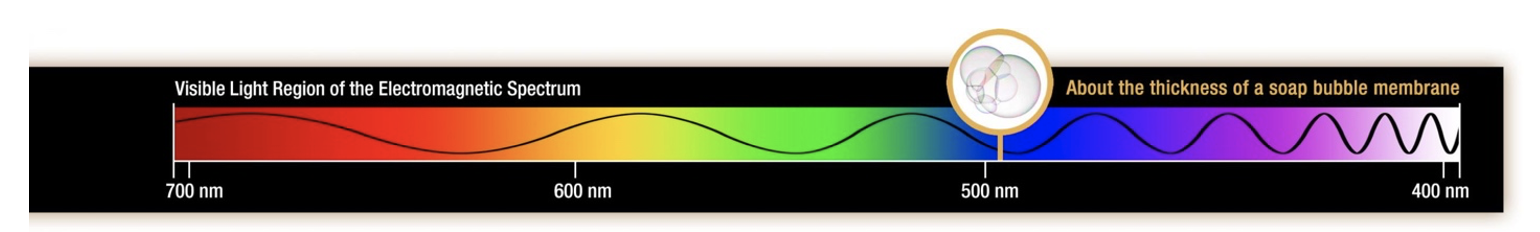
These interactions affect different wavelengths of light differently. Remember the electromagnetic spectrum? Let’s think of colors as different wavelengths of light.

Graphic of visible light portion of the electromagnetic spectrum, with red (longer) on left and white (shorter) at right.
The visible region of the electromagnetic spectrum. Credit: NASA

If we can quantify how light scatters and absorbs after entering the water, we can gain a better understanding of what is in the water. This includes not only how much phytoplankton, but what species there are! This is important for better understanding the ocean’s carbon cycle. Different species of phytoplankton contribute to the ocean’s carbon cycle in different ways (eg., phytoplankton size influences how much carbon they fix), so it is important to understand their distributions.

I am a Ph.D. student at the University of Rhode Island’s Graduate School of Oceanography. I’m interested in how the physics of small-scale features in the ocean affect phytoplankton ecosystems, and I work with ocean color to better understand the biogeochemistry and ecology of the ocean.

Photo of me filtering seawater samples for particulate organic carbon (POC). Courtesy of Kelly Luis.

During the S-MODE campaign, we are using ocean color to capture small-scale variability in phytoplankton species and physiology (how happy are the phytoplankton?).

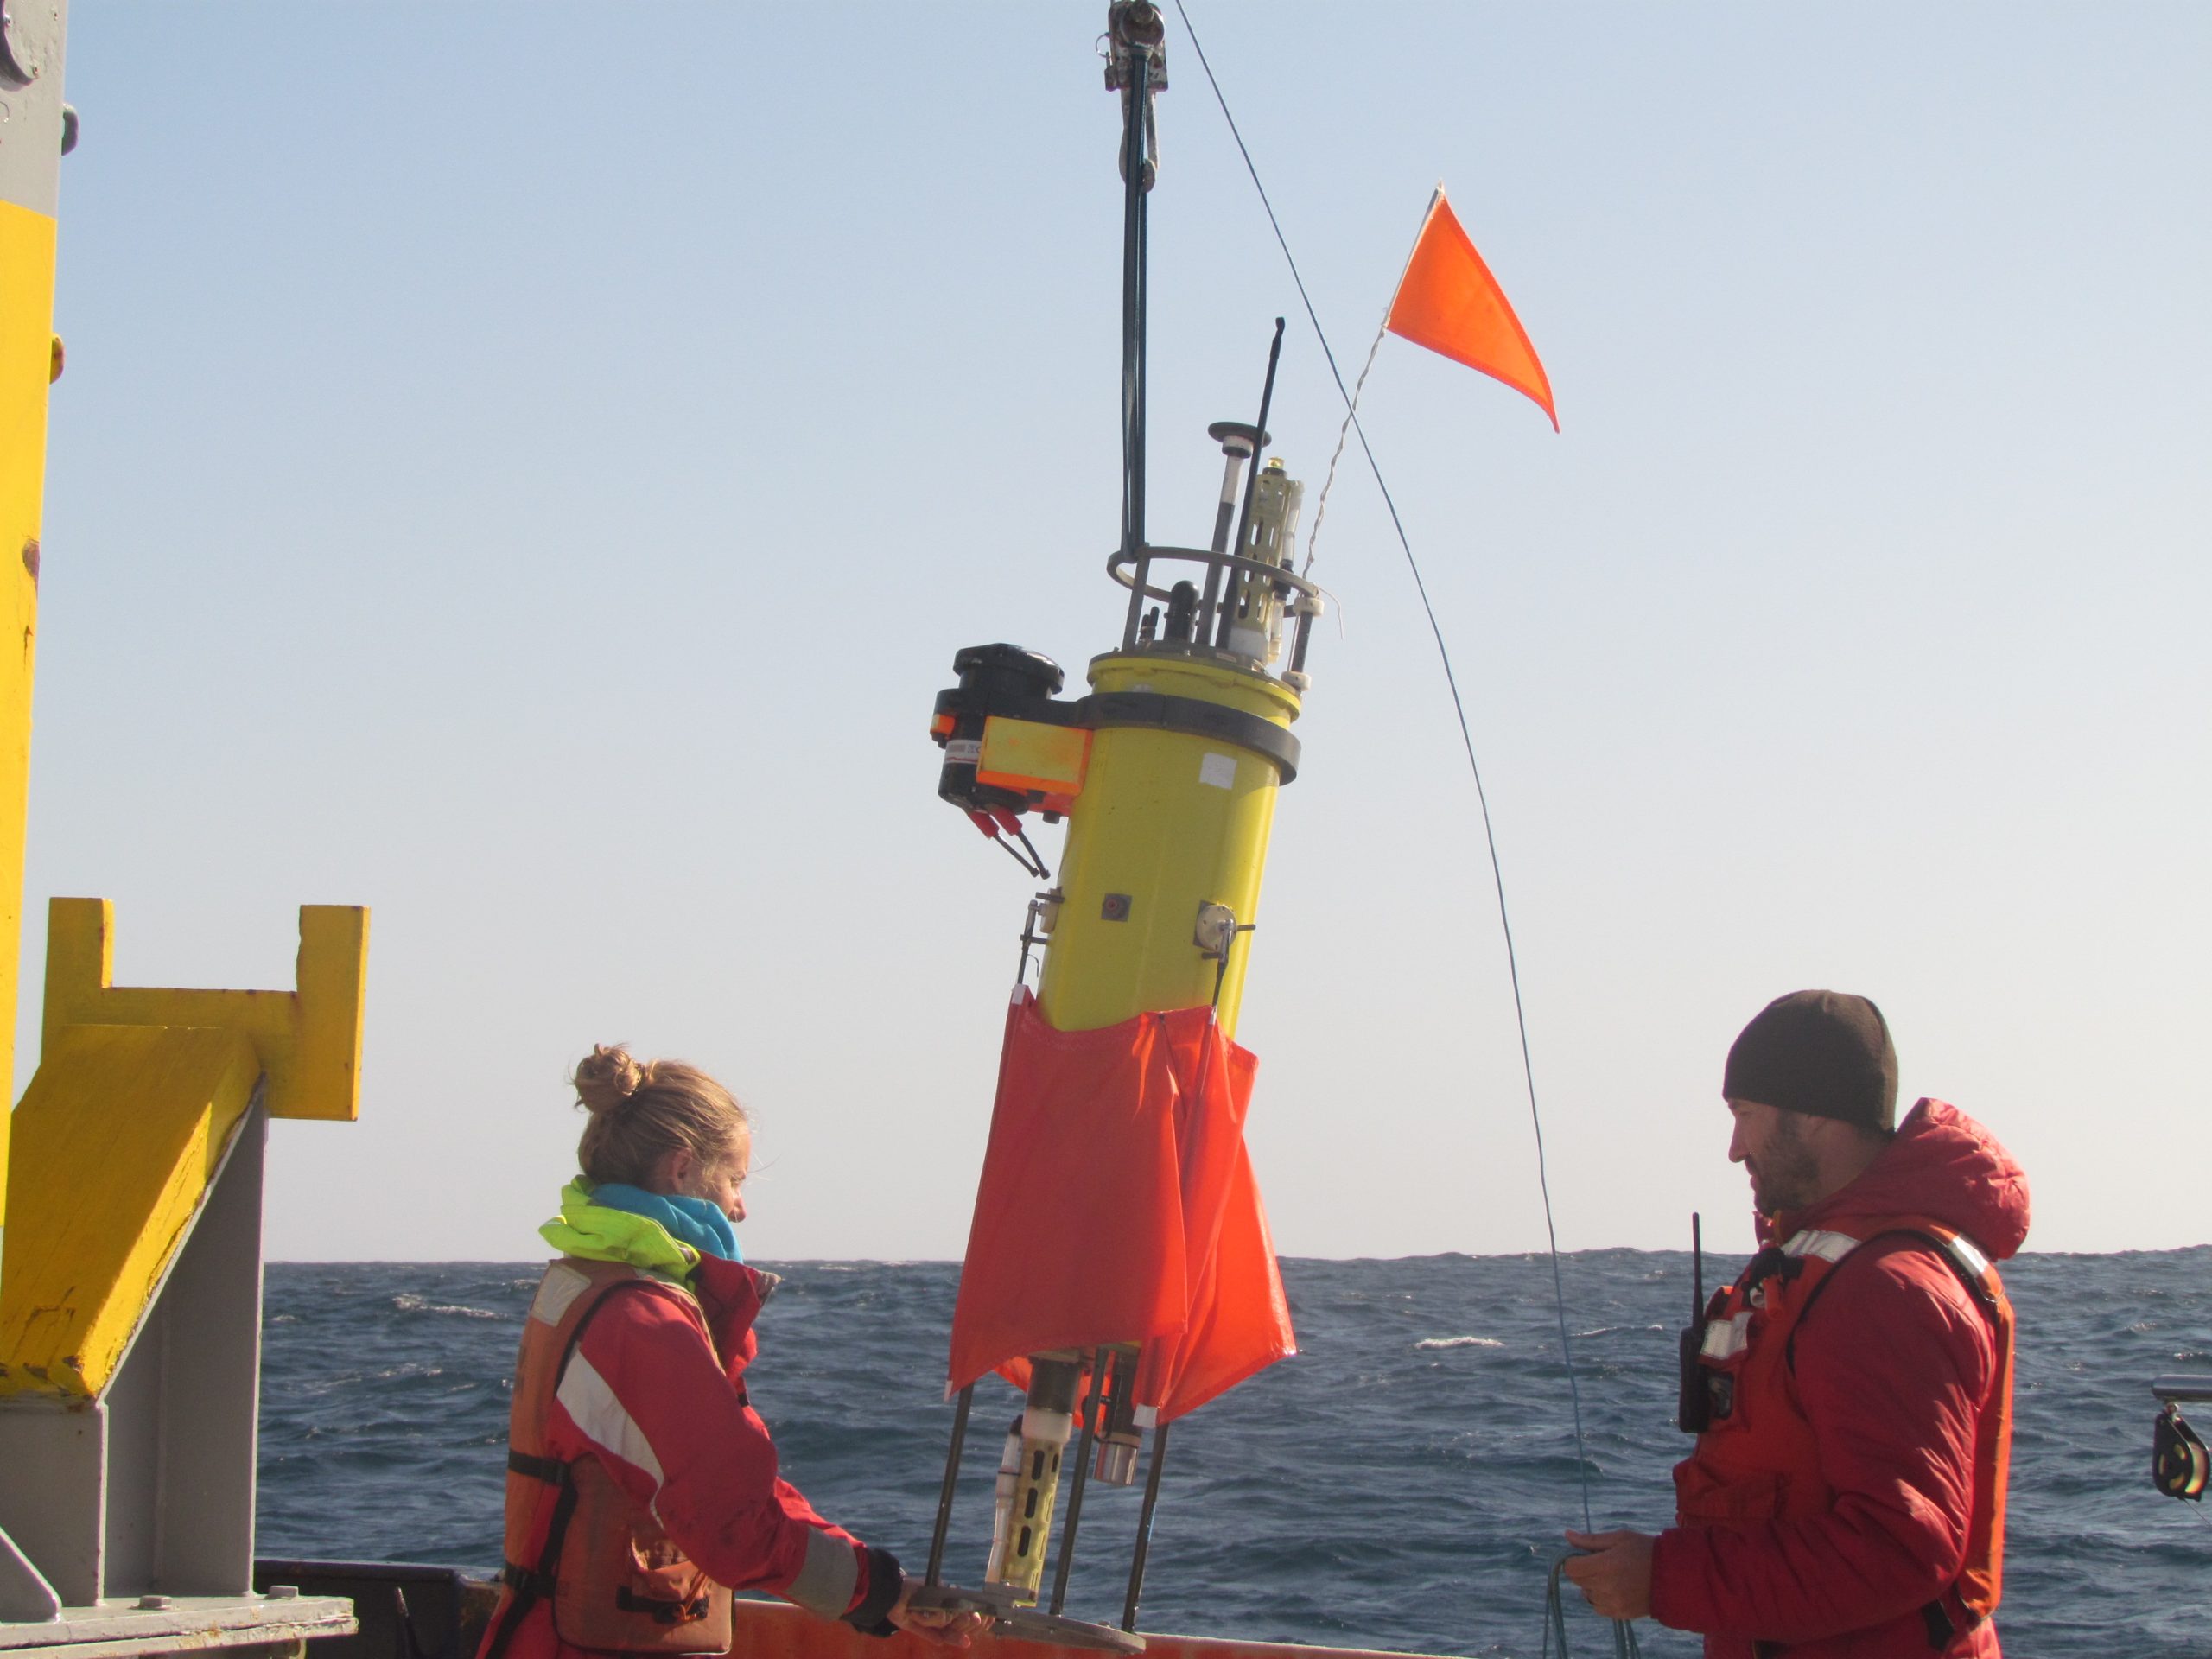
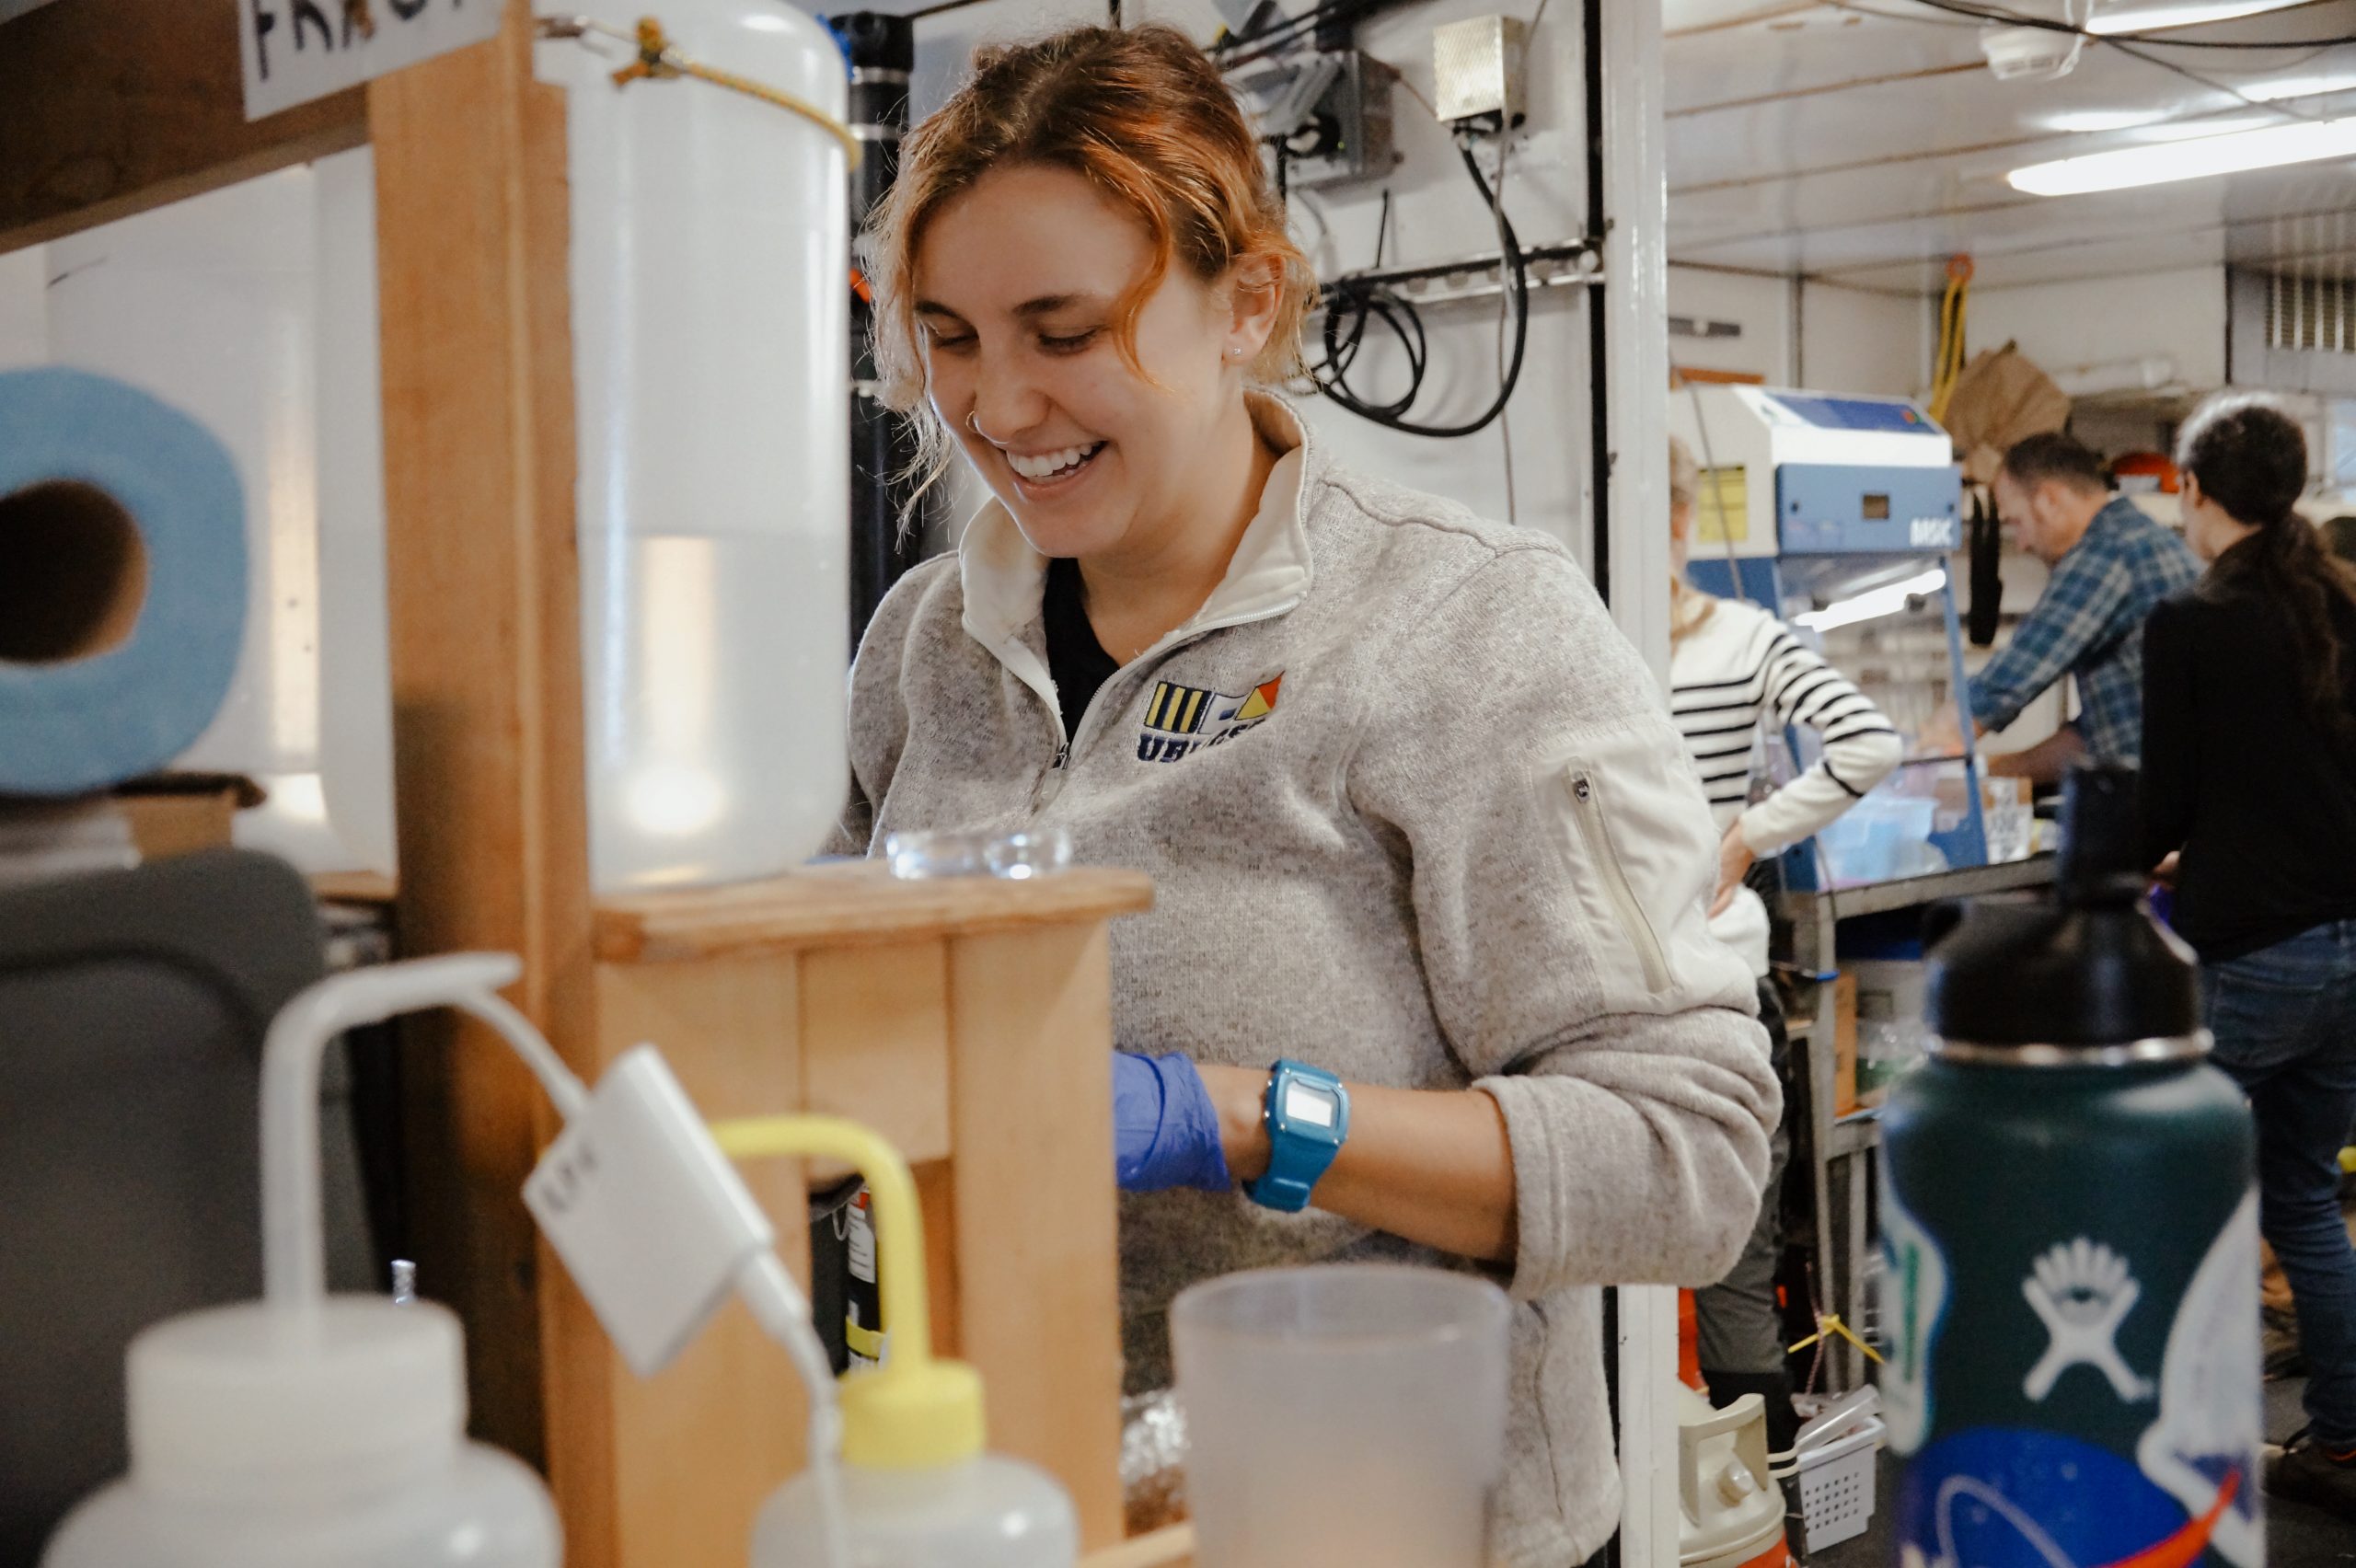
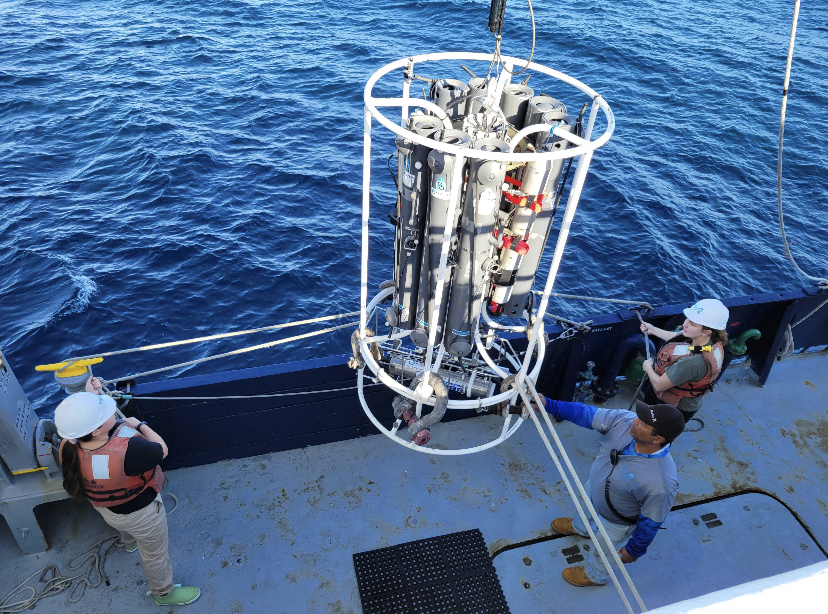
Here’s how we do it: we take many, MANY seawater samples (we took over 300!) and we analyze these samples for chlorophyll (tells us about how much phytoplankton are in the water), particulate organic carbon, pigments (what types of phytoplankton might be there?), and nutrients.

Mackenzie Blanusa and I tag-lining a CTD-Rosette as it is lowered into the water to collect seawater samples at depth. Photo courtesy of Pat Kelly.
Pat Kelly and I holding our URI-GSO flag in front of the CTD-Rosette. Photo courtesy of Pat Kelly.

We use these samples to “calibrate” ocean color (aka bio-optical) measurements. One way we take these bio-optical measurements is from a flow-through system. We send water through a series of optical instruments that measure different optical properties of the water. Basically, we want to turn continuous optical measurements taken on the ship into biological parameters we understand (like phytoplankton!).

 
Photos of optical flow-through system. Water flows through the system and is measured by each instrument in succession. The switch will automatically switch between filtered water and total seawater so we have measurements of the dissolved constituents of the seawater and the particulate constituents of the seawater. Beam attenuation describes how much light from a beam is lost when it travels through the water. Backscattering describes how much light is scattered in the backwards direction. All these “optical measurements” are useful in describing the biogeochemistry of the water. For example, beam attenuation can vary with the amount of particulate organic carbon in the ocean. Backscatter can be used as a proxy of particle size. Most instruments are borrowed from Emmanuel Boss’s lab at the University of Maine. Advanced Laser Fluorometer from SIO. IFCB from URI.

Then, we can use these bio-optical measurements to validate measurements from AIRPLANES! These planes (NASA PRISM: Portable Remote Imaging Spectrometer and SIO MASS: Modular Aerial Sensing System) have hyperspectral sensors on them measuring how much light is leaving the water at different wavelengths.

Hyperspectral sensors are really cool because instead of knowing how much light is leaving the water at a few wavelengths across the visible spectrum, we can capture continuous information (almost the whole spectra!). Hyperspectral measurements give us the information we need to estimate phytoplankton species.

Soon, we’ll have global hyperspectral ocean color data for the first time. We’ll be able to see the ocean in a way we’ve never seen before with NASA’s upcoming satellite mission PACE (Phytoplankton, Aerosol, Cloud, and ocean Ecosystem). New discoveries about our amazing planet will follow!

Following the Ocean Fronts

A pink and purple sunrise over the ocean.
Picture of the sky cloud coverage from the Bold Horizon on the morning of October, 17th. Credit: Audrey Delpech.

By Audrey Delpech, postdoc in the Atmospheric and Oceanic Sciences department at UCLA

Being part of the NASA S-MODE oceanographic mission was a great experience for me. It was only my second oceanographic mission and my first one on a US research vessel. I learned a lot about how to use the different instruments, interpret their data and about the complexity of the ocean.

This mission is designed to study submesoscale fronts – which correspond to abrupt changes of water temperature or salinity over scales of about 6 miles or 10 kilometers in the ocean. They act in a similar way as we have fronts in the atmosphere that bring us cold or warm weather, rain or dry air masses. S-MODE is making the first observations that show such fronts do play a role in stabilizing our climate by acting as a connector between the deep ocean and the atmosphere, and controlling the exchanges of quantities such as heat or carbon.

Figure of the sea surface temperature measured along the ship course and the position at which radiosonde were released across a front. Credit: Audrey Delpech.
Figure of the sea surface temperature measured along the ship course and the position at which radiosonde were released across a front.
Credit: Audrey Delpech.

Because these fronts move and change throughout the day, we didn’t have a set sampling plan. Instead, we would look at the real-time conditions so we could figure out where to go and how to get the best measurements from the ship and three aircrafts. This is called “adaptative sampling.”

My research has lately evolved towards understanding how the ocean interacts with the atmosphere above. I have been working with models to simulate and study how submesoscale ocean motions interact and exchange energy with the winds. Onboard the ship I worked with an instrument called a radiosonde. Radiosondes are sensors which are attached to a balloon and  measure temperature, humidity, wind speed and direction as they rise up in the air. I’m interested in seeing how the temperature of the ocean across these fronts influences the wind speed of the air above. We released radiosondes at regular time intervals as the ship was moving across fronts. These measurements will hopefully confirm the findings from the numerical models, and I am really looking forward to analyze them.

A woman stands at the rail of a boat, ocean in the background. Her hands are up as they have just let go of a balloon with a white instrument the size of a cup dangling from it.
Radiosonde launch. Credit: Audrey Delpech.

Another important part of my work onboard was to provide real-time weather conditions from the ship. The onshore team used my reports every day to make the decision of whether to fly the aircraft or not, or if they needed to adapt their survey region. Some airborne instruments required clear-sky conditions or high enough clouds so they could fly in the clear underneath. The radiosondes measurements helped me figure out how high and how thick the clouds were, two important parameters to characterize the cloud coverage.

A graph that shows the altitude on the y-axis and a line showing relative humidity lowering as it goes higher and a second line showing temperature decreasing as it goes higher. A bar indicates the cloud layer from 1 kilometer to 1.5 kilometers above the ocean surface.
Temperature and humidity profile measured by the radiosonde. The saturation (100%) relative humidity layer indicates the cloud layer. Credit: Audrey Delpech

I also collected radiosondes’ atmospheric temperature and humidity profiles from the sea surface to about 8 km height at the same time the airplanes were flying overhead. These data will help calibrate the airborne infrared remote sensors.

Besides the weather reports, I also took part in many other operations. One was helping to deploy an instrument called a CTD (for Conductivity, Temperature and Depth). This instrument measures the temperature and salinity of the sweater as a function of depth as the ship is moving across the ocean. This helped us understand the vertical extension of the front in the subsurface ocean (from 0 to about 200m deep). I also helped filter water samples for future onshore DNA analyses, which will give a sense of the diversity of microscopic phytoplankton across submesoscale fronts, deployed and recovered Lagrangian floats, which are designed to drift with currents, helped navigate the ship to chase fronts, and helped with the real-time processing of data.

Two people stand to either side of a about five-foot tall cylindrical instrument they are prepareing to put in the water.
Audrey Delpech, Dipanjan Chaudhuri and Avery Snyder preparing a Lagrangian float deployment operation. (photo credit: Gwendal Marechal)

This experience has taught me a lot about the challenges of “adaptative sampling” and made me think differently about the value of the data collected. I now know the amount of coordination and labor that are behind them.

It was also a wonderful human experience. The community of people we were forming on this cruise was very diverse, with everyone coming from a different horizon. Several nationalities were represented and each person I met has brightened up my experience at sea. I have made some really good friends and met wonderful scientists I am looking forward to collaborate with in the future.


Life at Sea: Books of the Bold Horizon

By Kelly Luis, NASA Postdoctoral Program Fellow at the Jet Propulsion Laboratory, California Institute of Technology // Aboard the Bold Horizon //

ʻAʻohe o kahi nana o luna o ka pali; iho mai a lalo nei; ʻike ke au nui ke au iki, hea lo a he alo. The top of the cliff isn’t the place to look at us; come down here and learn of the big and little currents, face to face (Pukui, 1983, 24).

I brought Sweat and Salt Water: Selected Works by Dr. Teresia Kieuea Teaiwa onboard the R/V Bold Horizon. The book was the last addition to my bag before heading to the airport. I’m not sure why I threw the book in my bag; but I was even more puzzled when I realized late into the cruise, I read Chapter 5: Lo(o)sing the Edge every time I opened the book. Maybe it was the relevance of Dr. Teaiwa’s inclusion of the ʻōlelo noʻeau (Hawaiian proverb) to S-MODE or maybe the navigation of her professional and personal life resonated with my experience navigating aquatic remote sensing as a kānaka maoli (Native Hawaiian) woman. Still in question as the vessel began its final transit to San Diego, I went on a quest to learn about the books brought aboard.

Kelly Luis reading Sweat and Salt Water in the lab. Credit: Kelly Luis

Tucked between the laptops, bungee cords, and camera bags, I first noticed Sarah Lang’s autographed copy of This is How You Lose the Time War by Amal El-Mohtar & Max Gladstone. Between late night CTD transects and long days of filtering during plane overpasses, Sarah Lang quickly finished up The Seven Husbands of Evelyn Hugo by Taylor Jenkins Reid and just started her second book.

Sarah Lang’s autographed copy of This is How You Lose the Time War. Credit: Kelly Luis

When Andy Jessup returns to his bunk after radiosonde launches and saildrone chasing, he immerses himself in fiction, which he later donates to the ship’s library. Jessica Kozik’s exuberance for the sea carries over into her reading. She is three chapters into Blue Mind: The Surprising Science That Shows How Being Near, In, On, or Under Water Can Make You Happier, Healthier, More Connected, and Better at What You Do by Wallace J. Nichols on her Kindle. Balancing graduate coursework in between ecoCTD shifts, Mackenzie Blanusa can be found in the galley with books for her classes.  Audrey Delpech started L’art de perdre by Alice Zeniter on land and tries to sneak in reading time between radiosondes, ecoCTD watches, and assisting with biological sampling. When Pat Kelly isn’t reading fluorescence samples and macgyvering sensors on the CTD, he’s resting up with classics like Sweet Thursday by John Steinbeck and horror thrillers like Pet Sematary by Stephen King.

Andy Jessup’s donation to the ship’s library. Credit: Kelly Luis.

Not everyone brought a book and/ or knew not to bring a book because of our workload. Our chief scientist is a prime example. Up at every hour he can be, Andrey oversees all science operations, determines boat headings in relation to changing fronts and eddies, and still makes it on deck for all Lagrangian float, waveglider, and seaglider recoveries. He did share that on a previous cruise he brought Gödel, Escher, Bach: an Eternal Golden Braid by Douglas Hofstader, a mathematics book he enjoys reading with the shifting sea state. Ben Hodges did not bring a book because he knew he would be busy leading ecoCTD and waveglider operations, but he wished he brought The Ashley Book of Knots by Clifford Ashley to assist with his night watch knot tying course.

Pat Kelly reading in the library. Credit: Kelly Luis.

From my informal survey, it seemed almost everyone wanted to get more into their books, but were worn-out after watches. From keeping up with operations and learning new instruments, we were naturally tired and the comforts of an easy to get lost in piece of work beat out starting something new. My reading of the same chapter may have simply been a deep desire for familiarity. However, I think it may also relate to our chief scientists’ sentiment toward his mathematics book. The shifting sea state provided new glimpses of the relations between the text and my journey, but also the biological and physical relations we observed on the R/V Bold Horizon. Much more can be said about the edges of existing models’ ability to capture sub-mesoscale processes and the importance of meeting these features face to face. However, this chapter of S-MODE 2022 cruise is coming to end, but another chapter awaits the science party in 2023.

Until we meet the big and little currents again.

Reference:

Mary Kawena Pukui; illustrated by Dietrich Varez. ʻŌlelo Noʻeau: Hawaiian Proverbs & Poetical Sayings. Honolulu, Hawaiʻi: Bishop Museum Press, 1983.

List of Books/Magazines Aboard the Bold Horizon

  • Sweat and Salt Water: Selected Works by Teresia Kieuea Teaiwa
  • Science on a Mission: How Military Funding Shaped What We Know and Don’t Know About the Ocean by Naomi Oreskes
  • Pet Semetary by Stephen King
  • Sweet Thursday by John Steinbeck
  • Three body problem by Liu Cixin
  • L’art de perdre by Alice Zeniter
  • Mermoz by Joseph Kessel
  • Le serpent majuscule by Pierre Lemaitre
  • This is How You Lose the Time War by Amal El-Mohtar & Max Gladstone
  • The Seven Husbands of Evelyn Hugo by Taylor Jenkins Reid
  • Hunter-Gathers Guide to the 21st Century: Evolution and Challenges of Modern Life by Heather Heying and Brett Weinstein
  • The Sentence by Louise Elhrich
  • Blue Mind: The Surprising Science That Shows How Being Near, In, On, or Under Water Can Make You Happier, Healthier, More Connected, and Better at What You Do by Wallace J. Nichols
  • Birds of Southern California: Status and Distribution by Jon L. Dunn and Kimball Garrett
  • The Book: On the Taboo of Knowing Who You Are by Alan Watts
  • The Outermost House by Henry Beston
  • The Flame Throwers by Rachel Kushner
  • Shame of a Nation: The Restoration of Apartheid Schooling in America by Jonathan Kozol
  • Why are all the black kids sitting together in the cafeteria? And Other Conversations About Race by Beverly D. Tatum
  • Essentials of Atmosphere and Ocean Dynamics by Geoffrey K. Vallis
  • Le voyage d’Emma
  • Hermann Hesse by Siddhartha
  • The Orion Magazine
  • High Country News

Surface Waves from the Bold Horizon’s Deck During NASA’s S-MODE Experiments

By Gwendal Marechal, postdoctoral researcher at the Colorado School of Mines // Aboard the Bold Horizon //

Upon leaving the Breton coastlines after my Ph.D., I started a postdoc at the Colorado School of Mines. After one month in the Colorado mountains, I traveled to Newport, Oregon, to board the Bold Horizon for one month of measurements offshore of San-Francisco for the NASA S-MODE (Sub-Mesoscale Ocean Dynamics Experiment) field campaign. This experiment focuses on sub-mesoscale currents (spatial scales smaller than about 30 km, or 18 miles, at these latitudes), and tries to assess how important these structures are for the vertical exchange in the ocean and fluxes between the lower atmosphere and the upper ocean.

We set sail for the experiment area after six days of mobilization in Newport. This is my first cruise that focuses on a different topic than surface gravity waves (waves hereafter). Actually, during this cruise, the (steep) waves were mostly a drawback for the CTD, Eco-CTD casts, and floating/underwater platform (sea-gliders, wave gliders, Saildrones) deployments. These waves were, however, one of the main focuses of the Twin Otter airplane flying above us during the S-MODE experiment. This aircraft and its instrument MASS were flying almost every day throughout the cruise collecting the sea-state properties at very high resolution. In other words, it measured the wave height, direction and wavelength. Also, with its optical sensor, MASS is able to capture the breakers resulting from waves, the famous “sheep” at the ocean surface.

The Twin-Otter aircraft during the S- MODE campaign. Credit: Alex Kinsella

Even if we are not measuring waves directly from the Bold Horizon, some of our floating platforms, such as the Saildrones and the wave gliders, do measure waves. Because the waves play the role of a liquid boundary between the ocean and the atmosphere, they strongly interact with the two systems. Therefore, in the context of measuring the sub-mesoscale currents and their associated air-sea fluxes and mixing in the upper ocean, measuring waves is mandatory.

For instance, currents can enhance the breaking probability of the waves and thus the associated air-sea fluxes. One can notice the effect of the current on waves at front locations captured from the Twin-Otter aircraft.

Waves across current front from Twin-Otter aircraft. One can see more whitecaps on the left side of the front. Credit: Nick Statom.

During the cruise we have experienced a large number of sea states, from calm ripples to almost 4 meter (13 feet) wave height during one night (October 23rd). The wave height is not actually a drawback for instruments deployments and the life onboard; indeed, waves can be high, yet very long, allowing the ship to travel on them like on smooth hills. On the other hand, the steep waves, those that are short and high, definitely cause a strong pitch and roll of the ship and therefore an uncomfortable sleep or the end of CTD casts. However, those waves were always welcomed with joy by the night watch (from 4 p.m. to 4 a.m.). Seeing the dry lab, the dining room, and the bridge tilting by more than 10 degrees has nothing to envy from a traditional roller coaster. Make sure that your belongings are firmly attached!

A collection of photos of the ocean and the sky, showing varying heights of the waves.
Caption: Daily pictures of the sea-state from October 9th to the 29th from the Bold Horizon Credit: Gwendal Marechal

I spent most of my free time observing waves from the deck or the bridge of the ship. Well, my free time during daylight was no longer than 2 hours daily, and this was my chance to discuss with the whole scientific team, because this was the only time when everyone was awake. I took the opportunity to be with expert in air-sea interactions to learn about the atmospheric boundary layer from simple cloud observations or radiosonde deployments. Certainly, I have learned a lot about cloud formation, cloud dynamics, and how the clouds are strongly linked to the sea surface temperature. On my side, I tried to share my “nerdy” wave-knowledge about wave breaking, sea-spray emissions, wave modulation, and what I understand in general about this moving superficial layer of the ocean.

Measuring waves or not, this cruise was definitely a new crazy adventure at sea with the night watch team (Mackenzie, Jessica, Igor, Ben, and Alex) and the crew in general. I’m looking forward to the next cruise for a new journey!

Wave steepness and Significant Wave Height from the Point Reyes buoy offshore San-Francisco. The steepness has been computed from the mean wave period (T) and the significant wave height

Cloudy with a Chance for Whirlpools: Ocean Models Guide NASA’s S-MODE Mission

By Joseph D’Addezio, oceanographer with the U.S. Naval Research Laboratory // NASA’s Stennis Space Center in southern Mississippi //

NASA’s S-MODE mission faces quite the challenge: robustly observe, for the first time, ocean features spanning up to about 6.2 miles (10 kilometers) across. Currently, the oceanographic community routinely observes and studies very large ocean features, primarily through space-based instrumentation. These include strong currents such as the Gulf Stream that runs from Florida along the East Coast of the United States all the way to western Europe. Large vortexes are also observed – these being the cyclones and anticyclones you may have seen on your evening weather forecasts.

(Top) A photo of Joseph. (Bottom) GIF of ocean currents and whirlpools off the coast of San Francisco, California. Credit: Courtesy of Joseph D’Addezio

On the other end of the size spectrum, we also understand quite a bit about much smaller ocean features such as surface waves you’ve seen every time you visit the beach. The features S-MODE is targeting are unique specifically because they are too small to be seen from space and too large and sparse to be sampled without having to commission a ship and an array of many other instruments.

So, S-MODE is on the hunt for these elusive features. Ocean models are one of the tools that S-MODE is utilizing. You may be aware that meteorologists are often aided by predictions provided by weather models. Fortunately for oceanographers, the same mathematical equations used by weather models can be used to predict the ocean. The Navy runs daily ocean models to estimate the current state of the global ocean and predict what the ocean may look like in several days. This ocean prediction capability is where the Navy and S-MODE intersect: ocean models provide another tool S-MODE can use to make targeted observations in its quest to find and understand kilometer-scale ocean features.

Running an ocean model is not easy. Firstly, the mathematical equations must be solved on a large three-dimensional grid using supercomputers. This requires many times more computation than what is available to the smart phone you may be reading this on. Secondly, the equations are extremely sensitive to the accuracy of the initial ocean state. Small errors in the initial estimate of the ocean increase exponentially with time. This problem is combated by routinely incorporating recent observations into the model to correct the errors the model is accumulating with time. This process is called data assimilation (yes, like the Borg aliens in Star Trek). This process is mostly science with a touch of art. I mean that decades of research have been poured into the subtleties of how to optimally blend the model prediction and the incomplete, but invaluable, observations we have of the ocean.

Ultimately, the ocean model is a useful but imperfect tool for the S-MODE mission. The model can’t tell S-MODE exactly where the kilometer-scale features of interest are, but it can give hints. A useful analogy might be tornado chasers. Operational weather models do not accurately predict exactly where a tornado will spawn. They do however tell astute users where favorable conditions exist for a tornado to form. The tornado chasers can then travel to an area of interest based on the model and use tools like radar (and at some point their eyeballs) to track a tornado. S-MODE employs a similar methodology. The ocean model will update using recent

observations and make a new prediction every day. The S-MODE team can monitor how the model expects the larger scale features of the region to evolve and move their ship to a region where features of interest might be expected to form. 

About Joseph D’Addezio:

I work on research and development for the Navy’s ocean models, with a specific focus on data assimilation: the process by which the ocean model is updated to include information from recently taken observations. My group and I are stationed at NASA’s Stennis Space Center in southern Mississippi. Stennis is known primarily as a test site for NASA rocket engines. Sometimes the walls of the office shake. Most importantly, nothing beats New Orleans food. We could do without the hurricanes though.

Where No Map Leads: Reflections from NASA’s S-MODE Mission

By Leo Middleton, Scientist at Woods Hole Oceanographic Institute // Aboard the Bold Horizon //

Image of gray waters on a calm, foggy. Dolphins surface in the center of the image, no more than gray blobs disturbing the otherwise calm water.
Dolphins surfacing at a submesoscale front on a calm, foggy day – photo taken off of the stern of the Bold Horizon. Credit: Gwen Marechal

It’s like stumbling through a thick forest and breaking out into a glade. A quiet has settled on this piece of sea as the waves calm. You can’t make a good map to get to this place. In the ocean, these glades are always moving, twisting, being born into life by the collision of great currents, then breaking apart, fracturing and sinking beneath the waves. The cold water brought from below by the coastal winds creates a fog that lies heavy on the sea surface, creating this small, calm spot.

Places like this can be found by things with nowhere else to go. Throw something off the side of a boat and it will likely end up somewhere like here. We’re at a convergence zone that attracts floating debris of all sizes. In particular, it attracts minuscule plankton, along with all the things that eat them and all the things that eat those things and so on and so on. All of it dragged hereby the undulating ocean.

Blue flashes of plankton can be seen leaning off the side of the boat. A pod of porpoise playing in the waves and feasting on the fish that came to feed. Slicks of water, even calmer than the rest, drift by the ship; signaling abrupt changes in temperature and saltiness where water rises up to the surface, bringing fish food from below.

This place was formed by great ocean currents passing by one other, mixing a little, trading parts of themselves. That’s how we found it: we followed the cold water that rises at the coast (just west of San Francisco) as it gets stirred out into the Californian Current. As the seasons change, these currents will move and alter, but for now they’re making this lush ocean glade, full of life and movement out in the open sea.

Soon this place will be gone again: nothing is static in the ocean. Then what happens to all this life? The millions of tiny creatures who thrive in this glade. They sink. Forced underneath the warmer water, the cold water subducts, bringing down with it all the drifting plankton and all those gases it stole from the air. That’s what we’re here to capture, the moment the water sinks. We’re trying to fill bottles full of the water that has sunk, to examine how the plankton respond to this sudden change in environment. Once the fog clears, we’ll see the planes flying overhead:they’re trying to capture this same process from the sky.

The ocean below will be thankful for this event, refreshed and renewed by new chemicals and nutrients that reach down beyond where light touches; continuing this cycle that’s been present for so much longer than we’ve known about it. The contact with the surface survives as a memory for this water, that will slowly degrade as it continues its meandering path across the oceans.

Finding Nature at Sea During NASA’s S-MODE Field Campaign

By Alex Kinsella, Postdoctoral Investigator at Woods Hole Oceanographic Institution // Aboard the Bold Horizon //

My favorite part of being at sea is the opportunity to see unique parts of the natural world that aren’t accessible from land. My colleagues have done a fantastic job in their blog posts explaining the science that we’ve been conducting during S-MODE, so I want to take this opportunity to describe some of the sights that those of us on the Bold Horizon have been able to enjoy during our field work: birds, mammals, weather, and stars.

A black-footed albatross shows off its sleek wings over the wake of our ship. Credit: Alex Kinsella.

The nature highlight of the cruise for me has been the opportunity to see pelagic birds, which are those that spend most of their lives at sea and are rarely, if ever, seen from land. The most majestic seabird in our region is undoubtably the albatross, which uses an elegant method called dynamic soaring to fly with almost no effort. Throughout the cruise, we have seen many black-footed albatrosses, with as many as six at one time flying back and forth over the wake of our ship. By soaring in loops between a low-altitude track sheltered behind the waves and a higher-altitude track in the open air, they are able to harvest energy from small-scale wind shear to fly for miles without flapping their wings. These birds have been our most constant companions during the day, but we have also been joined overhead at night by many flocks of Leach’s storm petrels, blackbird-sized seabirds which have been in the midst of their autumn migration. Shearwaters, jaegers, murrelets, and fulmars have rounded out the pelagic cast for a wonderful birdwatching experience.

A black-footed albatross soars through the sunset, overlooking our operations on deck. Credit: Alex Kinsella.

The other prominent animal life during the cruise has been the marine mammals, which have sometimes showed up in impressive numbers. The California coast is a region of plentiful food availability due to large-scale upwelling of nutrient-rich deep water driven by northwesterly winds. Pods of Pacific white-sided dolphins have been swimming up to our ship to play in the bow wake, breaching and diving from side to side. We have spotted several fin whales too, which amaze us all and beckon a rush of scientists with cameras in hand. Ocean fronts are often nutrient hotspots, so it’s possible that the whales are searching for the same features that we are. 

One of the many whales that have wowed us with their spouts and dives. Credit: Alex Kinsella.

We have also been enjoying (and enduring) the vagaries of the weather, one of the most ancient forms of entertainment. The cruise has featured two contrasting weather patterns: in the first half of the cruise, we had an endless gray stratus deck and occasional dense fog. We didn’t see the sun, moon, or stars for over a week! Around the halfway point of the cruise, a cold front passed through and cleared away the low clouds, replacing them with mostly clear skies that have featured interesting patches of mid- and high-level clouds, but also interminable wind and waves.

Dramatic altocumulus clouds served as our re-introduction to the sky after the stratus deck finally lifted. Credit: Alex Kinsella.

For our purposes, the most important part of weather at sea is the ocean surface waves, the characterization of which we call the “sea state”. A calm sea state is much better for our operations, but a lively sea state can make for great nature-watching. My colleague Gwen Marechal, a postdoc at Colorado School of Mines, is our resident wave expert, and the way he looks at waves reminds me of the way that most of us look at wild animals. We’ll be gazing out at the ocean and Gwen will point off to the distance. “Bird?” I ask. “No, a really good wave!” he says with reverence and a smile. One can think of there being at least two “species” of waves: wind waves and swell, but in a given sea state, each passing wave is unique, with its own height and character. Watching for good waves can be as satisfying as watching for good birds.

Sea spray from a breaking wave forms an ephemeral rainbow. Credit: Alex Kinsella.

When we’ve had clear skies at night, stargazing has been a favorite evening activity, as it always is at sea. Jupiter has been rising in the early evening, giving us a bright companion in the southeast sky as we transition from day watch to night watch on the ship. Around 8 p.m. each night, the sun is far enough below the horizon that the Milky Way becomes clearly visible, along with familiar constellations like Ursa Major, Cassiopeia, and Sagittarius. Finding those landmarks in the sky can be harder at sea than in a city, because there are almost too many stars, so the familiar ones are harder to find! We have continued the maritime tradition of philosophizing under the stars at night, wondering about the ocean below, the sky above, and much more.

Four of our autonomous saildrone vehicles shine at night like new planets on the horizon. In the sky are stars from the constellations Ophiuchus and Hercules, but the photo captures only a tiny fraction of the stars visible by eye. Credit: Alex Kinsella.

Being at sea truly feels like being in another world, but, at least by surface area, this is what most of the world looks like. It has been a gift to be on the ocean watching this part of our planet in its daily motions. The science we’ve conducted on this cruise will help us understand one more piece of nature’s workings, but no amount of knowledge can quite capture the experience of being in the midst of it all.