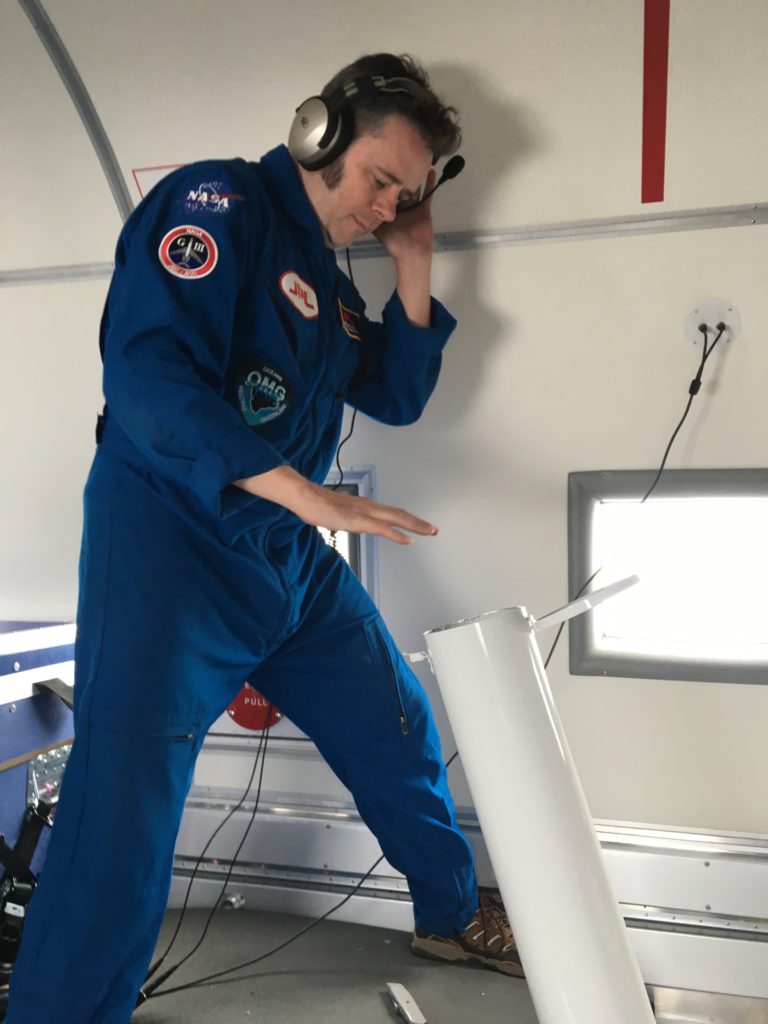
Meet Corey Walker, NASA Earth Science Intern and Aspiring Educator

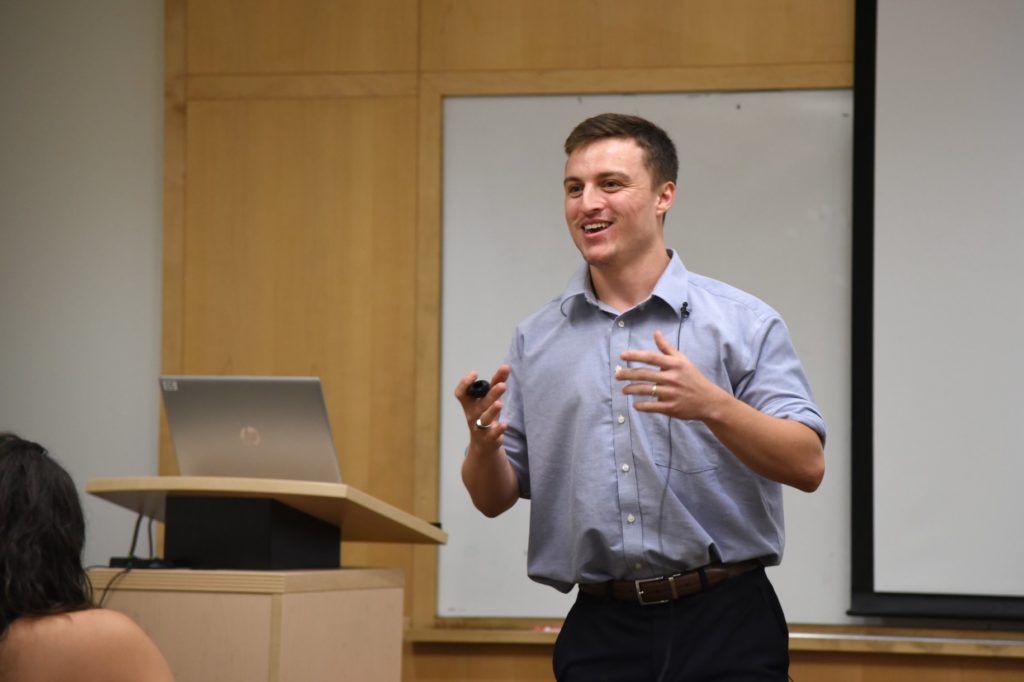
Corey Walker presents his research findings to the Student Airborne Research Program group. Credits: NASA / Megan Schill

By Corey Walker / NASA ARMSTRONG FLIGHT RESEARCH CENTER, PALMDALE, CALIFORNIA /

My name is Corey Walker. One of the most incredible things I’ve done on paper is become a NASA intern through the agency’s Student Airborne Research Program, otherwise known as SARP. Why? I grew up in Etowah County, Alabama which has a poverty rate well above the national average. At the end of the year, I will be one of just 8 percent of people from my hometown who will have achieved a bachelor’s degree. I’ve come to recognize that the opportunity I’ve had is somewhat of an anomaly for many who have watched my success.

I wanted to participate in this Q&A blog to share my experience with the NASA SARP program and to express my gratitude towards those who have given someone like me a chance to succeed. I also want to encourage the next generation of student scientists to apply for opportunities like SARP to broaden their skill sets and to experience what field research and lab analysis is all about.

What do you think it takes to become a NASA intern

CW: The conditions that create a NASA intern are variable depending on who you ask. However, for me it begins with ordinary people who have extraordinarily impacted my life. Along the way family, friends, teachers, and mentors have taught me the value of perseverance,  working hard, and pushing yourself beyond known limits.
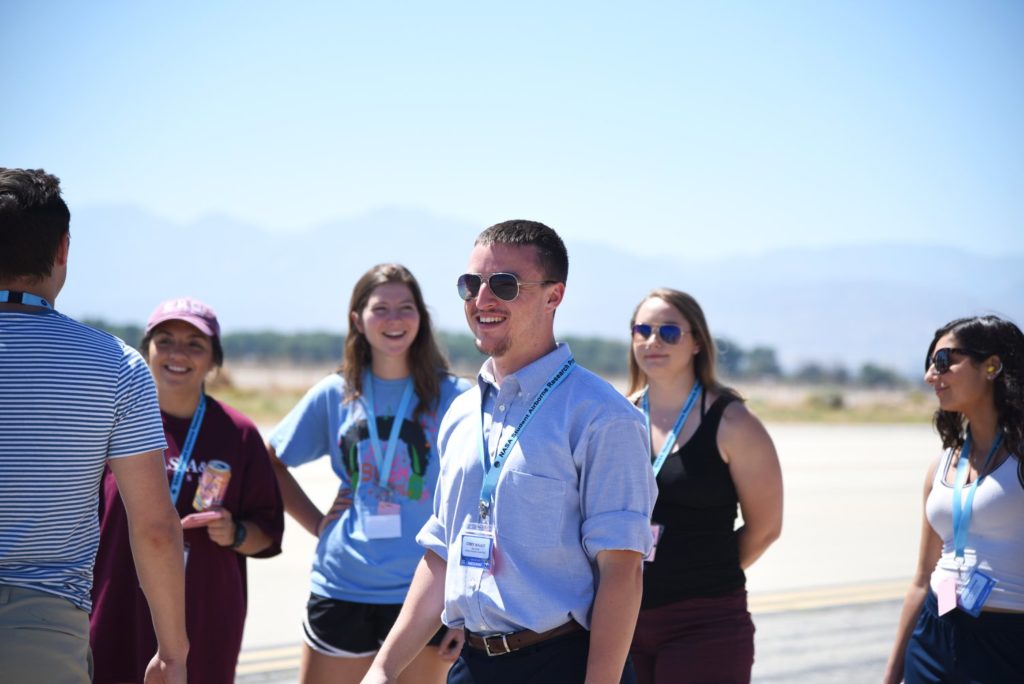
Corey interacts with fellow SARP interns on the flightline at NASA’s Armstrong Flight Researcher Center’s facility in Palmdale, California. Credits: NASA / Megan Schill

Why did you apply?

CW: The answer to this question lies in the evolution of my interests. For example, when I was a freshman, I was an English major. I applied the skills I learned with my time in the English department to the development of a YouTube channel, which I’ve since neglected. My sophomore year, I changed my major to nursing. While in this major, I applied myself to the rigorous study of science. Through this study, I produced a bit of character development and self-confidence. As science education molded me, I decided to study biology and education as a double major. I’m proud to report that I graduated this month. As a future science educator, I want to use my experience in the classroom to leverage curiosity and the understanding of complex systems. I also want to inspire the next generation to apply themselves towards their own challenging, individual goals like the one I achieved by working for NASA.

This isn’t the first time you’ve applied with the program. What inspired you to persevere and apply again?

CW: I have heard lots of teachers say something cliché like, “You can do anything you set your mind to.” I personally believe in this phrase, first because I am an optimist, and second because I think humans are powerful when they decide to act. However, I think that there is a responsibility that comes with believing this phrase. Personally, I think it would be unfair for me to tell my students to believe in themselves if I first did not believe in me. In a lot of ways, applying to SARP again is just myself modeling for students the act of taking responsibility for my beliefs. I also hope my second application to SARP teaches students an important lesson. Failure is feedback.
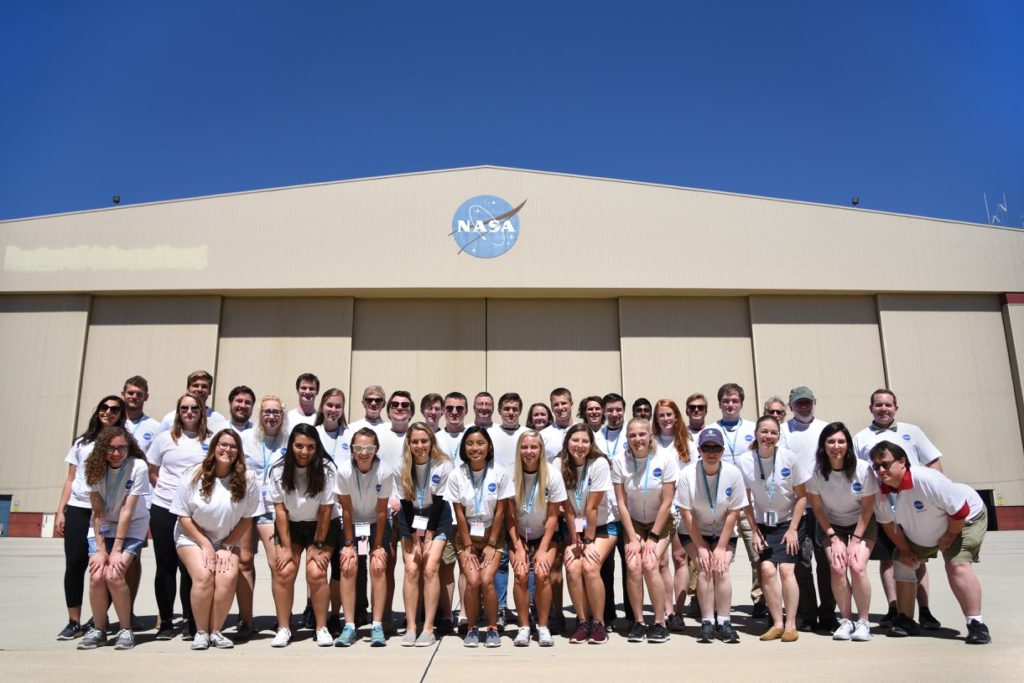
2018 Student Airborne Research Program Interns. Credits: NASA / Megan Schill

Why do you think internship opportunities like SARP are important for college students?

CW: I came to SARP from a small, liberal arts institution in East-Central Kentucky called Berea College. I am the first SARP alum from my school. The connections I made with this research experience will be extremely valuable to future generations. I intend to help someone else from Berea find the opportunity to work at NASA by connecting them to the network of scientists I have created. I also think opportunities like SARP are a great resume booster. This research experience under my belt will certainly prepare me better for graduate school.

What do you think undergraduate students can benefit from most by participating in opportunities like SARP?

CW: SARP is interesting because it puts you in an environment where you are forced to learn new things you’ve never thought about studying. As an educator, I am a big proponent of discovering new things. While at SARP, I was introduced to analytical tools and software like ENVI and MATLAB. I even had the opportunity to work with ArcGIS and ArcMap. This made me see a side of science that was utterly new and outside to anything I had ever contemplated.

Another thing that is beneficial about SARP is the way you get to be inspired by all kinds of interesting scientists and experiences. Some of my favorite moments were when I got to hold Sherwood Rowland’s Nobel Prize and see a real Mars lander being built at JPL for the 2020 mission.
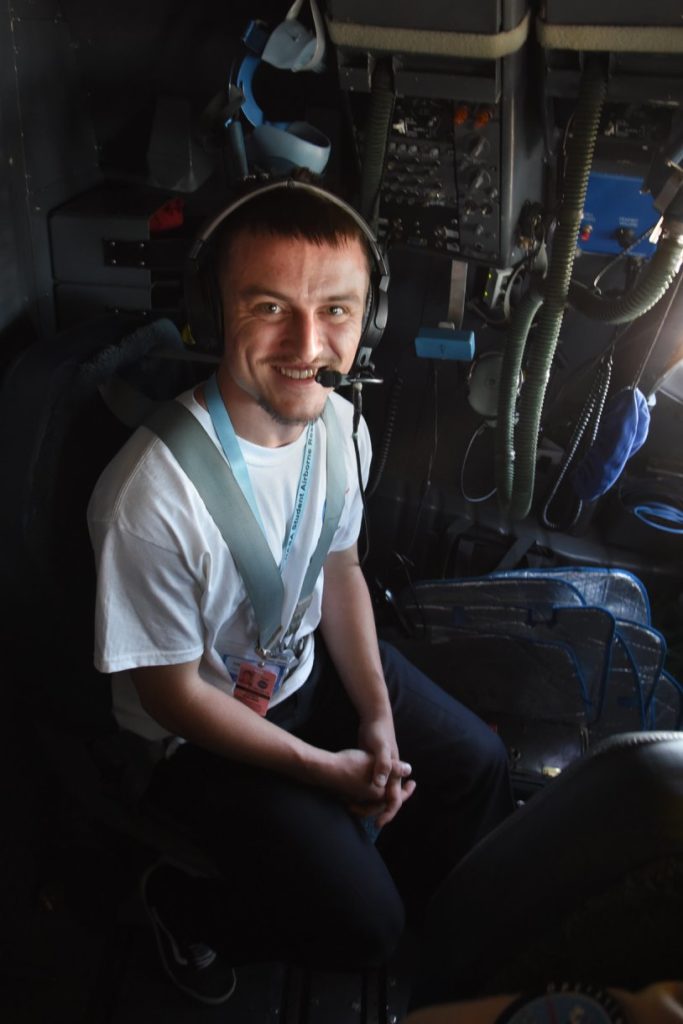
Corey Walker sits in the cockpit jump seat aboard the NASA DC-8 during a science flight. Credits: NASA / Megan Schill

Describe your research project and group.

CW: Something I noticed while flying in Southern California was all the tile or red-shingle roofs. This was certainly different from where I grew up and intrigued me. Because of my experiences being a volunteer firefighter with the city of Berea, I began to wonder how defensible red-shingle roofs were compared to wood shingle roofs if exposed to wildfire. This interest, along with help from mentors Alana Ayasse and Dr. Dar Roberts gave me the desire to develop a project where I mapped fire risk using remote sensing instruments. In my project, I successfully mapped materials like non-photosynthetic vegetation (NPV) or dead grass, green vegetation (GV) and soil and road in Goleta. I then compared maps I made to the location of the Holiday Fire, which started on July 11, 2018 and destroyed 28 structures.

How did you collect data for your research?

CW: I used data taken from NASA’s ER-2 16 days prior to the Holiday Fire. It was important for me to use data that was as close to the fire date as possible. I did this in order to accurately assess what kinds of materials were on the ground before the fire started.
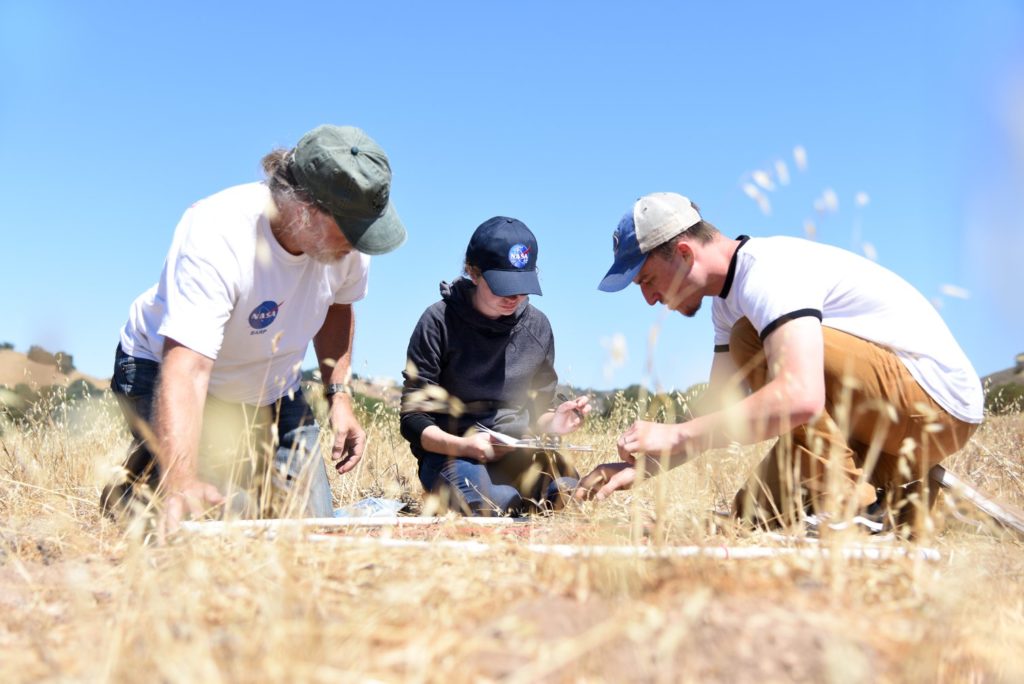
The SARP Wildfires team collects field data in Central California. Credits: NASA / Megan Schill

What did you learn from the research?

CW: Not only did I show that the Holiday Fire occurred in a high fire risk area, but I also found interesting patterns. More specifically, my maps showed high fire risk in areas to the north and south of Goleta’s urban center where there is less road and more vegetation. My maps also show high fire risk in areas where property values are higher, which is a little alarming. For example, to the north, I found properties costing upwards of $700,000 surrounded with materials that could easily burn.

How do you plan to use this internship experience and your education going forward?

CW: Because of SARP, all the kids at the high school I teach at think I’m “cool.” This should be the objective right? It is interesting how working for a widely known name can inspire students and make them believe they could also do something “crazy” like working for NASA. Besides bringing my experiences into the classroom, I’ve decided I want to pursue a PhD in Earth Sciences and one day become a professor.

I’ve recently become interested in a hazards program at Oxford in the UK. I’ve certainly gained some self-confidence from getting to work for NASA, which has given me the desire to aim for a school like Oxford.

There is a professor named Dr. Tasmin Mather at Oxford who has used the European Space Agency’s Sentinel-1 to study volcanoes for the benefit of international communities. I find this work to be interesting as a scientist and volunteer firefighter. I like the way she uses science to inform the public of hazardous threats. I think it would be really cool to use my experience at SARP as a way to set me apart when I apply, so that I could one day work with someone like Dr. Mather.

Left to right: Chan Oh and Corey Walker. Chan was Corey’s roommate during college.

Is there anyone else you’d like to recognize that has helped along your journey?

CW: I want to recognize and thank my family who have invested their time, resources and love into my success. I also had a number of teachers and mentors who went out of their way to push me out of my comfort zone. Lastly, I want to thank my wife Emily, who sacrificed time that could be spent together so that I could do science in California. Thank you all.

For more information on the Student Airborne Research Program and to apply visit: https://baeri.org/sarp-2019/

To read other blogs written by current and former SARP students visit: https://blogs.nasa.gov/earthexpeditions/?s=SARP

Chasing Clouds and Smoke Over the Southeast Atlantic

By Michael Diamond / SÃO TOMÉ AND PRÍNCIPE /

Michael is a PhD student at the University of Washington in Seattle.

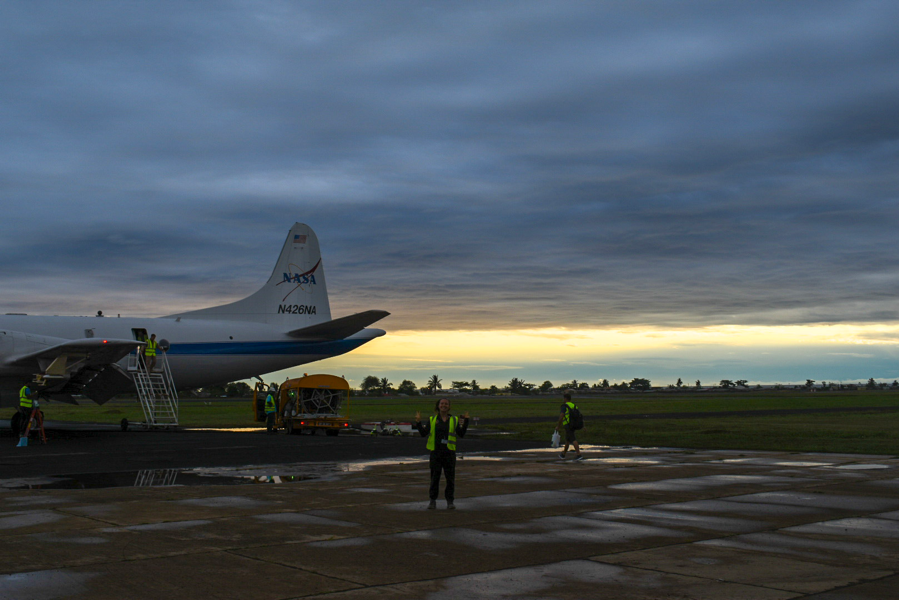
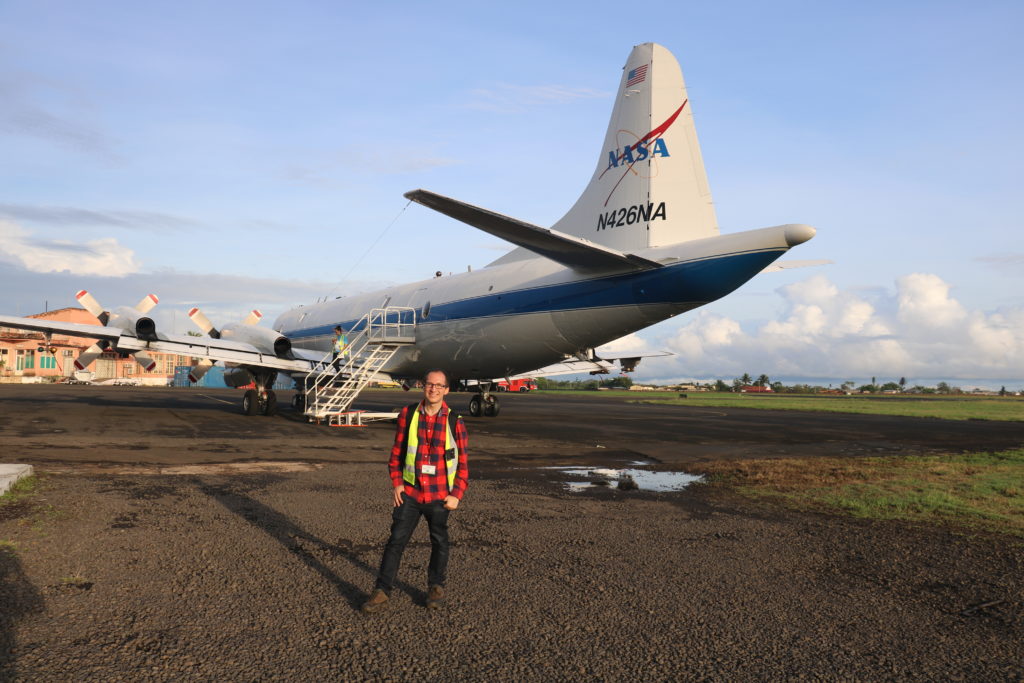
Image 1: Michael Diamond in front of the P-3 at São Tomé International Airport before the October 10th, 2018, ORACLES flight. Photo credit: Rob Wood
Michael Diamond in front of the P-3 at São Tomé International Airport before the October 10th, 2018, ORACLES flight. Photo credit: Rob Wood

Our October 2018 deployment may be our last of the ORACLES (ObseRvations of Aerosols above CLouds and their intEractionS) campaign, but it certainly won’t be our least. (We love each of our three deployments equally, of course.) During ORACLES, scientists from multiple NASA centers, universities, and other partners came together to study the complex interactions between smoke from fires on the African continent and low-lying clouds, called stratocumulus, over the Atlantic Ocean between September 2016 and October 2018.

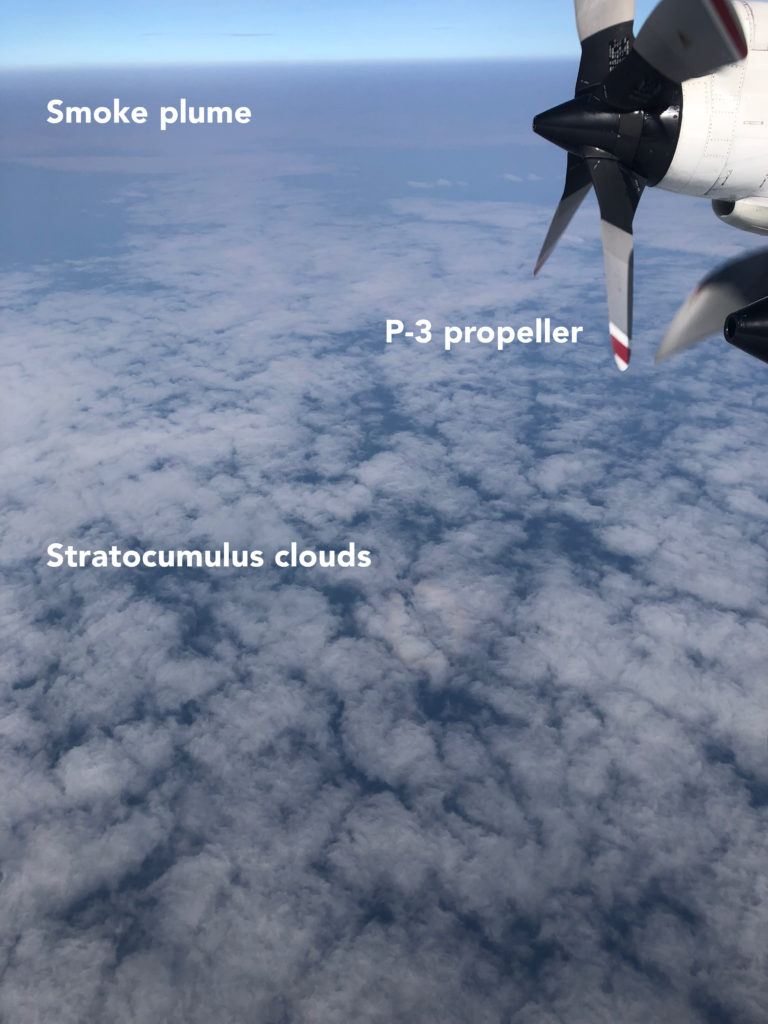
Image 2: View of smoke produced by fires in southern Africa over low-lying clouds in the southeast Atlantic Ocean from onboard the P-3 during the October 10th, 2018, ORACLES flight. Photo credit: Michael Diamond
View of smoke produced by fires in southern Africa over low-lying clouds in the southeast Atlantic Ocean from onboard the P-3 during the October 10th, 2018, ORACLES flight. Photo credit: Michael Diamond

As my colleague Andrew wrote previously, climate models struggle to accurately capture the physical processes that occur when smoke particles, also known as aerosols, overlie and mix into clouds, in part because these processes occur at such small scales. The effects of aerosol-cloud interactions can include warming from sunlight being absorbed by the smoke and/or cooling from changes in the clouds’ brightness, coverage, and precipitation — it is still uncertain whether the heating or cooling effects cancel each other out or if one effect wins out in the end. We need the best observations we can get to better understand the fundamental physics and chemistry of this smoke-cloud system and use that knowledge to improve the models. Because the clouds and smoke we’re interested in are many miles away from land, the best way to study them is from the air.

Enter the NASA P-3 Orion: a four-engine turboprop plane that can directly sample the smoke plume and the clouds, from 20,000 feet in the air all the way down to just above the ocean surface.

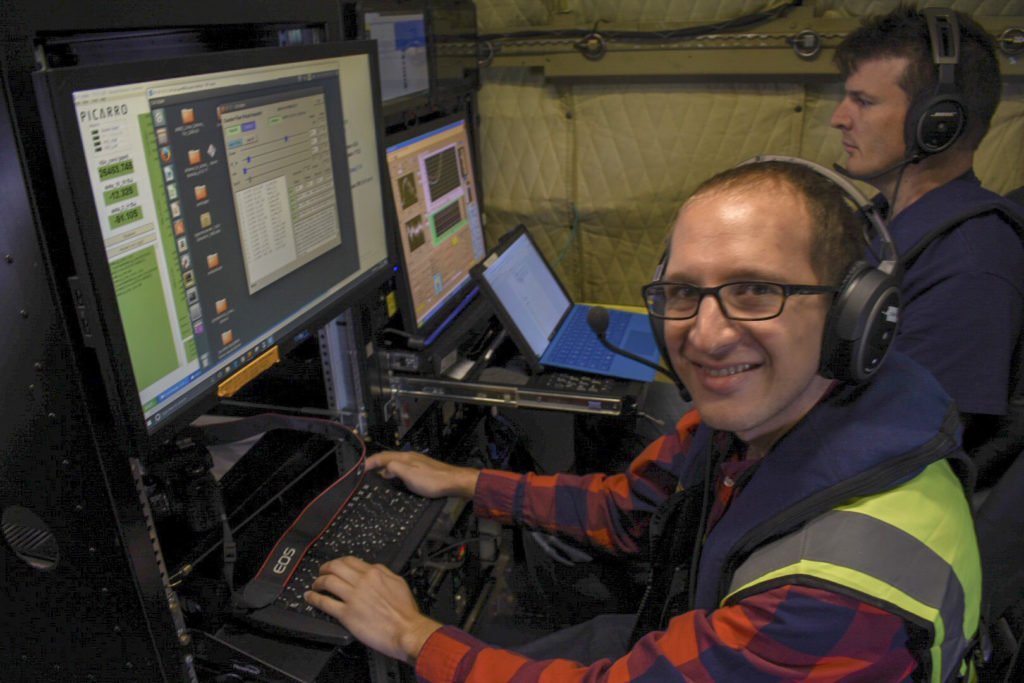
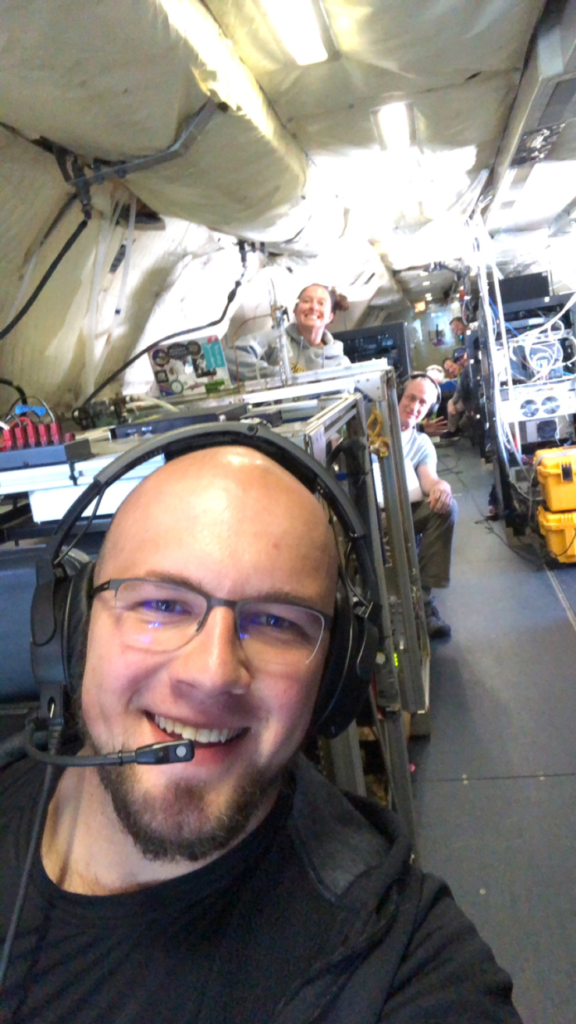
Image 3: Michael Diamond (front) operating a Counterflow Virtual Impactor Inlet System (CVI), which lets instruments make aerosol measurements within the clouds, and Steve Broccardo (back) operating the 4STAR (Spectrometers for Sky-Scanning, Sun-Tracking Atmospheric Research) instrument, a sunphotometer that can measure smoke properties at multiple wavelengths of light, aboard the P-3 on the October 10th, 2018, ORACLES flight. Photo credit: Andrew Dzambo
Michael Diamond (front) operating a Counterflow Virtual Impactor Inlet System (CVI), which lets instruments make aerosol measurements within the clouds, and Steve Broccardo (back) operating the 4STAR (Spectrometers for Sky-Scanning, Sun-Tracking Atmospheric Research) instrument, a sunphotometer that can measure smoke properties at multiple wavelengths of light, aboard the P-3 on the October 10th, 2018, ORACLES flight. Photo credit: Andrew Dzambo

Initial results from our September 2016 deployment showed that, because it takes a fairly long time for the smoke from above to mix down into the cloudy layer, it may be best to study the smoke-cloud interactions by following individual cloud systems. This means we can account for how a cloud changes and evolves over time and how long the clouds and smoke have been in contact. For two of our ORACLES-2018 flights, we attempted to do just this, using a forecast model from the National Oceanographic and Atmospheric Administration (NOAA) to predict where clouds sampled on one flight would end up the next day, and then sampling the clouds there. For a fairly typical wind speed of around 10 knots, the clouds can travel approximately 300 miles in one day.

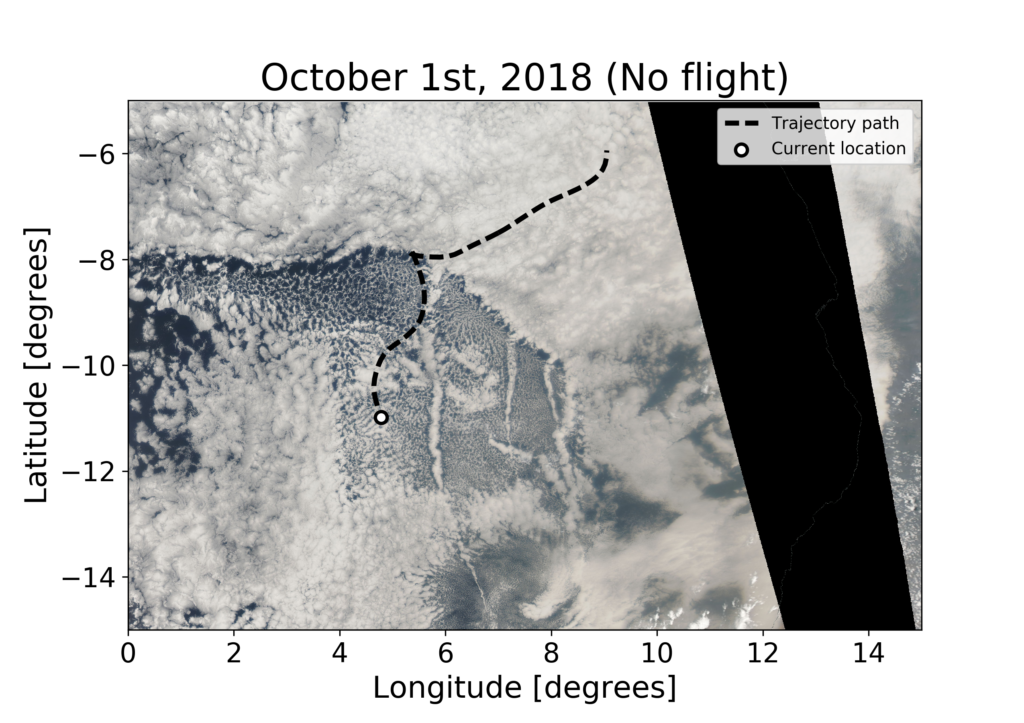
A great opportunity for this type of flight arose on October 2nd. The day before, a “pocket of open cells,” or POC, developed around the area we normally fly. In a POC, the stratocumulus clouds arrange themselves in a quasi-hexagonal pattern, with cloudy areas on the edges and clear skies in between. In “closed cell” clouds, which we sampled more regularly, the opposite pattern holds, with clear slots at the sides and overcast skies in between. During most ORACLES flights, we aimed to sample “polluted” clouds, with lots of aerosols in the air below the cloud. POCs are an interesting case because they tend to be very “clean,” removing aerosols from the air through drizzle. This precipitation is very likely the driving factor determining whether the clouds arrange themselves in open or closed cellular formations. We still have open questions remaining about whether aerosols can suppress precipitation and induce the open cells to transition into closed cells.

Image 4: True color image of the POC on October 1st from NASA’s Moderate Resolution Imaging Spectroradiometer (MODIS) instrument. The dotted black line shows the trajectory of a point (white circle) originally inside the POC for three days as it travels around the southeast Atlantic. The POC can be seen as the anvil-shaped collection of open cell hexagonal clouds between 8 and 12 degrees south and 0 and 8 degrees east. Image credit: Michael Diamond/NASA Worldview/NOAA Air Resources Laboratory (ARL)
True color satellite image of the POC on October 1st from NASA’s Moderate Resolution Imaging Spectroradiometer (MODIS) instrument. The dotted black line shows the trajectory of a point (white circle) originally inside the POC for three days as it travels around the southeast Atlantic. The POC can be seen as the anvil-shaped collection of open cell hexagonal clouds between 8 and 12 degrees south and 0 and 8 degrees east. Image credit: Michael Diamond/NASA Worldview/NOAA Air Resources Laboratory (ARL)

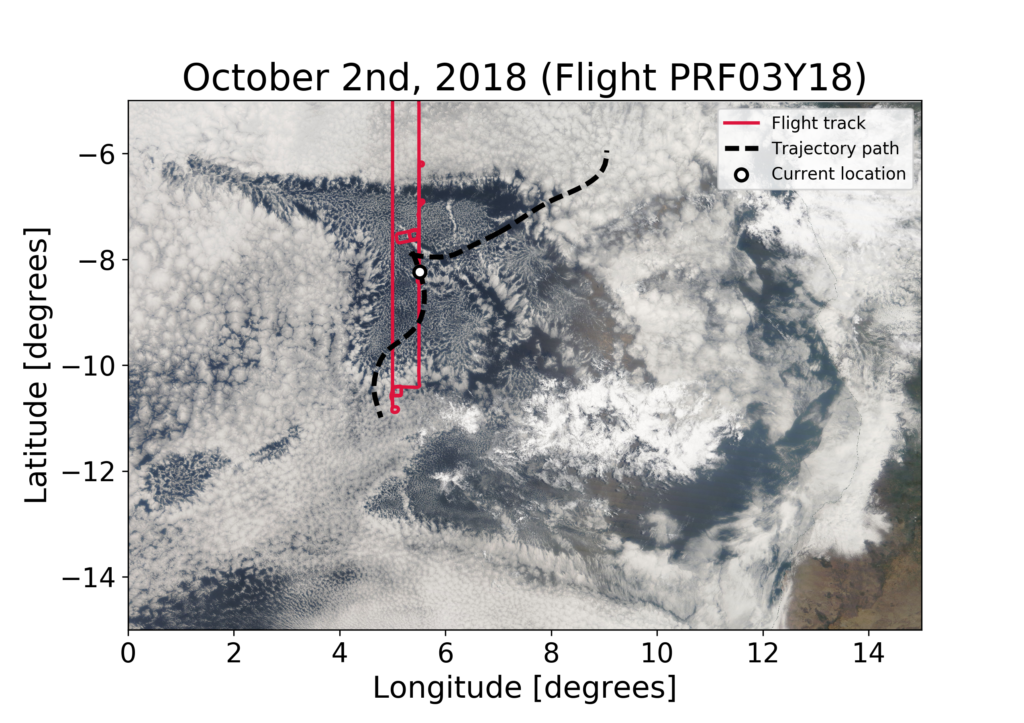
We first sampled the POC on October 2nd, flying above, below, and within the clouds. We were also able to sample another interesting feature: the white diagonal line of cloud that can be seen cutting through the POC near where we flew is called a ship track. Ship tracks are formed where the exhaust from ships emits particles and gases that form new aerosols, which can then interact with the clouds. (There are some other ship tracks visible in the satellite imagery from October 1st and October 2nd as well.) As expected, most clouds we sampled were drizzling and the below-cloud air was very clean. The more overcast linear feature in the ship track will help us better understand how clouds transition between open and closed cells.

Image 5: True color image of the POC on October 2nd from MODIS. The dotted black line shows the trajectory from before. The white circle is now at the location the original air was forecasted to have traveled to one day later. The POC can be seen as the anvil-shaped collection of open hexagonal clouds between 6 and 10 degrees south and 2 and 10 degrees east. Image credit: Michael Diamond/NASA Worldview/NOAA ARL
True color satellite image of the POC on October 2nd from MODIS. The dotted black line shows the trajectory from before. The white circle is now at the location the original air was forecasted to have traveled to one day later. The POC can be seen as the anvil-shaped collection of open hexagonal clouds between 6 and 10 degrees south and 2 and 10 degrees east. Image credit: Michael Diamond/NASA Worldview/NOAA ARL

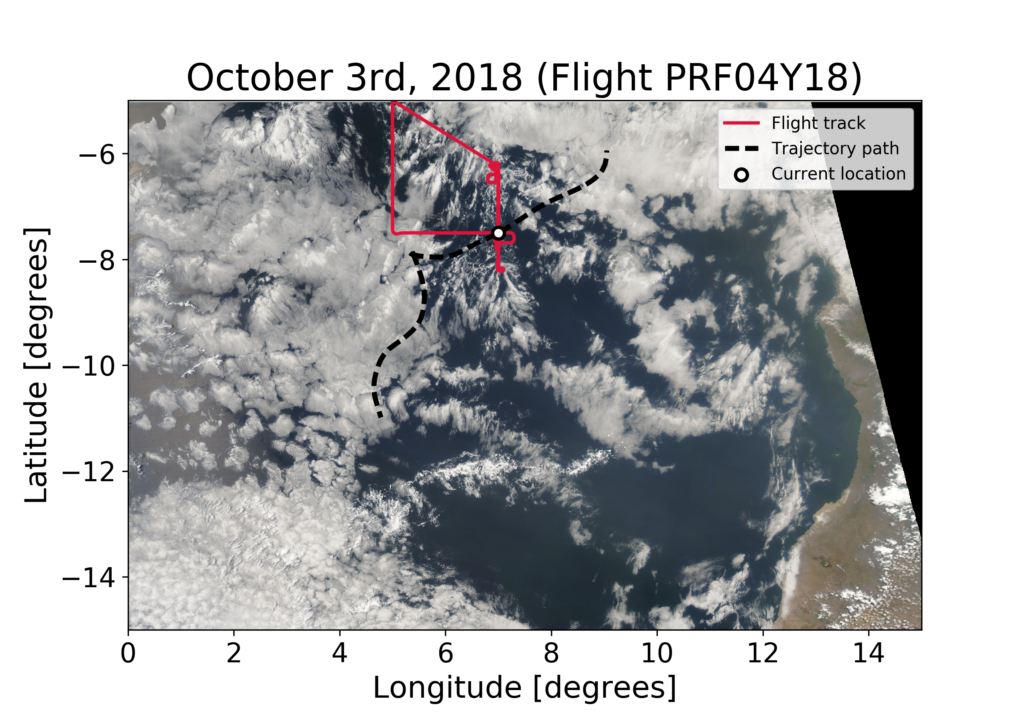
On October 3rd, we set out on a mission to resample the POC and see how the clouds had changed and whether any smoke had been mixed into the below-cloud layer. We were heartened to see from our satellite imagery that the POC had traveled to roughly the same area we had forecasted. The POC by this time was dissipating: some well-developed open cells are still visible, but the POC boundaries had eroded and more “actinoform,” or lace-like, clouds had formed.

Image 6: True color image of the dissipating POC on October 3rd from MODIS. The dotted black line shows the trajectory from before. The white circle is now at the location the original air was forecasted to have traveled to two days later. The POC can be seen as the collection of open cells and actinoform clouds between 6 and 9 degrees south and 3 and 9 degrees east.)
True color satellite image of the dissipating POC on October 3rd from MODIS. The dotted black line shows the trajectory from before. The white circle is now at the location the original air was forecasted to have traveled to two days later. The POC can be seen as the collection of open cells and actinoform clouds between 6 and 9 degrees south and 3 and 9 degrees east.

More analysis will need to be done after we’ve had a chance to calibrate and quality control the data, but our initial readings suggested the below-cloud layer was still relatively clean, with some mixing of smoke from above evident.

At the end of this October 2018 deployment, data collection for the ORACLES campaign will be complete, but there will be plenty of science left to do. Not only do we have our own data to analyze, but there have been other American, British, French, German, and Namibian and South African teams studying similar questions in the same region that we will collaborate with. Together, the multiple field campaigns and model intercomparison projects just completed and currently in the works will greatly improve our understanding of smoke-cloud interactions over the southeast Atlantic and their implications for the regional and even global climate system.

Refining How We See Aerosols, Clouds, and Precipitation in Climate’s Big Picture

By Andrew Dzambo / SÃO TOMÉ AND PRÍNCIPE /

Andrew is a PhD student at the University of Wisconsin-Madison.

Crew and scientists preparing for the October 2, 2018 research flight aboard the NASA P-3 aircraft. Pictured: Amie Dobracki, University of Miami. Photo Credit: Andrew Dzambo

Climate models are essential tools to predict climate’s evolution in the next few decades and beyond. Given current computational capabilities, most global models cannot resolve every scale and process; therefore, we often parameterize (i.e. simplify) the mathematical representation of the processes to obtain results in a reasonable amount of time.

Cloud processes are among the most difficult to parameterize for a number of reasons: clouds form on many different spatial scales, have highly variable time scales, and require simultaneous knowledge of a large number of factors that affect their evolution. Precipitation processes are even harder to capture in climate models because they occur on more highly variable spatial and time scales.

Additionally, the presence of aerosols, such as smoke or dust, further complicates the problem because aerosols’ effects on cloud and precipitation processes often depends on the type and amount of aerosol present.  Overall, our knowledge of how aerosols interact with clouds and precipitation is highly uncertain, especially over remote areas like the ocean. In order to better understand these processes and their impacts on the global radiation and energy budgets – essentially, how heat moves around our planet – we require highly accurate measurements of these aerosol and cloud interactions.

Group picture of some of the science crew from the transit between Sal, Cabo Verde to Sao Tome: Andrew Dzambo (front), Amie Dobracki (middle-left), Art Sedlacek (middle-right), David Harper (back-top), Sam LeBlanc (back-middle), and Tony Cook (back-bottom). Photo Credit: Andrew Dzambo
Group picture of some of the science crew aboard NASA’s P-3 research aircraft from the transit between Sal, Cabo Verde to Sao Tome: Andrew Dzambo (front), Amie Dobracki (middle-left), Art Sedlacek (middle-right), David Harper (back-top), Sam LeBlanc (back-middle), and Tony Cook (back-bottom). Photo Credit: Andrew Dzambo

NASA’s Observations of Aerosols above Clouds and their Interactions, or ORACLES, field campaign has set out to do just that. We are collecting a highly thorough, robust dataset aimed at challenging our current theories about cloud/aerosol interactions and how aerosols affect cloud and precipitation processes in stratocumulus clouds. These clouds might not be as visually stunning as ones associated with severe weather, but to atmospheric scientists, they are very important because they cover a large fraction of Earth’s subtropical oceans and have a large impact on earth’s energy budget. The ORACLES campaign, taking place over the Southeast Atlantic Ocean, bridges an observational data gap where ground and airborne observations are presently limited.

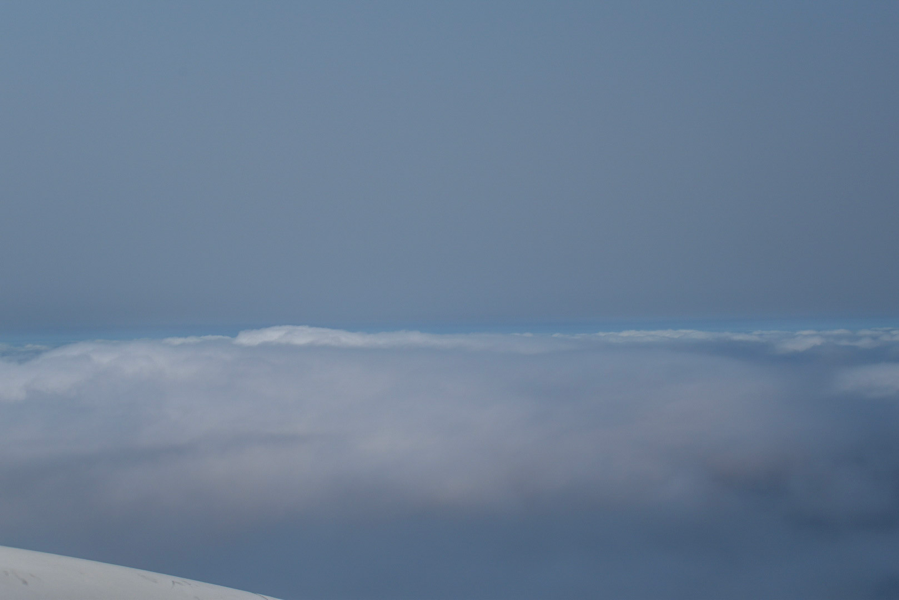
On the October 3, 2018 research flight, the biomass-burning (aerosol) layer is seen just above the stratocumulus cloud deck. Photo Credit: Andrew Dzambo

Weather radars were first developed during World War II, and radar technology has since expanded considerably. In the United States, WSR-88D radars are capable of observing (nearly) the entire country and are capable of notifying meteorologists of impending rain, snow, or destructive storms. But these radars are designed primarily to detect rainfall or ice particles larger than a small drizzle droplet. However, stratocumulus clouds are made up of even tinier cloud droplets, so the weather radar is not the best observing tool for them. Instead we need a radar system specifically designed for cloud detection.

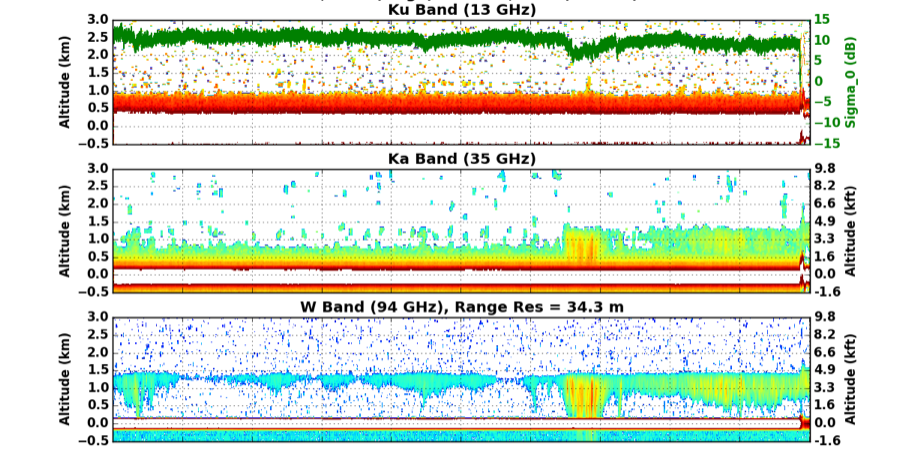
Enter the NASA Jet Propulsion Laboratory’s 3rd generation Airborne Precipitation Radar (APR-3). With development beginning back in 2002, this radar system operates at three frequency bands used to measure thin clouds and light precipitation (W-band), light to moderate precipitation (Ka-band) and moderate to heavy precipitation (Ku-band). This is the first airborne radar system capable of measuring the atmosphere at three frequencies for the same location, which means it can simultaneously detect clouds and precipitation.

During the ORACLES campaigns from 2016 through 2018, the stratocumulus cloud decks we see most often frequently go undetected by the lower frequency Ku and Ka channels. But by including the high frequency W-band radar we can now see the stratocumulus cloud and characterize its structure at a very high resolution.

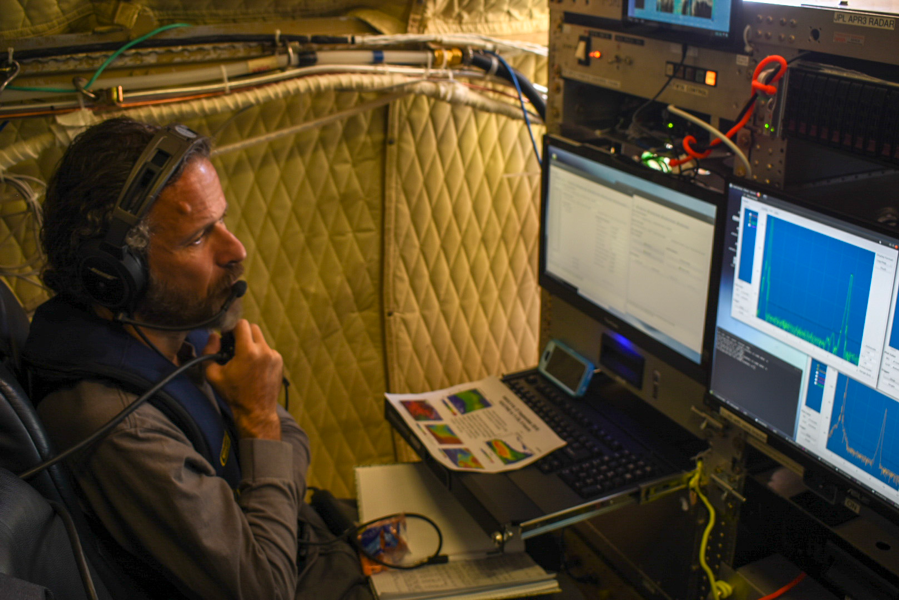
Simone Tanelli (Jet Propulsion Laboratory) operating the APR-3 radar. Photo Credit: Andrew Dzambo

Occasionally, the APR-3 system in ORACLES measures both the cloud and precipitation. Detecting precipitation in multiple radar frequencies is useful as the high frequency W-band measurements commonly attenuates when precipitation gets too heavy – meaning the signal is somewhat lost because precipitating raindrops are too large. On the other hand, the other radar bands (usually Ka-band for ORACLES) can see this precipitation with little to no fading of the signal. The end result is that the multiple channels gives us the ability to better characterize the precipitation that’s happening. In turn, that gives us an opportunity to possibly provide a more accurate estimate of precipitation magnitude in these stratocumulus regions.

This is an example of both precipitating and non-precipitating stratocumulus as seen by the APR-3 radar. The highly sensitive cloud radar (W band, bottom) sees both the clouds and precipitation, whereas the Ka (middle) sees only precipitation and the Ku band (top) sees only the heaviest precipitation. Yellows, oranges and reds indicate precipitation, and blues/greens indicate clouds. The white bar at 0 kilometer/kilofeet (1000 feet) altitude shows the surface. Image Credit: Andrew Dzambo

The ORACLES APR-3 contributes one component of a highly robust dataset designed to study the effects of aerosols on cloud and precipitation processes. Other direct and remote sensing instruments from the ORACLES field campaign collect highly detailed information about aerosol type and amount in the atmosphere – both of which are needed to properly assess cloud/aerosol interactions and their net effect on precipitation. Ultimately, ORACLES will greatly improve how we describe aerosol/cloud/precipitation interactions in future climate models.

MOCNESS Monsters: Creatures of the Deep Sea

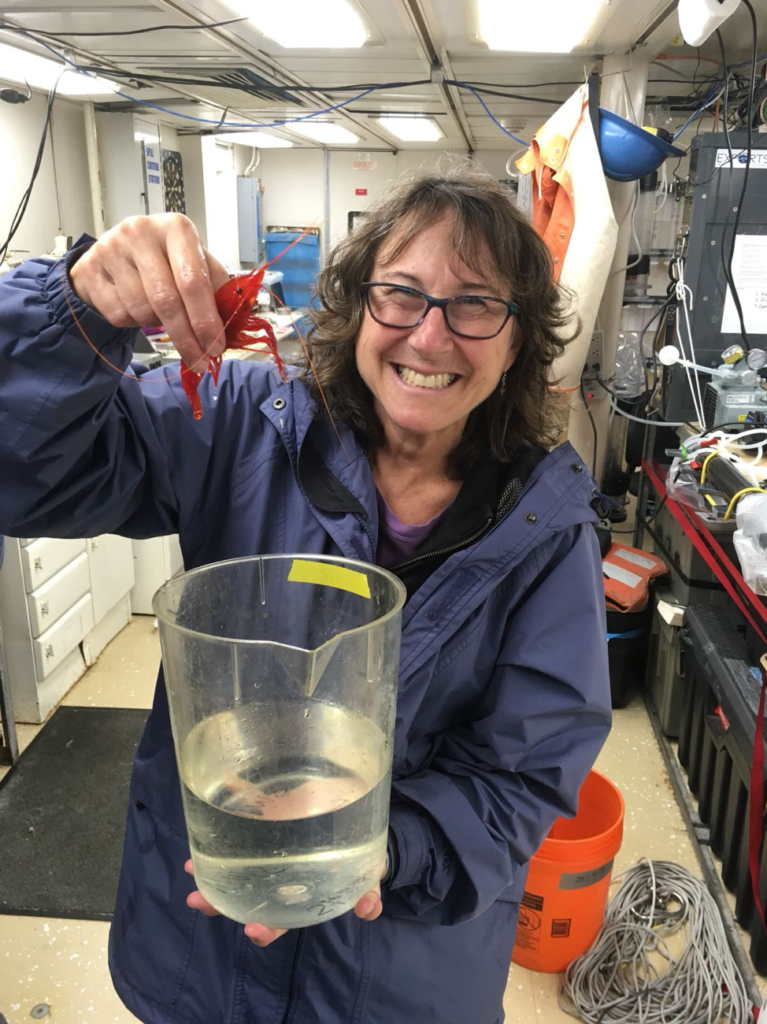
Chief Scientist, Deb Steinberg holding a deep-sea shrimp. Credit: Chandler Countryman

By Chandler Countryman / NORTHWEST PACIFIC OCEAN /

Chandler Countryman is a graduate student at the University of Georgia, studying the vertical transport of organic matter from the surface to the deep ocean.

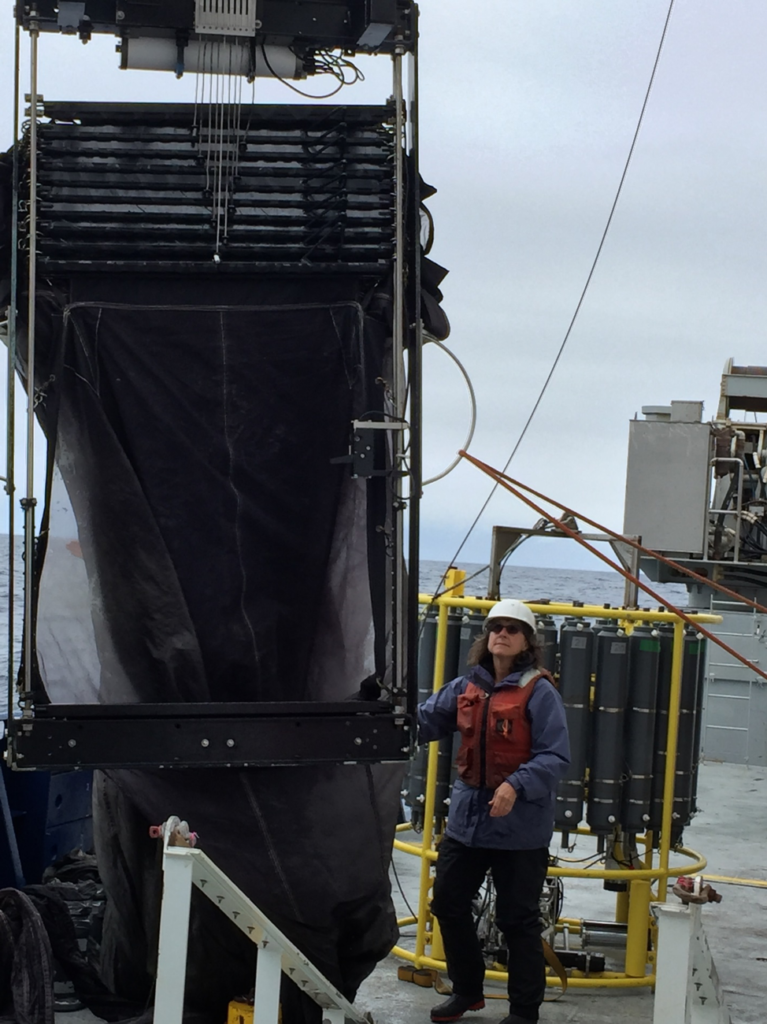
The Multiple Opening/Closing Net and Environmental Sensing System, or MOCNESS, is used to look at zooplankton, sea creatures ranging in size from microscopic to several inches. We’re interested in learning what types are present in the water column, how many there are, and at what depth they are found. As you go down in the water column the community of planktonic animals change, and the depth at which each type of zooplankton is found can change throughout the day, depending on the species. This is referred to as “diel vertical migration” and allows animals to swim to shallower depths during the night to feed and then retreat to deeper depths during the day in order to avoid being eaten by visual predators.

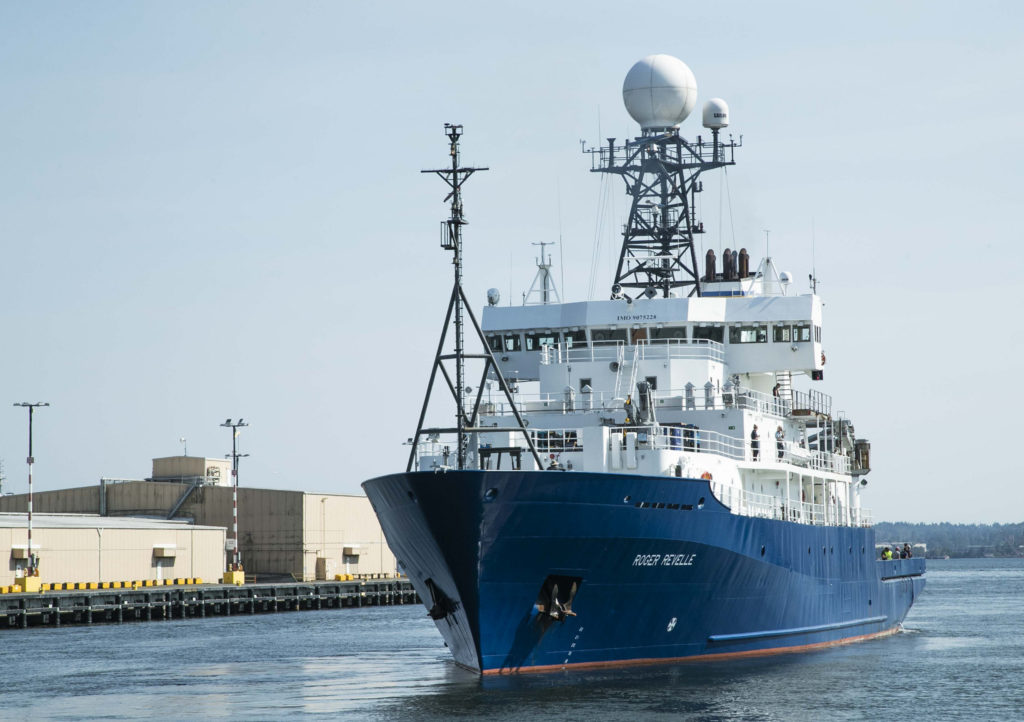
The MOCNESS is a one-meter square frame with ten individual nets and each one can be opened at different desirable depths. The zooplankton team aboard the R/V Roger Revelle, led by Dr. Debbie Steinberg of the College of William & Mary, has sent the MOCNESS down to 1000 meters ten times so far during the EXPORTS cruise, five times during the day and five times during the night. The day/night pairs allow us to look at this diel vertical migration behavior.

Deb Steinberg next to the MOCNESS frame. In this photo, you can see the bottom net is open, and you can see the mechanism that hold together the rest of the 9 nets until they are opened electronically. Credit: Chandler Countryman
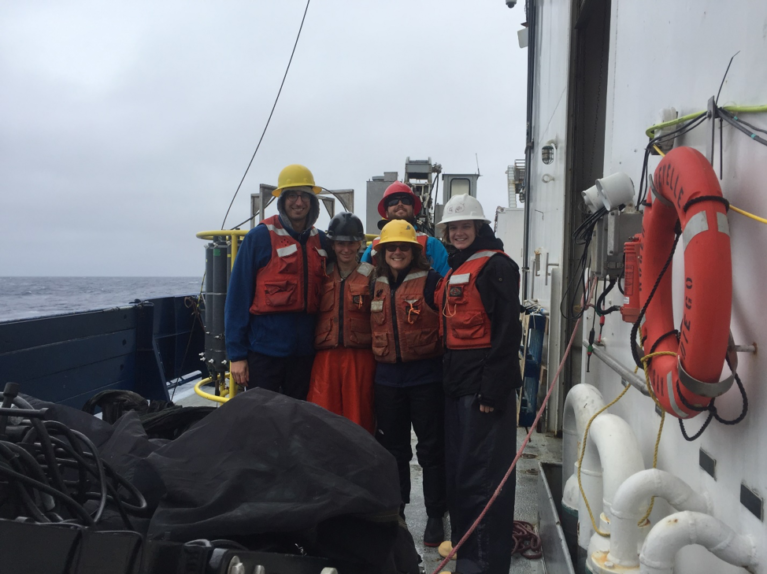
The Zooplankton Team getting ready to deploy the MOCNESS on deck (minus Joe, who runs the computer portion of the MOCNESS). From left to right: Andrea Miccoli, Karen Stamieszkin, Brendon Mendenhall (Restech), Deb Steinberg (Chief Scientist), and Chandler Countryman. Credit: Chandler Countryman

In addition to our beloved epipelagic (surface) and mesopelagic (intermediate depth) zooplankton species, we have also caught several neat, deep-sea animals.

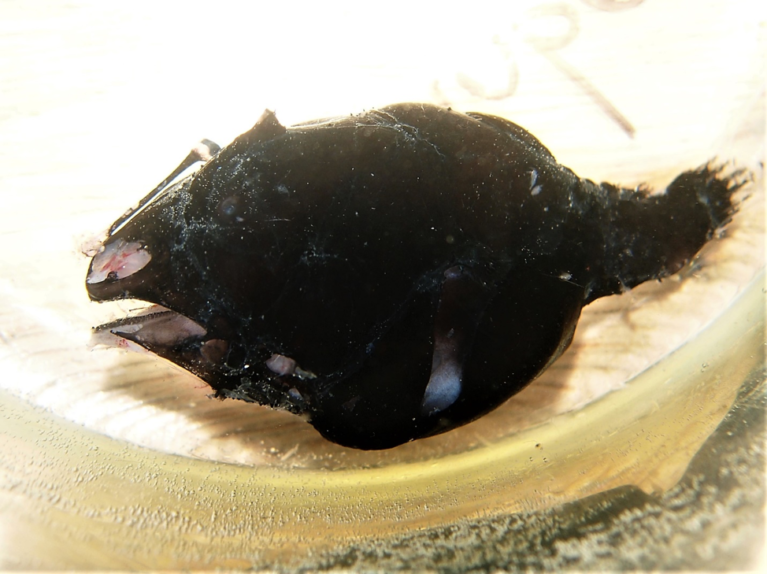
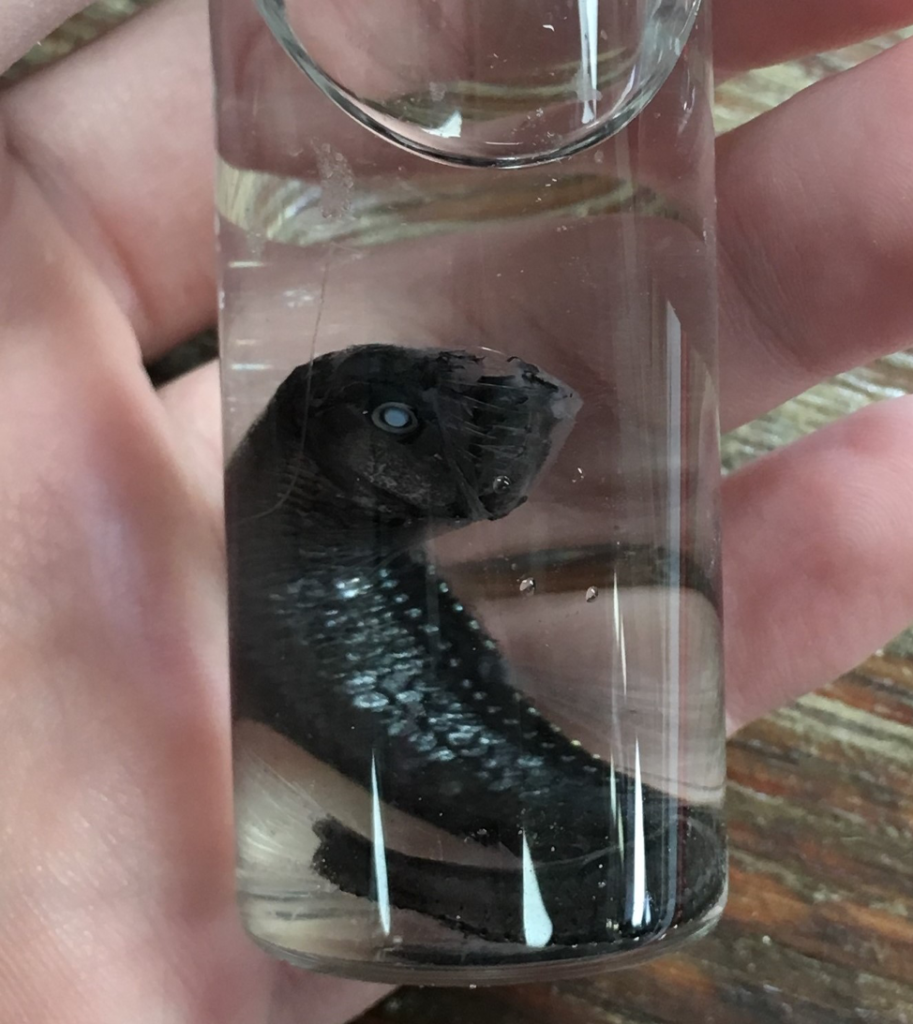
The Anglerfish

Common name: Spikehead dreamer, Scientific name: Bertella idiomorpha

A side view of the anglerfish. You can see her lure and her small, black beady eye. Credit: Chandler Countryman

This beautiful fish was caught in our net that stays open from 0-1000 meters, so the exact depth in which it was caught is unknown. In general, this species of anglerfish can be found anywhere between 805 meters and 3475 meters deep.

Most anglerfish are quite small and the maximum length recorded for this species is 10.2 cm (SL). It is dark-grey in color with a large head that has sharp teeth in its wide mouth. The most characteristic feature of this fish—and the reason for its name—is its lure (esca), which glows with the help of bioluminescent bacteria.

The lure attracts small animals like crustaceans and fish and is only found on females. The males are much smaller than the females and start out as free-swimmers until encountering a female, at which point they dig their teeth into the female, and inject enzymes that break down skin, fusing themselves into the female. Once the male is fused with the female, its bloodstream is actually connected to hers, and then the males loses all organs except for his testes.

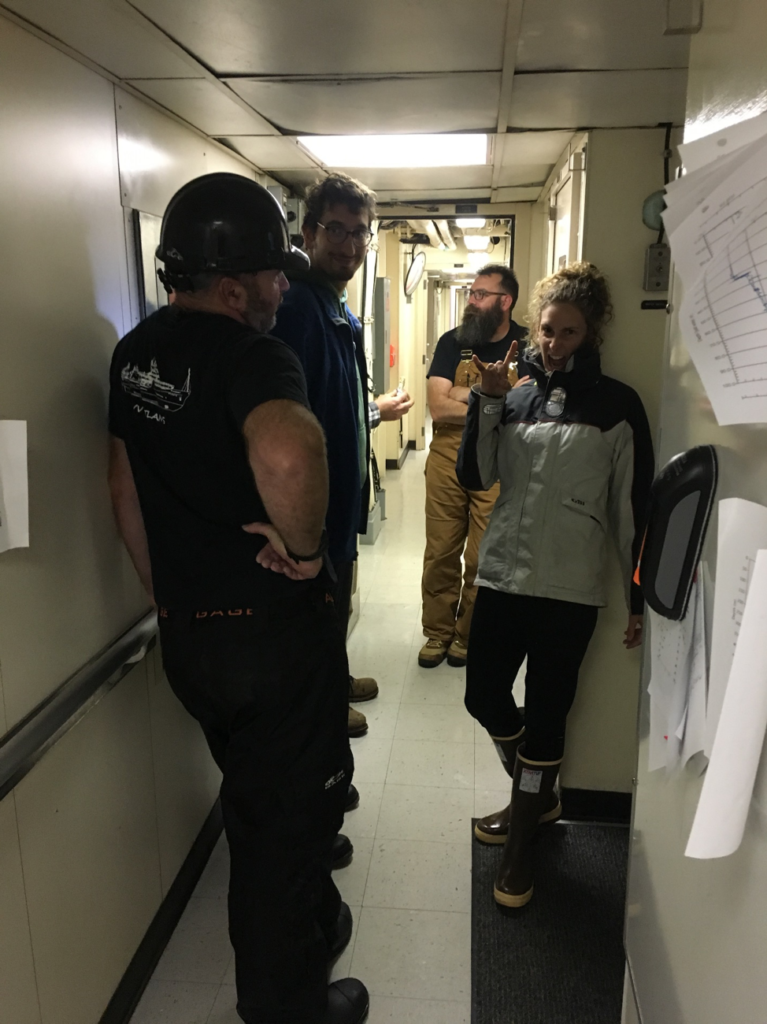
Scientists waiting in line to go into the bathroom and look at the glowing lure. The bathroom has no windows and is therefore perfect for this. Credit: Chandler Countryman

This form of symbiosis is considered an adaptation to the low encounter rate experienced between individuals in the deep sea. The male gets nutrition from the female, and in return the female has available sperm for multiple spawning events.

The female that we caught was still alive when she was brought on deck and we were able to film her swimming for a bit and to see the glow of her lure by going into a dark room—which in this case was the bathroom.

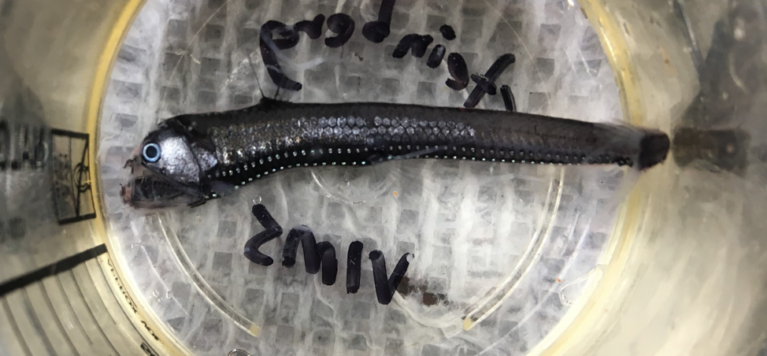
The Viperfish

Common name: Pacific viperfish, Scientific name: Chauliodus macouni

Viperfish caught in the MOCNESS. Notice its photophores running along the side. Credit: Chandler Countryman

This gnarly-looking predatory fish is a vertical migrator that lives between 200 and 5000 meters deep during the day and swims up to less than 200 meters at night to feed. This species can reach a length of about 30 centimeters (1 foot) and is black/dark brown in color with photophores along its side, which are thought to be used as camouflage from predation below them in the water by making them blend in with the light from above. It is also possible that these photophores can attract prey or be used in mating.

An up-close photo of the large, translucent teeth. Credit: Chandler

The most striking feature of the viperfish is its teeth, which are so large that they can’t fit inside its mouth and instead curve up towards the eye. Instead of being used for chewing, these teeth are used to impale its prey by swimming into it at fast speeds. The viperfish mostly eats crustaceans, arrow worms, and small fish. It has several adaptations to survive a low prey encounter rate in the deep ocean, including a hinged skull that allows it to swallow large prey, a large stomach that allows it to stock up on prey while it is abundant, and a low metabolic rate, which allows it to go several days without food.

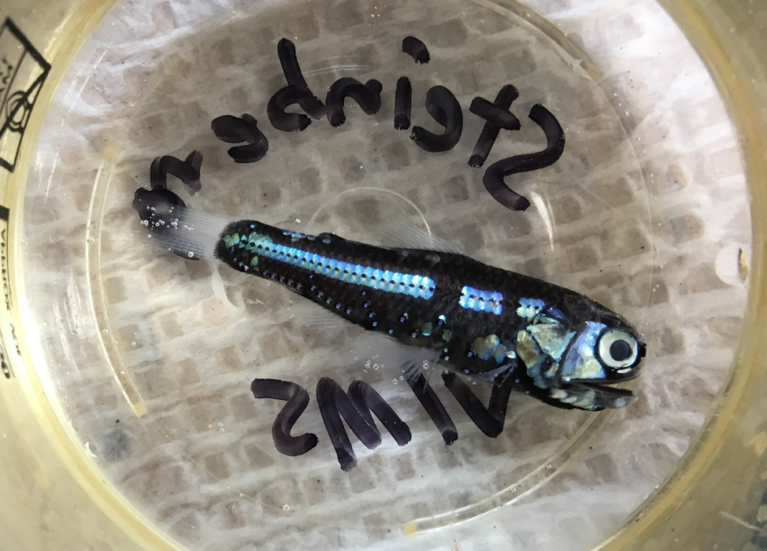
The Lanternfish

Common name: Lanternfish, Scientific name: Family Myctophidae

Lanternfish caught in the MOCNESS. Credit: Chandler Countryman

Myctophids are very common in the world’s oceans and can make up to 65 percent of the fish biomass in the deep sea. Most lanternfish are smaller than 15 centimeters (5.9 inches) and are diel vertical migrators that live between 300 and 1500 meters during the day and swim up to between 10 and 100 meters during the night to avoid predators and also to follow their food source, which consists mostly of vertically migrating zooplankton. These fish also possess photophores along their body, which can be used for camouflage just like the ones found on the viperfish. However, the photophores in lanternfish differ greatly between species, which indicates that it may also be used for communication and mating.

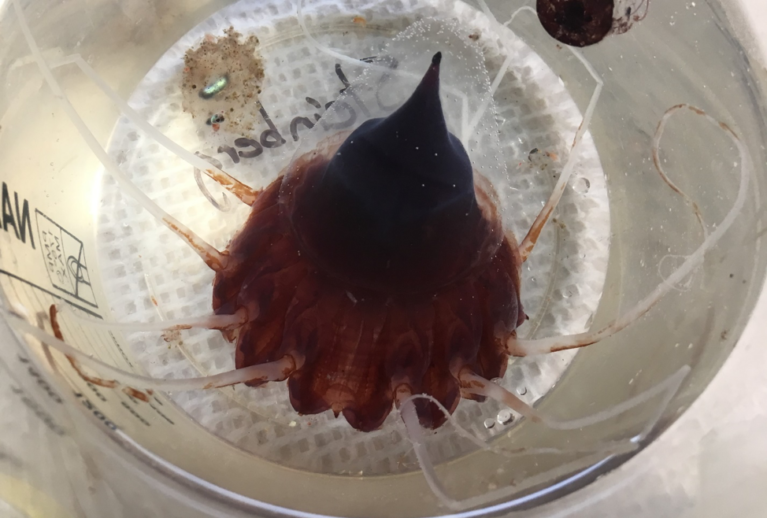
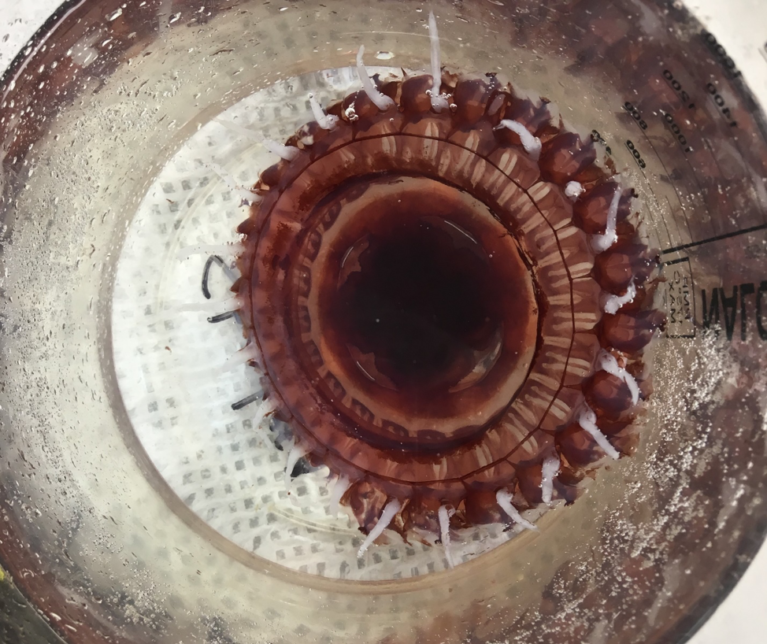
The Helmet Jelly

Common name: Helmet jellyfish, Scientific name: Periphylla periphylla

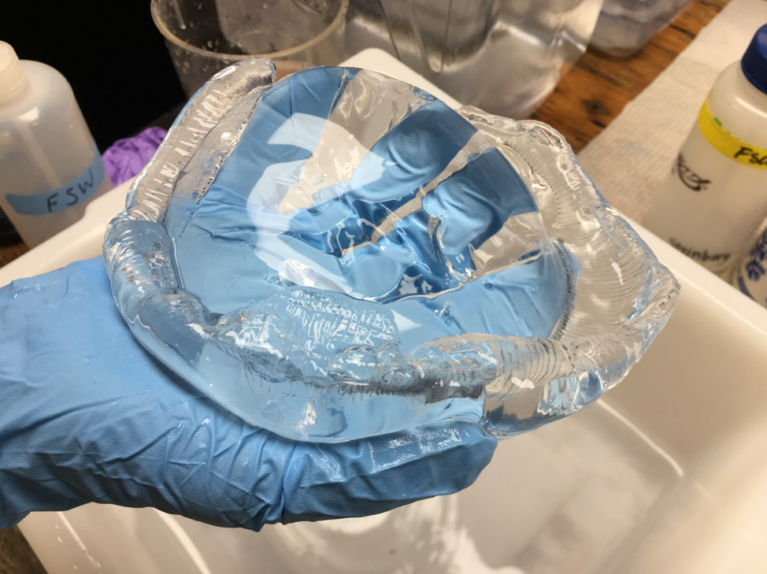
Periphylla jellyfish in a beaker. Look closely and you can see the clear “helmet.” Credit: Chandler Countryman

This deep-sea jelly is a vertical migrator that can be found between 500 and 1000 meters and avoids too much light because its red-brown pigment becomes lethal with light exposure. The umbrella can be up to 35 centimeters (~14 inches) in height and 25 centimeters (~10 inches) in diameter and is completely clear, showing the red/orange stomach inside of it. It has 12 orange tentacles that can be more than 50 centimeters (~20 inches) long, which have stinging cells on them to attack their prey. This jellyfish can actually use bioluminescence to produce flashes of bright light in order to protect itself from predation by confusing its predators. A helmet jelly’s body is 90 percent water.

Other neat critters

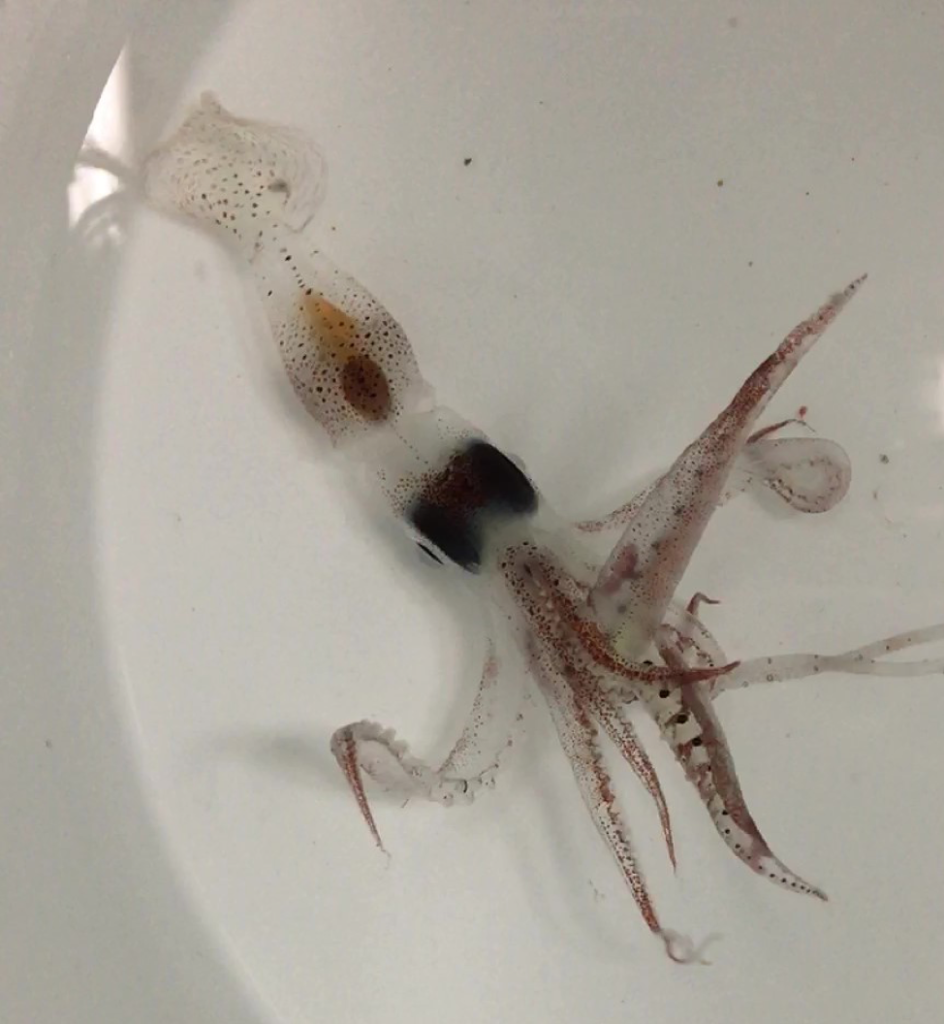
We have caught many more creatures including deep-sea shrimp, other jellies, squid, ctenophores and many more!

Large deep-sea jellies caught in the MOCNESS. Credit: Chandler Countryman
Squid caught in the MOCNESS. Credit: Chandler Countryman

“We Came Here to Work”: OMG in the Field

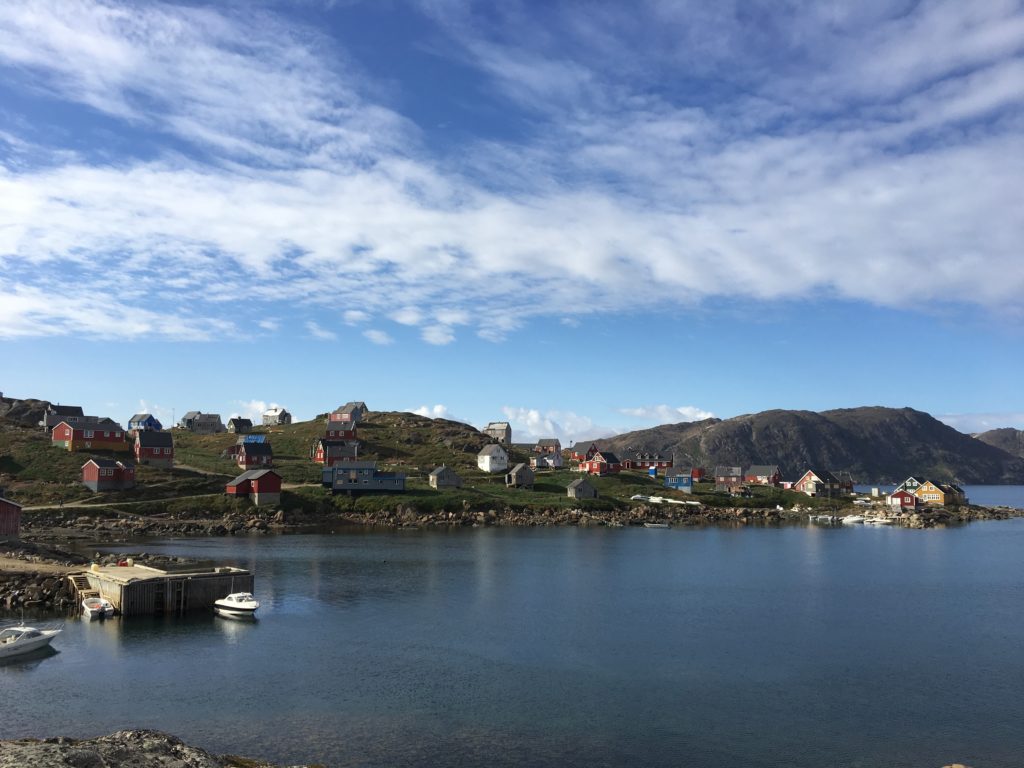
Kulusuk, Greenland. Credit: NASA/JPL-Caltech
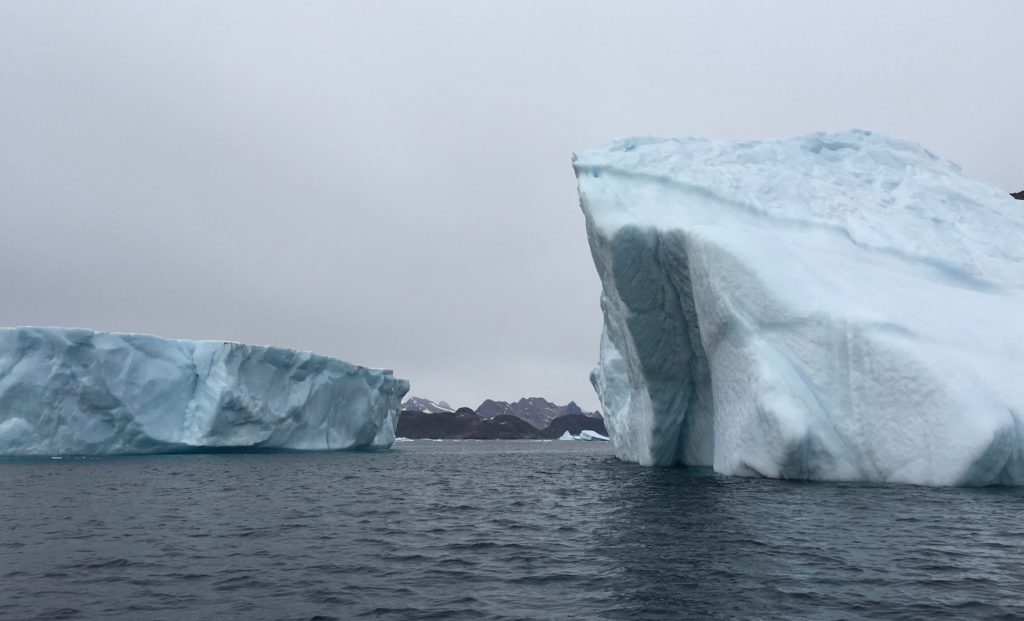
Iceberg off the coast of Greenland. Credit: NASA/JPL-Caltech
Iceberg, Greenland. Credit: NASA/JPL-Caltech
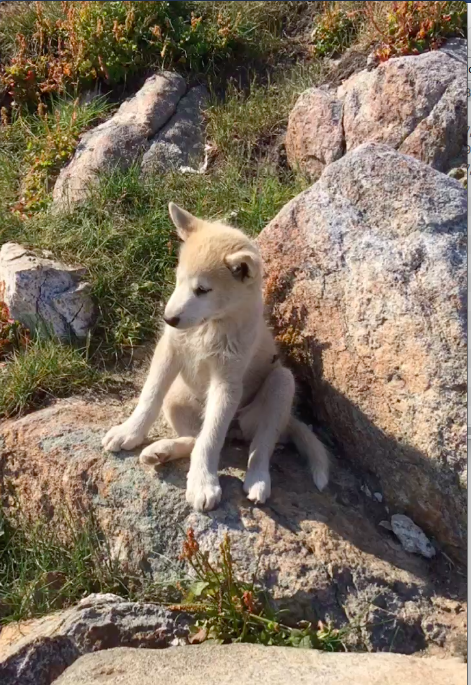
Sled puppy, Greenland. Credit: NASA/JPL-Caltech
Sled dog puppy, Greenland. Credit: NASA/JPL-Caltech

By Carol Rasmussen / KULUSUK, GREENLAND /

Kulusuk Island is breathtakingly beautiful — a spectacular mountain backdrop, quaint village, turquoise icebergs, even adorable sled-dog puppies. But Oceans Melting Greenland Project Manager Steve Dinardo didn’t choose it as a base because of the scenery. “We came here to work,” he says.

Kulusuk is ideally located for surveying East Greenland, which the locals call the wild side of the island — even more remote and unpopulated than the west coast. But the weather changes quickly, and the little airport doesn’t have a hangar to protect the research plane. If you have any trouble here, you could be stuck for quite a while. Every day in the field is expensive, and winter is just around the corner.

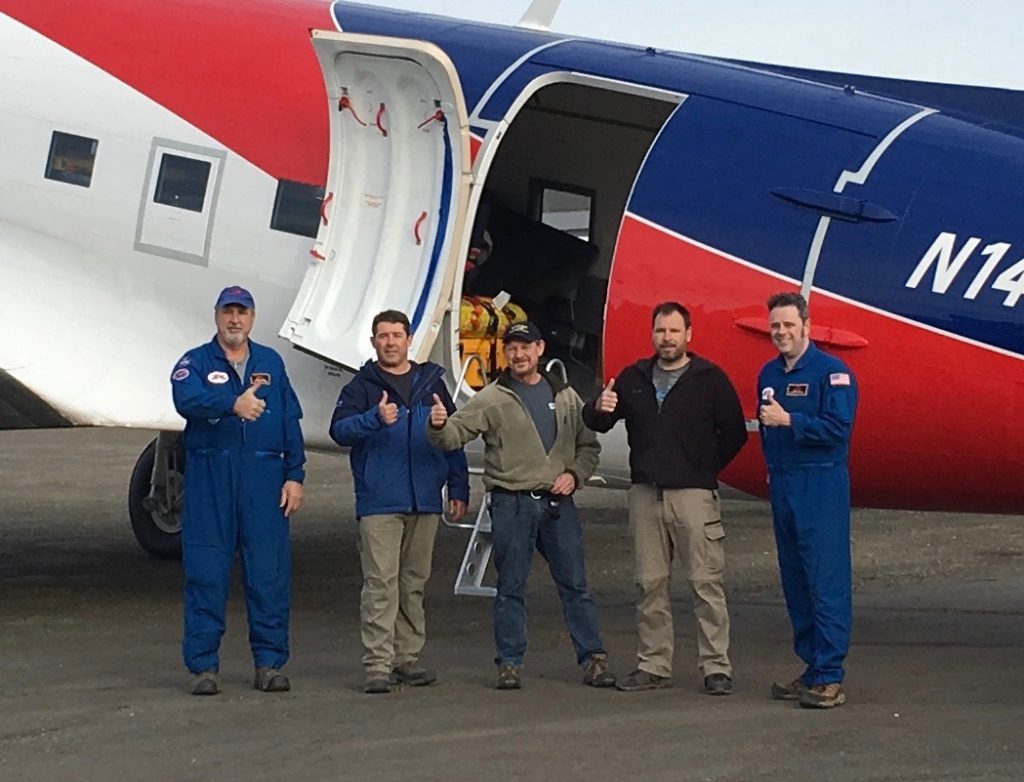
So the five OMG team members push themselves to get as much done as possible each day.

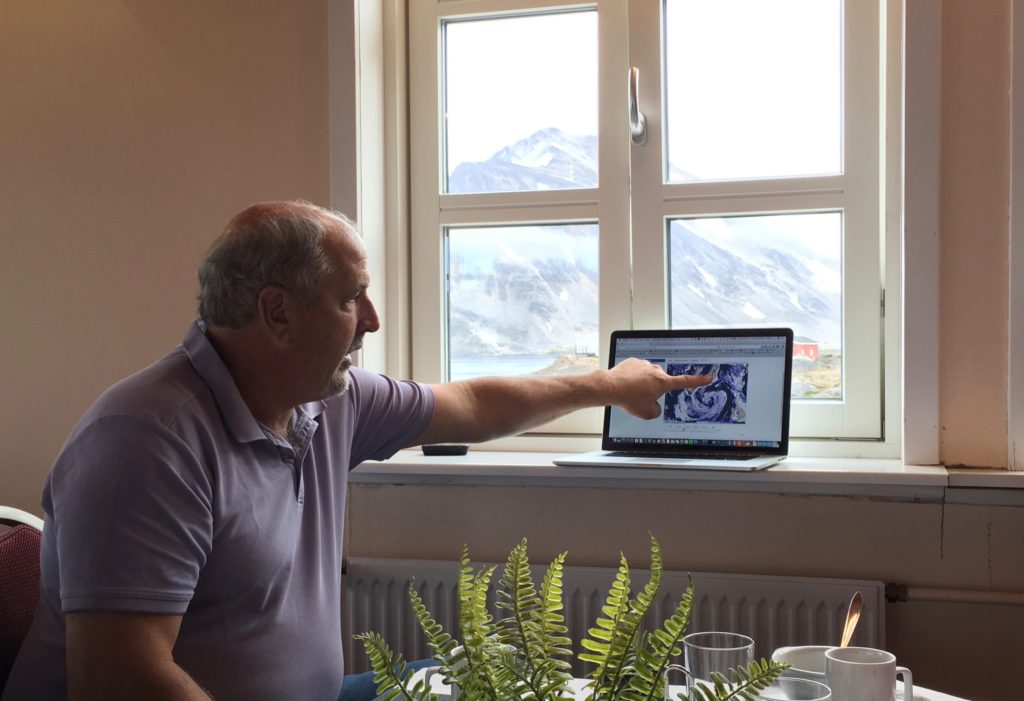
To begin with, they fly as many hours as they legally can to collect data. After the plane lands, there are still hours of work ahead. The plane is fueled and checked over for the next flight, Steve looks at multiple weather forecasting models to create a forecast for Kulusuk and the probe-drop areas, and Principal Investigator Josh Willis comes up with science priorities to match the weather. Both may end up revising their plans multiple times before the next morning’s fly/no fly decision.

Left to right: Steve Dinardo (NASA's Jet Propulsion Laboratory), OMG project manager; Scott Farley and Andy Ferguson (Airtec, Inc.), pilots; Glenn Warren (Airtec, Inc.), aircraft engineer; Josh Willis (JPL), OMG principal investigator. Credit: NASA/JPL-Caltech
Left to right: Steve Dinardo (NASA’s Jet Propulsion Laboratory), OMG project manager; Scott Farley and Andy Ferguson (Airtec, Inc.), pilots; Glenn Warren (Airtec, Inc.), aircraft engineer; Josh Willis (JPL), OMG principal investigator. Credit: NASA/JPL-Caltech

Add to this list trying to stay in touch with family at home, answering a few pressing emails, eating, showering and so on. No wonder that some days, the team gets no more than a few glimpses of the incredible landscape out of plane and hotel windows.

“It’s more of an adventure in retrospect,” Josh summarized. “While you’re there, you have your head down and you’re working as hard as you can. When you get a day off, you sleep.”

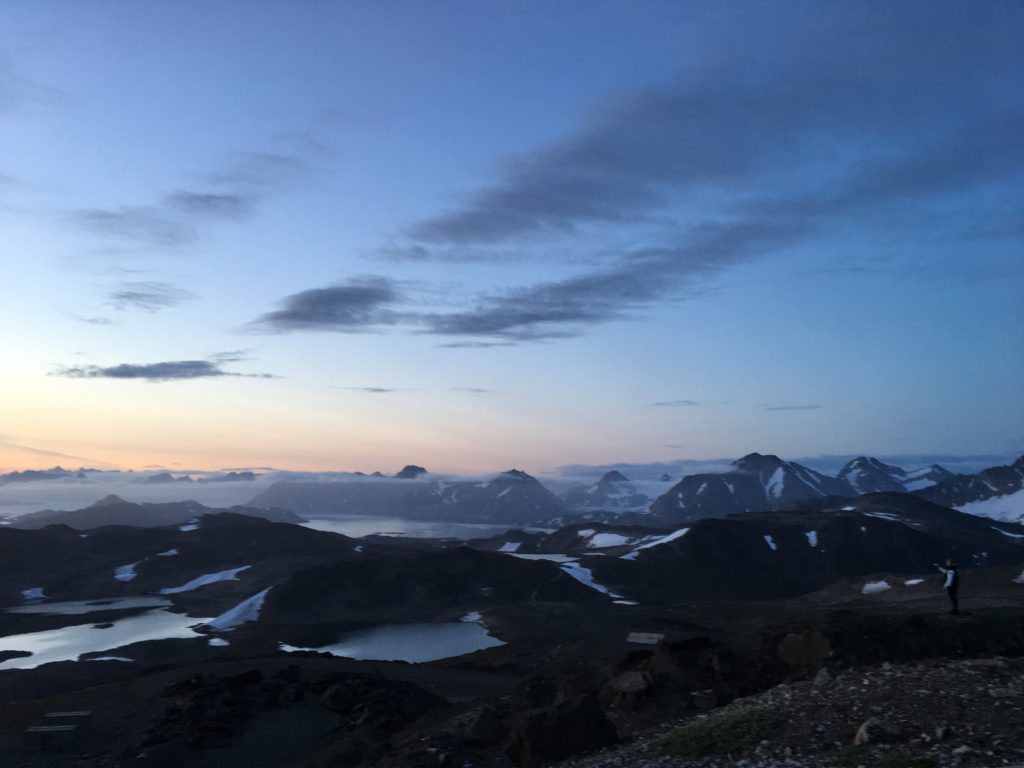
The team has already had the one mandatory day off that it will get in Kulusuk. As far as I could tell, everyone filled it almost as full as the work days. At dinner, several team members did mention a nap, but they also spent some of their precious free time out in the Arctic landscape. Jakob Ipsen, manager of the Hotel Kulusuk, found a villager to take senior pilot Andy Ferguson fishing and another who took four of us to see a nearby glacier. Later, Jakob drove a few team members to the highest point on the island to watch the sunset.

Sunset over Kulusuk, Greenland. Credit: NASA/JPL-Caltech

The next morning, it was back to business. Steve gave a favorable weather forecast at 7 a.m., and the team took off for another eight-hour research flight about an hour later. They flew north to Scoresby Sund and dropped another 10 probes in key fjords, for a total of 99 drops in five days. Only 150 more to go.

Steve Dinardo gives the weather forecast during breakfast each morning. Credit: NASA/JPL-Caltech

The Inner Space of the Subarctic Pacific Ocean

 Instead of stars, this is an image of marine bacteria and flagellates, a swimming microscopic organism in the shape of a whip. Credit: Craig Carlson
Instead of stars, this is an image of marine bacteria and flagellates, a swimming microscopic organism in the shape of a whip. Credit: Craig Carlson

By Craig Carlson and Brandon Stephens / NORTHEAST PACIFIC OCEAN /

Brandon Stephens is a post-doc fellow working with Craig Carlson, a professor at the University of California Santa Barbara’s Marine Science Institute. Their research focuses on the role marine microbes play in the cycling of elements through oceanic dissolved organic matter, which in turn plays a role in the fate of carbon produced in the ocean. They are working aboard the R/V Roger Revelle for the EXPORTS field campaign.

When one thinks of a NASA mission, thoughts of outer space, stars and other astronomic bodies come to mind. The image above could easily be mistaken for one of stars and planets or a nearby galaxy in deep space captured by the Hubble Space Telescope. But really, it’s microscopic life in the ocean.

With the EXPORTS mission, NASA turns it focus, quite literally, from outer space to Earth’s inner space of the subarctic Pacific Ocean. Using ocean optical sensors, microscopes and molecular tools (rather than telescopes), scientists on board the Research Vessel Roger Revelle have been examining microbial life hundreds to thousands of meters below the ocean’s surface.

R/V Roger Revelle left Seattle on Aug. 10, 2018. The ship will follow the R/V Sally Ride to the open ocean, where they will conduct complementary research at sea. Credits: NASA/Michael Starobin

The microbes that make up the “constellations” represent the some of the Earth’s most abundant organisms: marine bacterioplankton. There are several hundred thousand to one million bacteria in every drop (one milliliter) of ocean water. When scaled to the total volume of the ocean (i.e. ~ 1.5 billion km3), there are approximately 120,000,000,000,000,000,000,000,000,000 (1.2 x 1029) bacterioplankton cells in the global ocean, or ~ 95% of the all the living biomass in the sea. In other words, the total marine bacterioplankton biomass is greater than all of the ocean’s zooplankton, shellfish, fish and whales summed together.

The majority of this unseen marine bacterioplankton grow very fast, dividing every couple of days. To meet their metabolic demands, bacterioplankton must consume vast amounts of organic compounds like carbohydrates and proteins and recycle inorganic nutrients like carbon dioxide, nitrate and phosphate every day. Though each of these microbes live on the timescales of days and work on spatial scales of nanometers (a billionth of a meter), their sheer numbers and high growth rates mean they affect ocean chemistry on the scales of ecosystems. These marine microbes are the true drivers of large scale biogeochemical cycles in oceanic systems as we are witnessing in the subarctic Pacific Ocean.

With EXPORTS, we are examining the intricate mechanisms of the oceanic biological “carbon pump”. The carbon pump describes how photosynthically fixed carbon (usually from atmospheric carbon dioxide that has dissolved in the ocean) is processed and reprocessed through the ocean’s planktonic food web in the surface layers of the ocean. Ultimately a portion of the carbon is exported out of the suface by sinking and mixing to the deep ocean hundreds to thousands of meters below.

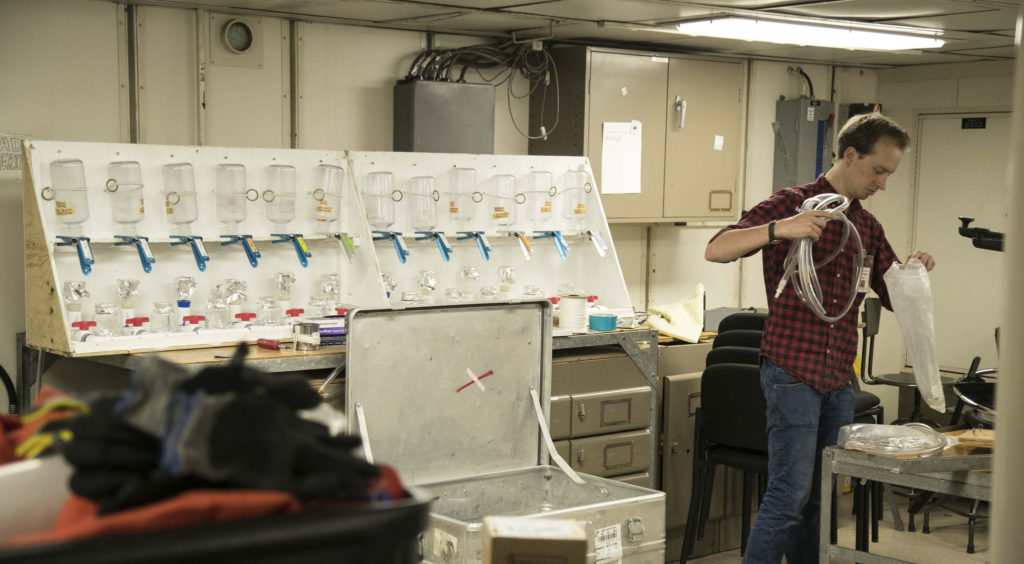
This filtration system allows the EXPORTS science team to test multiple water samples. The campaign is making detailed measurements of phytoplankton and other material found at various depths of the open ocean. Credits: NASA/Michael Starobin

How exactly the ocean absorbs and retains carbon largely depends in part on the growth of microbes but also where in the water column (between the ocean surface and abyss) they intercept and consume sinking organic particles or dissolved organic matter. For carbon, and other associated elements, to be stored for long periods of time in the ocean, it first must travese the portion of the ocean’s water column that extends between ~one hundred and one thousand meter depths. This zone is referred to by oceanographers as the ocean’s twilight zone. The twilight zone is so named not only because there is little to no light but also because the chemical budgets and biological processes that occur in this zone are not well understood. If microbes recycle the organic matter too close to the surface, the carbon escapes long-term storage. But if the sinking or mixed organic matter gets deep enough, then that carbon is removed from interaction with the atmosphere for decades to millennia.

Our project is designed to investigate marine microbes and their interaction with organic compounds throughout the water column of the subarctic Pacific Ocean. We are conducting experiments at sea that combine tools from ecology, molecular biology, and marine chemistry to investigate how bacterioplankton consume the organic substrates available to them. By examining microbial behavior, we will learn more about how the ocean’s “inner space” functions and how biology helps govern the movement of carbon within Earth’s systems.


A Majestic Glacier on OMG’s Return to Greenland

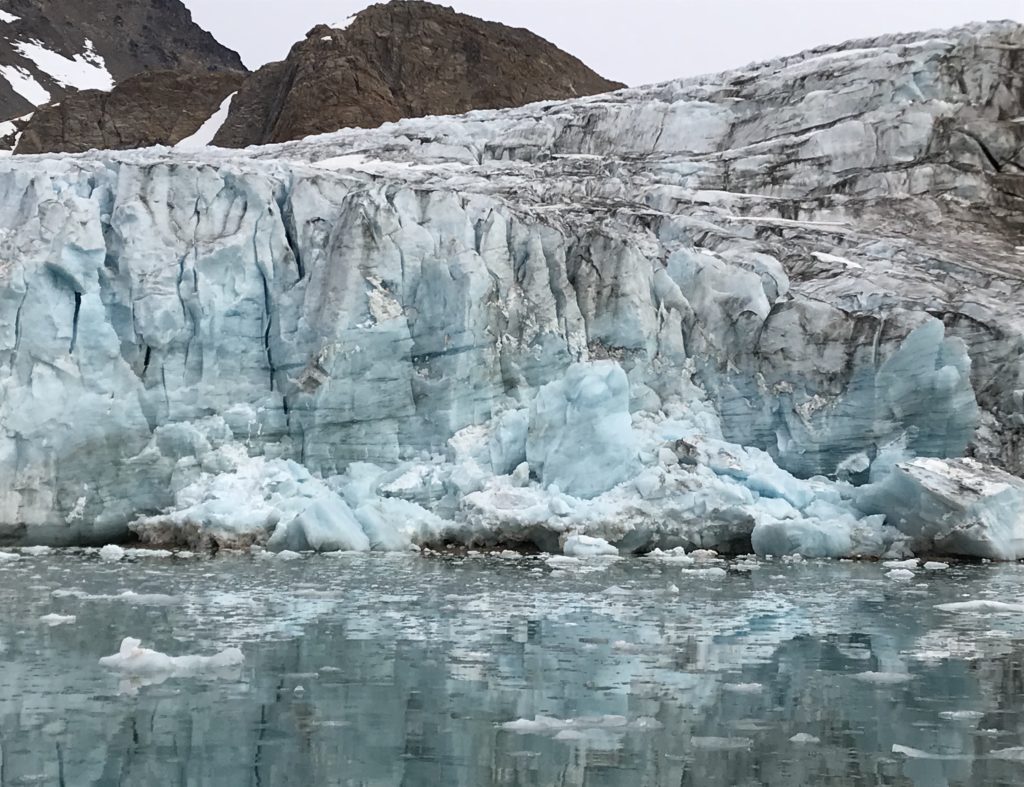
Apusiaajik Glacier near Kulusuk, Greenland. Credit NASA/JPL-Caltech

by Carol Rasmussen / KULUSUK, GREENLAND /

“Incredibly majestic.”

After years of intensive research on Greenland’s glaciers, Josh Willis is standing next to one for the first time in his life. Apusiaajik isn’t one of Greenland’s giants — in fact, its name means “little glacier.” But its marbled blue-and-white wall of ice is tall, long and, as Willis says, majestic.

It’s also melting. From time to time there’s a loud cracking noise, and seconds later, a few refrigerator-sized chunks of ice drop into the ocean. You can’t help wondering when a larger chunk will fall, and how much icy water will hit you when it does. It’s natural for glaciers to lose ice this way, though disconcerting when you’re in the neighborhood. But Apusiaajik is like most of Greenland’s glaciers, it’s out of balance — melting faster than it can be replenished by winter snowfall.

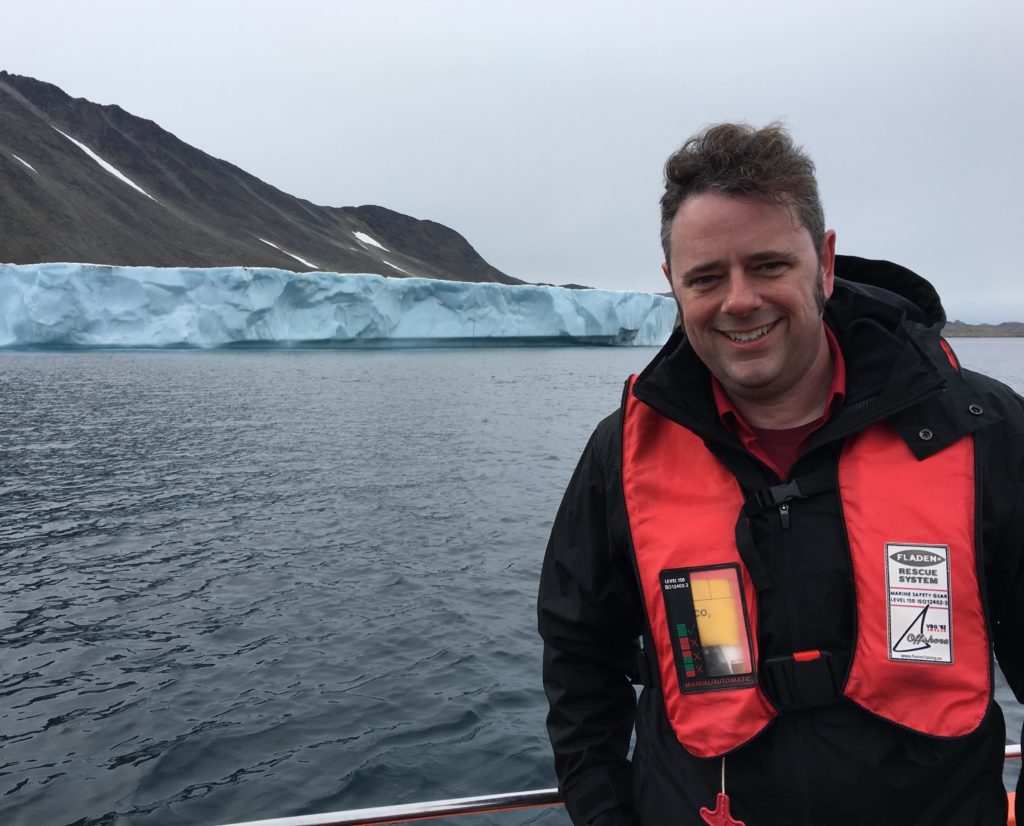
Josh Willis, OMG’s principal investigator, on approachby boat to Apusiaajik glacier in Greenland. Credit NASA/JPL-Caltech
Josh Willis, OMG’s principal investigator, on approach by boat to Apusiaajik glacier in Greenland. Credit NASA/JPL-Caltech

We’re visiting the little glacier on a down day for NASA’s Oceans Melting Greenland (OMG) campaign. It’s close to Kulusuk, a tiny village on Greenland’s east coast that happens to have an airport with a 4,000-foot-long gravel runway. That’s too short for a big jet to take off and land. But for OMG’s converted DC-3, the Kulusuk airport is perfectly located for the mission’s survey flights around southeastern Greenland, studying how ocean water is affecting glaciers like Apusiaajik.

OMG is on its third annual campaign out of a planned five. The goal each year is to blanket Greenland’s continental shelf with probes measuring the seawater’s temperature and salinity. This year, the team has already dropped 89 out of 250 probes, starting at the southern tip of Greenland and working up the east coast. Soon it’ll be time to move north to the next base.

Josh Willis after releasing an ocean probe down the white tube, where it drops from the plane into the ocean. Credit NASA/JPL-Caltech

Halfway through OMG’s expected lifespan, what have scientists learned, and what do they still hope to find out?

“We’re beginning to see the signs of long-term changes on Greenland’s continental shelf — changes that take years to happen,” Willis says. “We’ve never seen that before.” Daily changes in water temperature come and go, but the OMG scientists are finding that glaciers react more strongly to slow changes in water temperature far below the ocean surface.

Greenland’s continental shelf is shallow, averaging about 1,600 feet (500 meters) deep. But it’s gashed by troughs carved by ancient glaciers, which can be two times deeper than that. These troughs are natural conduits for deep water to get up on the shelf, but it’s not an easy passage. Sills and underwater mountains within the troughs impede the flow and create basins.

Willis gestures at the ice-flecked channel flowing past Apusiaajik. “In a couple of weeks, all this water will be way downstream,” he says. “In the troughs and basins on the shelf, that’s not true. They’re almost like tide pools — the water comes in at high tide and stays there till the tide comes back. In those deep basins, instead of twice per day like the tide, it’s more like once per year and sometimes less. And when warm or cold water gets in, it stays for years.” There’s not always enough variation in the seawater from winter or summer for water to get into the basins each year; it may take a change in a large-scale ocean climate pattern, similar to an El Niño event in the Pacific Ocean, to trigger the change.

For the last two years, the North Atlantic has been moving into a naturally cooler climate phase. Willis is eager to see when and how far the cooler water will move up the West Greenland coast, and how long it will last.

Answering those questions will chip away at the big remaining goal of OMG: quantifying how much glacial ice melt will result from any given change in ocean temperature. If water comes onto the continental shelf that’s a degree Celsius warmer than now, how much will the melt rate increase? What about three degrees?

Ice-filled channel in front of Apusiaajik Glacier. The surface ocean layer is much colder than the deep water below. Credit NASA/JPL-Caltech

“One of the advantages of watching a glacier change year after year after year is that you begin to get an idea of what’s driving the change. If it’s the ocean, I think we’ll be able to quantify that with two more years of OMG data,” Willis says.

“That’s what we set out to do. What I’m really excited about is that it’s beginning to happen.”