Even in Science,There's More than One Side to Every Story

Every tale has more than one side or perspective. And so it is with NASA, which studies Earth science from different angles – from satellites, from aircraft, and sometimes from the ground. But somehow, no matter how many ways there are to view a place, there’s nothing better than being there.

Case in point: Bryce Canyon National Park in Utah. The interlocking peaks of the canyon rim can top 9,000 feet – high enough that year-round flurries created this snow-capped winter wonderland captured by photographer James Van Gundy. The spectacular oranges, browns, reds, and yellows of the limestone and the unique rain- and frost-carved stone make the park a destination for more than 1.5 million tourists each year.

Those peaks offer breathtaking views of three states and 200 miles of visibility.

In contrast, a Landsat satellite image of the park, taken in 2006, tells a top-side story of streams and rivers and valleys that stretch out like the fingers of a child’s hand print. A host of new colors emerge, not apparent from the ground view. The greens of coniferous forests. The blues of lakes and the Tropic Reservoir.

To see more Web images from Earth Science Picture of the Day, click here.

To see more examples of the Image of the Day from NASA’s Earth Observatory, click here.

– Gretchen Cook-Anderson, NASA’s Earth Science News Team

A Revolutionary Way to Observe Earth


Engineers watch a quarter scale model of a wing-like guidance system that could be used to steer a new type of Earth-observing balloon.  

Science tends to be a conservative profession. Only rarely are “discoveries” made or paradigms upended. And most researchers spend entire careers working toward incremental advances in understanding rather than dreaming up radical new ways to tackle a problem.

So it’s not often that you’ll find the word “revolutionary” in the pages of a peer-reviewed scientific journal. Yet, that’s precisely the word that a group of earth scientists and balloon boosters use liberally in a Bulletin of the American Meteorological Society article describing the experimental balloon platform that NASA-funded scientists and engineers have dreamed up.

They’re called StratoSats and, according to advocates like Warren Wiscombe, a senior scientist at NASA’s Goddard Space Flight Center who studies Earth’s energy budget, the long-duration balloons would cruise on the cusp of space far above airplane traffic. From high in the stratosphere, these super-pressure balloons could collect key data on Earth’s energy budget, climate, magnetic field, and atmospheric water vapor for a tiny fraction of the cost of competing technologies, such as unmanned aerial vehicles or satellites. 

Advocates for StratoSats envision hundreds floating in the stratosphere. Constellations of the balloons could be organized to suit the needs of scientists, from “string of pearl” formations that keep a hurricane constantly in view to more or less uniformly distributed formations – as shown in the simulation below (each yellow dot represents a StratoSat).
 
With the uniform distribution, Wiscombe says, the StratoSats could survey over 99 percent of the atmosphere both vertically and horizontally and cover certain areas near the poles that aren’t
readily detectable by satellite instruments in sun-synchronous orbits. The StratoSats would be able to ride strong zonal winds that would push them around the Earth every 10 to 20 days. 

One nagging drawback of research balloons is that they drift with the winds, which can make it difficult to collect usable data. However, the StratoSats would have a 15-kilometer tether toting a 5-meter wing far below. The wing would function much like the sail of a sailboat, and give scientists the means to keep the balloons on a set course. “Steering a StratoSat is somewhat like steering a cruise ship,” Wiscombe said. “You can’t make sharp turns, but you can achieve a new course within a few days.”

For the last ten years, NASA has been developing ultra-long-duration balloons (ULDB) that aim to study remnants of the early universe. Though some of these stratosphere capable balloons have failed to deploy completely during tests, NASA’s Balloon Program, based at Wallops Flight Facility in Virginia, has carried out a successful 54-day flight of a small Super Pressured Balloon.

Meanwhile, full-scale mechanical prototypes of the StratoSat guidance system have already been built and ground-tested. And NASA-funded engineers have successfully flown one-quarter scale balloon guidance systems (below) from blimps, Wiscombe said.

StratoSat boosters may not have too much longer to wait. According to David Pierce, the Chief of NASA’s Balloon Program, his team is already well on its way to providing the sort of capabilities that StratoSats would require.

“There is still some engineering development that must be accomplished to fully integrate the small super-pressure balloons with the StratoSat sail, but you can expect the smaller super-pressure balloons to be available within the next year for Earth science missions,” he noted. “We are quite confident that StratoSats could do a lot of science at much less cost than orbiting satellites.”


Image Information: The second image is an illustration of the StratoSat platform. The third is a map that shows the potential formation of a fleet of StratoSats (each yellow dot represents one StratoSat). All three images were published in the Bulletin of the American Meteorological Society without crediting information. The corresponding author of the paper, which is available here, is Kerry Kock. 

— Adam Voiland, NASA’s Earth Science News Team

Let There be Light

An early morning sun illuminated the light rain over Nevada, Missouri, on May 14, 2009, spraying rays across the sky. Photographer Tommy Hornbeck captured what some viewers may believe to be virga, rain that evaporates before reaching the surface. However, Jim Foster, a hydrologist at NASA’s Goddard Space Flight Center, confirmed with Hornbeck that the rain did indeed dampen the ground and the photographer below. 

The Earth Science Picture of the Day, a web site led by Foster, has received and posted hundreds of captivating images like this one. The site, which marks its 10th anniversary this year, showcases imagery of people who want to share what they observe; photographs that illustrate the marvels and nuances of Earth and our relationship to it. Sun bounces off rain drops. Bright-colored insects take temporary refuge on plant leaves. Ocean mist changes the look of the air where it hangs suspended. You get the idea.  

With support from the Universities Space Research Association and NASA, Foster’s longtime project to educate and engage the public about Earth science has made as many as 3,600 images available online for science enthusiasts.

Want to submit an image to Earth Science Picture of the Day? Click here to learn more. Keep in mind that the images must be your own, and you’ll also need to provide permission for Foster’s team to post them to the site. Good luck!

 — Gretchen Cook-Anderson, NASA’s Earth Science News Team

Sea level isn't really level at all

Our friends at NASA’s Global Climate Change site have a great blog post today that we’d like to share. The message is simple yet critical: rising sea levels do not and will not mean the same thing everywhere on the planet. Oceanographer Josh Willis of the Jet Propulsion Laboratory puts it this way:

Even though it’s sometimes convenient to think of the ocean as a great big bathtub, where turning on the tap at one end raises the water level in the whole tub, real sea level rise doesn’t quite happen that way. To understand why, you first have to realize that ‘sea level’ isn’t really level at all.

There are lots of reasons why the oceans are not level. For example, vast ocean currents like the Gulf Stream in the Atlantic Ocean and the Kuroshio in the Pacific actually reshape the ocean surface, causing it to tilt. As the planet heats up, changes in the prevailing winds (which drive most of these ocean currents) cause changes in the currents, reshaping our ocean and changing local sea level as a result.

Just as global warming does not raise land temperatures evenly, global ocean warming is not the same everywhere around the globe. Some regions of the oceans are heating up faster than others, and because warm water takes up more space than cold water, those regions experience faster sea level rise.

Finally, the water locked away in the great ice sheets of Greenland and Antarctica also shapes the ocean surface. As the ice sheets melt and lose water to the oceans, our entire planet feels the effects. The movement of mass from the ice sheets to the oceans very slightly shifts the direction of Earth’s rotation. This, along with changes in the gravitational pull of the ice sheets on the oceans, will reshape sea levels further still…

Click here to read the full posting from Josh. And be sure to check out the interactive sea level rise viewer. 

— Mike Carlowicz, Earth Science News Team

Can Something Out in Space be Good for Your Health on Earth?

An animation from Morain’s Center, viewable online by local residents, captured a storm crossing southeast Arizona and southwest New Mexico on Jan. 6-8, 2008. This clip, part of a 48-hour dust forecast, centers on the hour of peak dust concentration in the towns of Wilcox and Silver City. Credit: Morain/Earth Data Analysis Center

Stanley Morain is not an asthmatic. But like a lot of other healthy people, his lungs are sensitive to dust in the air in his hometown of Albuquerque. Dust makes him cough. It makes his eyes tear. It makes him pretty miserable.

Morain believed that if he — a healthy individual — is affected by the dust storms common to the American southwest, then hundreds of thousands of asthmatics must be affected far more severely when millions of tiny particles nestle into their respiratory systems.

His career has led him to a spot as director of the Earth Data Analysis Center at the University of New Mexico, where he has encouraged his colleagues and students to follow their hearts in the projects they pursue. He’s set the example by spending 10 years using NASA satellite data to create daily dust forecasts to improve health alerts.

I caught up with Morain a few days before he left for the American Meteorological Society’s annual meeting, where he gave a talk Tuesday about his work. He’s especially excited about decisions by the United Nations and the Joint Board of Geospatial Information Societies to publish his latest dust modeling work this spring.

WhatOnEarth: How did you decide to focus your career on using satellite sensors to improve public health?

Morain: The thought first struck me years ago, before I got my doctorate in biogeography and before I was awarded my first NASA research grant in 1964. I’ve always been fascinated by the geographic aspects of health even when I worked on NASA projects as dissimilar as lunar landers in the 1960s. I found we could combine information technology and modeling to learn more about health problems like heart attacks, Valley Fever, and hantavirus pulmonary syndrome that frequently strikes and kills young, otherwise healthy people within 24 hours.

WhatOnEarth: The Centers for Disease Control estimate 16.4 million adults and 7 million children in the U.S. suffer from asthma. How do your dust alerts help them?

Morain: Well, we’re not yet operational on a large-scale basis. That would take a commercial firm stepping in to make our alerts available nationwide. But, in my own backyard, the alerts are helping asthmatics plan for the worst days. Dust is a real problem here. When people know dust is headed their way, they can adapt their plans to minimize time outdoors or increase the dosage of some asthma medications. We’re making the alerts available, by way of summaries of dust and air quality conditions, to everyone from school nurses to TV news broadcasters to epidemiologists who are concerned about how long-term dust exposure affects the overall population.

WhatOnEarth: How do NASA satellites play into the development of the alerts?

Morain: There are environmental triggers for diseases like asthma. Very fine pollutant particles called aerosols are key examples of such triggers. NASA satellites like Terra and Aqua have instruments that can “see” the path dust takes. When you merge dust modeling information from the satellites with the National Weather Service weather forecasting model, you get a product that tells you when a weather event will bring dust along with it. The product becomes the basis for our daily dust alerts.

Three generations of model improvements for a dust storm across New Mexico and Texas on 15-16 December, 2003 illustrate (left) model performance before and (middle) after satellite data were included; and (right) the same storm modeled by the higher resolution, weather forecasting model Morain’s team uses. Credit: Morain/Earth Data Analysis Center

— Gretchen Cook-Anderson, NASA’s Earth Science News Team

Flying high with NASA's Joanne Simpson

Joanne Simpson, the first woman to earn a PhD in meteorology, didn’t just break into a field where women weren’t welcome. She broke the door down and accumulated a list of scientific achievements that’s rare for any scientist, regardless of gender.

Early in her career, she made the key insight that narrow cumulonimbus clouds–she called them “hot towers” — are the engines that drive tropical circulation and help sustain the eyes of hurricanes. Later, she became one of the first scientists to develop a cloud model, an advance that ultimately sparked a whole new branch of meteorology. She spent decades with NASA, helping to lead the Tropical Rainfall Measurement Mission, a satellite that’s led to key insights about how hurricanes start and how dust affects precipitation. And she was a key proponent for the upcoming Global Precipitation Measurement (GPM), the follow up satellite to TRMM.

No stranger to controversy, she stirred up a scientific furor when she sought to test the validity of her cloud model by experimenting with cloud seeding. Even well into her eighties, Simpson didn’t shy from vigorous debate about the scientific basis of global warming.

In March, at the age of 86, Simpson passed away in Washington, D.C. In a recent interview with the Discovery Channel, a producer asked her what was the most fascinating thing about studying the atmosphere. “In my case, it’s the clouds,” she said without hesitation. “There are some beautiful ones out there right now,” she said while gesturing toward the window.

In tribute to Simpson’s efforts to understand clouds, we’ve chosen four of our favorite cloud images from a series of images that Simpson donated to the NOAA Photo Library and likely took. The photographs were taken from NASA’s DC-8 during the TOGA-COARE project in the 1990s.

Joanne Simpson Portrait Information: Illustration by Martin Mueller of NRC and NASA GSFC via NASA’s Earth Observatory.


Puffy fair weather cumulus clouds and hints of reefs are visible below the right wing of NASA’s DC-8. Credit: NOAA Photo Library/Dr. Joanne Simpson Collection


A towering example of a showering anvil cloud roils over the Pacific Ocean. Credit: NOAA Photo Library/Dr. Joanne Simpson Collection


Dusk falls over the Pacific Ocean with a large cumulonimbus cloud in the distance. Credit: NOAA Photo Library/Dr. Joanne Simpson Collection

— Adam Voiland, NASA’s Earth Science News Team

Making a Splash with Satellite Hydrology

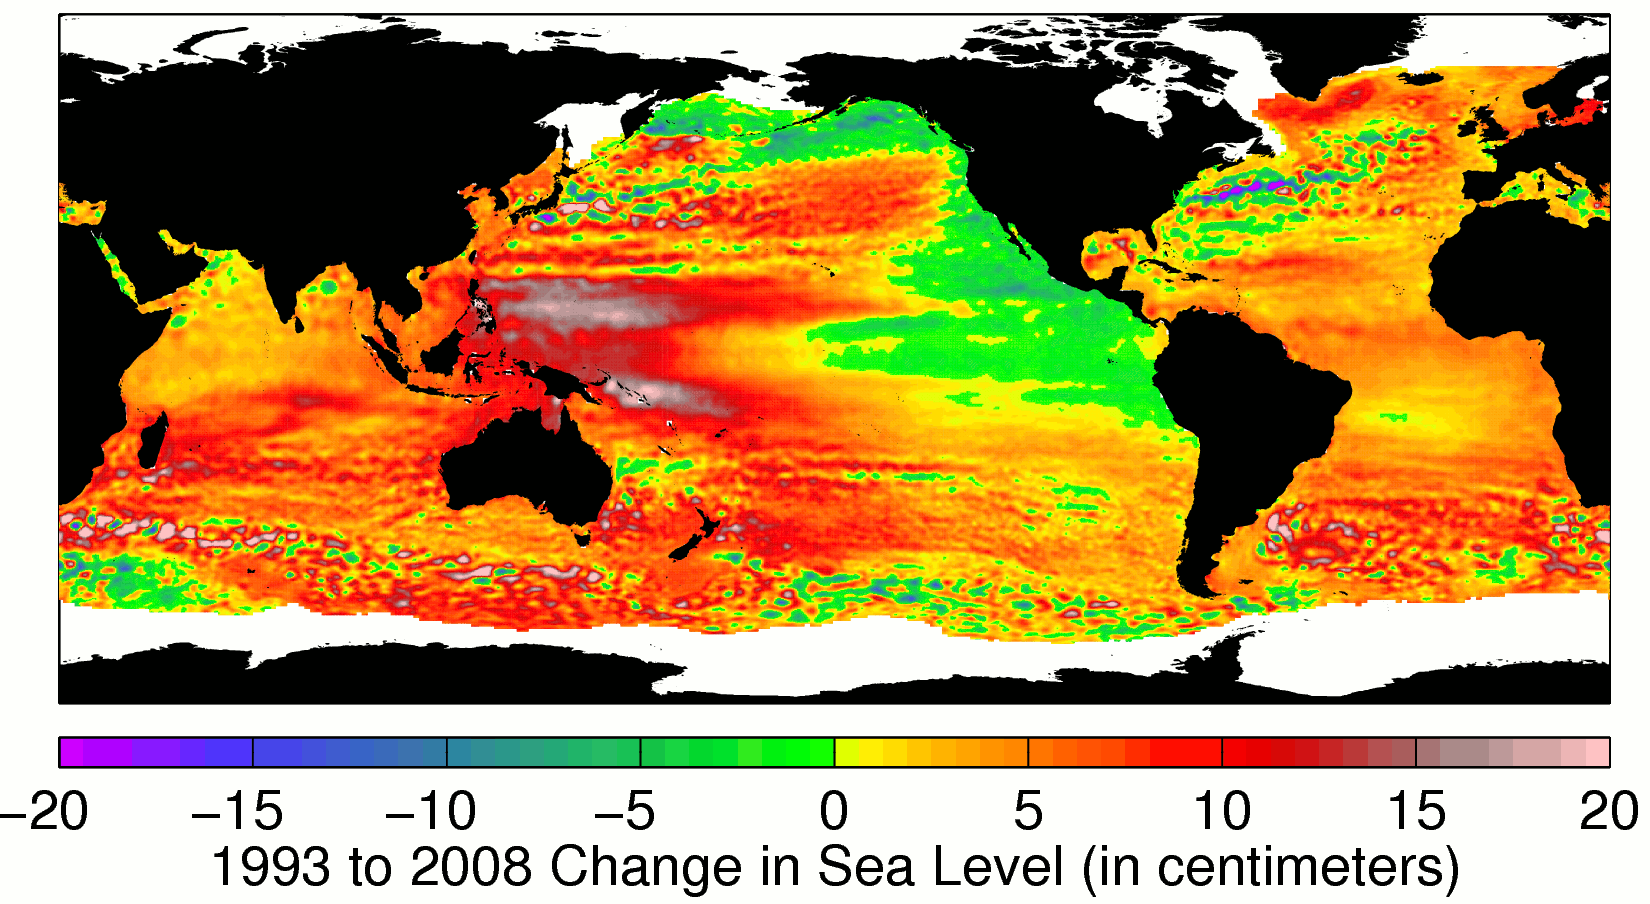
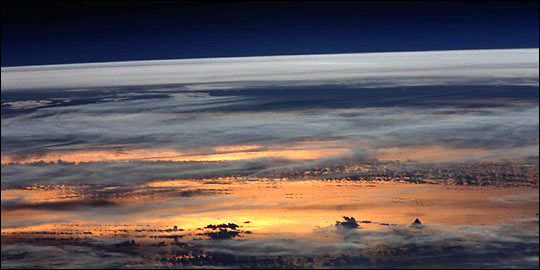
It has long been suspected that dams and reservoirs provide extra moisture to the atmosphere and increase rainfall in the area around the reservoir. In December 2009, Faisal Hossain, of Tennessee Technological University, demonstrated that certain dams could make such rainfall events more extreme and frequent. The research catapulted Faisal and his research group — Sustainability, Satellites, Water and Environment (SASWE) — into the media spotlight, including a February 2010 interview with The Naked Scientists that aired live on the BBC and a feature in National Geographic News.

Hossain and his SASWE group — largely funded by NASA grants — also work to improve the ability of developing nations to monitor water resources that cross national boundaries. In April 2010, the group will be recognized by the National Association of Environmental Professionals with an education excellence award. WhatOnEarth caught up with Hossain to learn more about the group’s work and outreach efforts.

WhatOnEarth: What is satellite hydrology?

Hossain: We study the availability and movement of water on (surface), under (ground) and above (rain) earth’s surface by looking down from satellites in space. Today there are many satellites with instruments that can ‘read’ how much water might be flowing in a river or in the air, and also how wet the ground might be. Because Earth is 75 percent ocean and because land regions are too vast and expensive to completely survey, satellites provide the cheapest convenient and global way of monitoring the flow of water.

WhatOnEarth: What are some of the water issues your group is looking to solve? How?

Hossain: Today, more than 50 percent of the global surface flow is shared by multiple nations. Also, the numerous artificial reservoirs — more than 100,000 — built mostly in the upstream nations not only have vital implications on water supply for nations downstream, but they can also act as catalysts for increased flooding through heavier precipitation.

Without adequate treaties for trans-border cooperation, and without adequate knowledge of how dams alter climate, future water scarcity due to climate change and aging water infrastructure is likely to make nations more vulnerable to water disasters. SASWE is probably the first to demonstrate clearly the value of planned space-borne water measuring missions, such as the Global Precipitation Measurement (GPM) mission, and how they may improve disaster preparedness and environmental management.

WhatOnEarth: Does your research impact people’s lives?

Hossain: Many developing countries in Asia, Africa, and South America, are flood prone and yet unable to forecast floods due to the lack of basin-wide rainfall and stream flow data. Our group is helping to validate and improve NASA’s Global Flood Detection System, which uses rainfall data from NASA’s Tropical Rainfall Measuring Mission, and will also use NASA’s planned GPM mission.

For instance, Bangladesh is situated downstream of the Ganges-Brahmaputra-Meghna basin but does not receive any upstream river flow and rainfall information in real time from India during the critical monsoon season. Bangladeshi authorities measure river flow at staging points where the three major rivers enter Bangladesh and at other points downstream. On the basis of these data, it is possible to forecast flood levels in the interior and south of Bangladesh with only two to three days lead time. Theoretically, future NASA satellite missions could increase this lead time to anywhere from 7 to 14 days depending on the time for stream-flow to drain out from the Himalayas to the Bay of Bengal.

A longer forecasting range would improve decision-support tools that ingest these warnings. For example, 7- to 10-day forecasts are much more useful than daily forecasts in monsoon-affected Asian countries for informing farmers of the potential benefits of delayed sowing or early reaping of crops. A 21-day forecast is considered most ideal. Extended forecasts also assist in economic decision-making through early disbursement of loans to rehabilitate regions that might be affected by floods.

WhatOnEarth: How are public outreach and education part of your team’s mission?

Hossain: We are working with developing nations for climate change adaptation under a joint program with the Institute of Water Modeling (Bangladesh), Tennessee Technological University, and Ohio State University. In this program, staff from Bangladesh receive training each year on environmental management, stewardship and state-of-the-art satellite technology for adapting to climate change. The staff returns home and explores ways to implement the knowledge in their environment and to serve as a model for other developing nations.

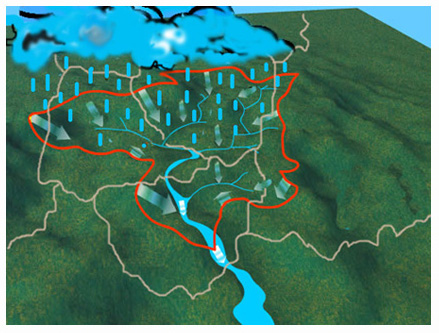
Image Details: Water within a generic watershed boundary (red) can cross many political boundaries (top image). Both images are courtesy of Faisal Hossain, Tennessee Technological University.

— Kathryn Hansen, NASA’s Earth Science News Team

A Closer Look at Dust

                    A wide plume of dust blowing off the Saharan Desert toward the Canary Islands.  Credit: NASA Earth Observatory


Each summer, sandstorms lift millions of tons of dust from the Sahara, carrying plumes of it off the West Coast of Africa and over the Atlantic Ocean. Eric Wilcox, a researcher at NASA’s Goddard Space Flight Center, has been using data from NASA satellites to examine the impact such storms can have on rainfall patterns. Wilcox has a new paper about his findings in Geophysical Research Letters; Nature Geoscience also highlighted it in a recent issue. As a result, we sat down with Wilcox to discuss his new findings and some little-known details about dust.

WhatOnEarth: How does dust affect the atmosphere?

Wilcox: Well, we know that dust isn’t just a passive particle floating around. We know it can either absorb or scatter sunlight. Dust outbreaks surely cool the planet by reducing the amount of sunlight that reaches the surface. Likewise, we know dust can warm the atmosphere, although the magnitude is still uncertain.

WhatOnEarth: What causes a particle to absorb rather than scatter light?

Wilcox: It has to do with the color of the particle and, to some degree, the shape. We call this property the single scattering albedo, which is the probability that a photon of light will scatter versus getting absorbed. If the scatter is very high—say 0.99—then we’re confident that 99 out of 100 photons will scatter. If it’s lower, say 0.85, that means there’s a 15 percent chance that the proton will be absorbed.

WhatOnEarth: Where does Saharan dust fit in?

Wilcox: Some Saharan dust is quite bright and some is much darker. It depends on where the sand is coming from and what its mineralogy is like.

WhatOnEarth: Why does it matter if dust is absorbing light?

Wilcox: We’ve found that dust outbreaks, along with other factors, seem to be shifting tropical precipitation (which typically occurs in a narrow band where winds from the northern and southern hemispheres come together) northward by about four or five degrees, which is about 240 to 280 miles at the equator.

WhatOnEarth: Really? What does dust have to do with precipitation?

Wilcox: The main pathway for dust off the Sahara is usually well north of the band of tropical Atlantic rain storms. However, dust storms coincide  with a strong warming of the lower atmosphere, so the atmospheric circulation over the ocean responds to that warming by shifting wind and rainfall patterns northward during the summer. The rainfall responds to the passage of a dust storm even if the dust does not mix with the rain. 

WhatOnEarth: Will the upcoming Glory mission help you study this phenomenon? I know it has an instrument that will measure aerosols such as  dust? 

Wilcox: Definitely. Over bright reflective surfaces such as deserts — where it has been nearly impossible to distinguish aerosols from the surface — we’re at the point that any new information will be helpful. 

WhatOnEarth: What’s the significance of a northward migration of rainfall during dusty periods?

Wilcox: Certainly people local to the area have an interest in understanding how dust affects their rainfall patterns. The finding also lends support to an idea from one of my colleagues—Bill Lau—who studies the elevated heat pump.The idea is that aerosols from dust storms and air pollution actually affect monsoons. Space Flight Center.

Image Details: The lead image was acquired by the MODIS Land Rapid Response Team at NASA’s Goddard Space Flight Center in 2004.

— Adam Voiland, NASA’s Earth Science News Team

Revisiting the Iris Effect


A surprising paper published last summer suggested that a cloud-related feedback called the Iris Effect might counteract much of the warming associated with man-made greenhouse gases. NASA Langley’s Takmeng Wong (below) was one of several climate scientists who responded to the paper with a methodical inspection of its methods. Credit: Photograph STS109-325-2/Johnson Space Flight Center


A study published last summer by MIT’s Richard Lindzen and Yong-Sang Choi showed a curious thing: 15 years of observations of the tropics revealed that the Earth responds to rising sea surface temperatures by dumping more radiation to space. According to the authors, this feedback — dubbed the “iris effect” — would prevent much of the expected warming due to man-made greenhouse gas emissions. Further, Lindzen and Choi suggested that 11 major climate models had gotten this effect wrong. The paper found the Earth’s climate not nearly as sensitive to global warming as commonly thought.

A number of scientists, at NASA and elsewhere, immediately wondered how they could have missed such a major discrepancy between models and real-world observations. Their response to the paper provides an example of the back-and-forth, checking and re-checking that makes up the scientific process.

NASA Langley’s Takmeng Wong was one of the scientists surprised by the Lindzen and Choi paper. Wong works with data from the Clouds and the Earth’s Radiant Energy System (CERES) on NASA’s Terra satellite and from the Earth Radiation Budget Experiment (ERBE) satellite. Lindzen and Choi used ERBE data for their analysis, so Wong was naturally interested.

“When you see a surprising result, the first thing you do is go to the paper and see what they have,” Wong said. “We tried to do that and to reproduce their results. It’s part of the scientific process.” Being able to reproduce a specific result is an important building block of scientific knowledge.

Wong and Colorado State University’s Chris O’Dell eventually teamed up with Kevin Trenberth and John Fasullo, climate scientists at the National Center for Atmospheric Research, to publish a response. Their examination uncovered a number of deficiencies in Lindzen and Choi’s method, and found their result to be unstable and fragile. That analysis appeared this month in Geophysical Research Letters.

“We went to the same model data, to see if the observations are going one way and the models are going the other way,” Wong said. “When the analysis is done properly using robust scientific technique, what you find is that the observations and the models are consistent to within the uncertainty of the data.”

Wong summarized a few basic problems that led to the surprising finding: 

1. Lindzen and Choi focused on a number of selective time periods. But if the beginning and end points of those time periods are adjusted only slightly, their result falls apart.

2. The paper also treated the tropics as a closed system. In other words, it did not take into account any outside influences on what was happening in the tropics, such as the large amount of energy transport moving in and out of the tropics on ocean currents and atmospheric waves during events such as El Nino and La Nina.“The tropics is not a closed system,” Wong said. “But they treated it as such in the study.”

3. Lindzen and Choi took their result from the tropics and applied it globally, instead of using global data to study the link between global temperature increases and global outgoing radiation to space.

When questions arise that run counter to prevailing thought, Wong said, the only thing to do is take a closer look.

“You cannot make a scientific judgment,” Wong said, “until you’ve done the complete analysis.


Read more about the Iris Effect at the
NASA Earth Observatory

–Patrick Lynch, NASA’s Earth Science News Team