NASA Readies for Spring 2010 Ice Bridge Campaign

The following is a cross-post from our sister blog at NASA’s Operation Ice Bridge. For more frequent updates on the Ice Bridge mission, visit https://www.nasa.gov/topics/earth/features/ice_bridge/index.html

Credit: John Sonntag/Wallops Flight Facility

In August 2008, NASA scientist John Sonntag, of NASA’s Wallops Flight Facility in Wallops Island, Va., captured this view of a small iceberg as it moved down the Narsarsuaq fjord in southern Greenland. “I spent about half an hour watching that little berg, which was in the process of disintegrating during the time I was watching,” Sonntag said. “It went from a complete, small berg to a collection of floating ice rubble within that small span of time. The place was so quiet that the noise of the berg softly coming apart was the only sound present.”

Sonntag’s observation took place during the 2008 NASA and Center for Remote Sensing of Ice Sheets (CReSIS) airborne deployment in Greenland. This spring, Sonntag and other scientists return to the Arctic for big picture and little picture views of the ice as part of NASA’s six-year Operation Ice Bridge mission — the largest airborne survey of Earth’s polar ice ever flown — now entering its second year. The project team is finalizing flight paths over Greenland’s ice sheet and surrounding sea ice, where scientists will collect measurements, maps and images from a suite of airborne instruments. Such information will help scientists extend the record of changes to the ice previously observed by NASA’s Ice, Cloud, and land Elevation Satellite (ICESat), while uncovering new details about land-water-ice dynamics.

NASA aircraft have made numerous science flights over Greenland, most recently during the spring 2009 Ice Bridge campaign and also in 2008 as part of the NASA/CReSIS deployment. Smaller-scale airborne surveys have been made by William Krabill, of NASA Wallops, and colleagues nearly every spring since 1991.

Visit the Operation Ice Bridge Web page throughout the spring 2010 campaign for news, images, and updates from the field. Flights from Greenland are scheduled to begin no sooner than March 22.

— Kathryn Hansen, NASA’s Earth Science News Team

Deep Thoughts on the Ocean and a Scientist's Responsibility

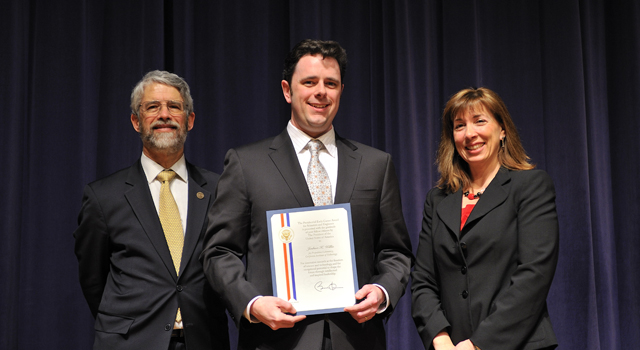
Oceanographer Josh Willis of NASA’s Jet Propulsion Laboratory was recently honored by the White House as a recipient of the Presidential Early Career Award for Scientists and Engineers (PECASE). Willis studies the ocean — particularly the height of the sea surface — with satellite data, though he also works with colleagues who put instruments below the surface of the water. By blending such measurements, he has already made a scientific mark in the study of sea level rise. We caught up with Josh — shown below with White House science advisor John Holdren and NASA deputy administrator Lori Garver — to discuss his inspiration, the importance of the ocean, and the necessity of communicating science.

WhatOnEarth: When you were a child, what did you want to be when you grew up? When did you decide you wanted to be an ocean scientist?

Josh Willis: When I was 9 or 10, I found a book about Einstein’s Theory of Relativity that my parents had lying around the house. I remember reading it and then peppering my parents with questions they couldn’t answer. (This was long before Google, mind you.) So for a long time, I wanted to be a physicist. A couple years of graduate school in physics convinced me otherwise, and I started studying oceanography at the Scripps Institution of Oceanography. Studying the ocean and climate appealed to me because I got to use all the physics and math I learned, but it was also closer to home and of practical importance to a lot of people. Plus, it’s just fun to say “oceanographer” whenever people ask me what I do.

WhatOnEarth: What is the best scientific paper you have written?

Willis: It’s tough to say. Sometimes the papers I think are important are different from the ones that other scientists remember best. But my papers on the causes of sea level rise — based on comparisons between satellite altimeter data, observations of ocean temperature changes, and changes in ocean mass measured by the GRACE satellite — were interesting and fun to write.

WhatOnEarth: What is the most important thing that few people know about the ocean?

Willis: The ocean is the silent martyr of global warming. We always think of global climate change in terms of the warming atmosphere, but it is actually the ocean that absorbs almost all of the extra heat and a whole lot of CO2. The warming contributes to sea level rise and changes ocean ecosystems, while the extra CO2 makes the ocean more acidic, threatening plankton and other tiny critters that make up the foundation of the oceanic food chain.

WhatOnEarth: Why do you feel compelled to talk to the public about your science?

Willis: Communicating our work is a really important part of doing science that most scientists sort of neglect. Figuring out new things about the world around us is only helpful if we communicate them to everyday people. Plus it’s fun and exciting to talk to non-scientists because the questions are often fun and interesting, and I come away feeling inspired and invigorated.

WhatOnEarth: What is the funniest or strangest question you’ve ever gotten?

Willis: I often get a chuckle out of the people who say that global warming is a vast conspiracy among scientists. Scientists love to prove each other wrong, and most of the time we can barely agree on simple questions like “why is the sky blue,” much less orchestrate a conspiracy.

WhatOnEarth: Is the PECASE award an affirmation or an inspiration for your career?

Willis: This is definitely a great honor and inspiration. When President Obama met with us, one of the first things he told us was how nice it was to honor a group of scientists still in the early stages of our careers. “All of you folks are younger than me!” he said. But he also made it clear that he expected a lot from us in the future. That’s a pretty big inspiration when the President tells you he’s expecting great things. And it’s a pretty big responsibility, too. I guess that means it’s probably time to get back to work now…

Mike Carlowicz, NASA’s Earth Science News Team

Up Close with Ice Bridge

NASA and partners are nearing the end of the 2009 Antarctic campaign of Operation Ice Bridge — a multi-year airborne survey to study Earth’s polar ice sheets, ice shelves and sea ice. Data collected from the DC-8 aircraft will help scientists monitor changes in West Antarctica and bridge the gap between the ICESat and ICESat-2 satellites. Also, the close-up look — not possible from satellites — will help scientists learn more about the region’s ice dynamics.

Ice Bridge scientist Seeyle Martin.  Credit: NASA

The detailed look with lasers and radar, sometimes from just 1,000 feet above the ice, is now returning a wealth of scientific information about the ice surface and what’s below. And to the human eye, the low-altitude view shows West Antarctica’s intricacies: the vast expanse of white giving way to deep crevasses and volcanoes, and sea ice resembling pancakes and oil slicks.

The 2009 Operation Ice Bridge campaign concludes no later than Nov. 21. Want to follow the remainder of the flights? Here’s how to connect:

  • Webisodes – Watch this series of YouTube videos for a behind-the-scenes look at Ice Bridge mission planning and flights in Antarctica.

  • Image gallery – Curious what pancake ice looks like or want to take a peek inside the DC-8? Check out the image gallery for photos added throughout the mission

  • Blog – Read about the campaign straight from the scientists and public affairs officers on site.

  • Twitter – Be among the first to know if a flight took off or if it was grounded due to weather, and discover the target of most flights — glacier, ice sheet or sea ice?

–Kathryn Hansen, NASA’s Earth Science News Team
Hydrology Takes the Cake at AGU

There’s a staggering amount of science presented every year at the American Geophysical Union meeting, Earth science’s equivalent of the post-season, prom, and a college reunion all rolled into one. This year, with more than 16,000 attendees and 15,815 abstracts on the docket, was no exception.

AGU groups all the abstracts into one of 27 categories. Hydrology garnered the most attention from scientists (12.2 percent of all abstracts) followed closely by Atmospheric Sciences (11.1 percent) and finally Volcanology, Geochemistry, and Petrology (8.0 percent). The full breakdown is below:

NASA, though best known for sending men to the moon and robots to Mars, had plenty of Earth science — including stories about black carbon, California’s carbon budget (and dwindling water supplies), greenhouse gases, and one of our Earth observing flagships — to add to the mix as well.

–Adam Voiland, NASA’s Earth Science News Team

Same Words But Different Meanings

Earth scientists milling around the lobby during coffee breaks at this year’s AGU had something unusual to mull over this year.  A phalanx of colorful posters, created by a visual communicator who describes herself as a note taker on steroids, adorned the lobby of the Moscone Center. Snippets from the illustrated notes offer a fascinating look into some of the brainstorming sessions that have taken place about communicating climate science. AGU intstalled the posters at a fitting time: it’s been a disorienting month for climate scientists who have watched seemingly specious charges of scientific malpractice become a major news item.

One of the posters — called Communicating with Congress (and Everybody Else) — brainstorms some of the pitfalls that make communicating climate science such a challenge. High on the list: jargon. Scientists use such a specialized language that it can be difficult for non-scientists — even for those of us who cover the topic regularly — to distill the meaning from certain scientific presentations or articles. Complicating matters more, there are some words that have distinctly different meanings to scientists and the public. The poster highlighted a handful of them. I’ve taken the liberty of elaborating upon and defining a few of them below. 

Did you know the difference?  Have any good examples to add to the list?

Aerosols
The Public: Spray cans that dispense a liquid mist, many of which damage Earth’s ozone layer.

Scientists: A suspension of any solid or liquid droplet in the atmosphere. Includes dust, soot, pollen, sea salt, sulfates and more. More details about aerosols. 

Radiation
The Public: Harmful material that leaks from nuclear material and is used to battle cancer.
Scientists: Energy that comes from a source and travels through some material or space. Includes electromagnetic radiation such as radio waves, infrared light, visible light, ultraviolet light, and X-rays.  More details about
electromagnetic radiation.

Ozone
The Public: Something over Antarctica that protects against cancer-causing light waves. 
Scientists: A molecule containing three oxygen atoms that functions as a harmful air pollutant near the surface, a greenhouse gas in the upper troposphere, and a buffer against ultraviolet radiation in the stratosphere. 
More details about ozone.

Bias
The Public: Willful manipulation of facts to suit political ideology.
Scientists: A term used to describe a statistical sample in which members of the sample are not equally likely to be chosen. Also a term used to describe the difference between an
estimator’s expectation and the true value of the parameter being estimated. For some scientific analyses, a certain degree of bias can actually be beneficial.


–Adam Voiland, NASA’s Earth Science News Team

Communicating Climate Change

Rigor. Not rigor mortis.

Those are two basic tenets of talking to the public about global warming, offered by Mark Serreze, director of the National Snow and Ice Data Center. He spoke at a Thursday morning session on “communicating climate” at the American Geophysical Union’s fall meeting in San Francisco.

The climate debate as carried out on cable news, over dinner tables and at the office these days is anything but dead. Serreze and a handful of other presenters at the session encouraged scientists to inject their scientific knowledge into this debate, especially at this critical moment for policy development to address climate change impacts. But, Serreze gently prodded, be sure to bring the scientific rigor, while leaving the calcified sciencese in the lab.

In past years a session like this might not have even appeared on the AGU schedule. No data-dense graphs were shown, no recent breakthroughs discussed. But its presence on the agenda – and a strong attendance – say something about the pitch and significance of the public climate debate right now.

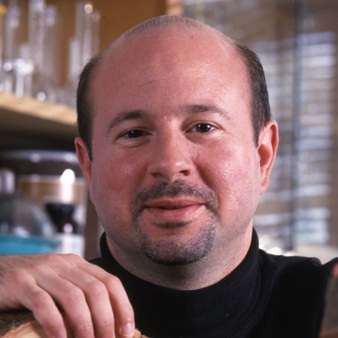
Michael Mann, a Penn State climate scientist respected worldwide who, with colleagues, produced the now-famous “hockey stick” graph depicting recent drastic temperature changes, led off the session. Mann (pictured) has become a target of climate change deniers. Some of his personal emails were among those aired after hackers stole them off a computer server at the University of East Anglia Climatic Research Unit in England recently.

Mann said scientists for too long have been content to focus on their science and let any public debate of it play out on its own. He contends this strategy isn’t enough anymore, as a “well-funded disinformation effort” is still hard at work to discredit climate science and confuse the public.

“We’ve got to be out there, making the case,” Mann said. “These allegations are a distraction and are specious. We have to say that and at the same time use the opportunity to make the positive case.”

“The media alone cannot be expected to adequately defend the science and the scientists. It’s not their job. Our job is to make sure scientific truth is represented,” Mann said.

— Patrick Lynch, NASA’s Earth Science News Team
   Image Credit: Penn State University

The Uphill Road to Measuring Snow

One-sixth of the world’s population relies on melted snow for their freshwater, which means good estimates of snow are critical for making realistic predictions of a region’s water supply.

But measuring snow, especially the amount of water locked within that snow, challenges researchers across the globe. Why? The two means of estimating snow totals—weather modeling and satellite remote sensing—can vary as much as 30 percent.

Scientists like hydrologist Edward Kim of NASA’s Goddard Space Flight Center continue to seek ways to reconcile the gap between measurement results. Kim and colleagues Michael Durand (Byrd Polar Research Center), Noah Molotch (Univ. of Colorado), and Steve Margulis (UCLA) are wrapping up a short field campaign to measure snow at the Storm Peak Laboratory, perched atop Colorado’s famed mountain at Steamboat Springs.

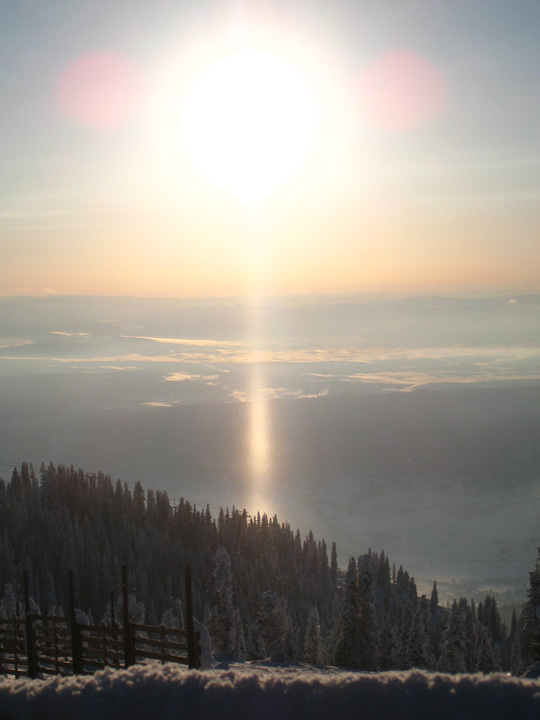
Their aim is to test and improve the accuracy of satellite-based snow measurements. In the midst of the expedition, they’ve also snapped some breathtaking photos, such as this sun pillar to the right. Sun pillars are typically caused by sunlight reflecting off the surfaces of falling ice crystals associated with certain cloud types.

This post was adapted from NASA’s Earth Observatory. For more updates on the expedition, please visit the Notes From the Field blog.

–Adam Voiland, NASA’s Earth Science News Team

Science at the Intersection of Air Quality and Climate Change


Smog over New York. Credit: NASA

The atmosphere is a stew of gases and particles. Some affect climate. Others degrade air quality and threaten human health. Some do both. Some do neither. Many of them interact with and affect one other.

Ozone, for example, causes respiratory problems near the surface, but also functions as a greenhouse gas. Black carbon aerosol particles do the same, and also contribute to heart disease.

Other pollutants — notably sulfates and nitrates—create health problems but simultaneously reflect incoming sunlight and cool the climate. Some, like nitrogen oxide, are precursors to ozone, but also affect the abundance of the light- scattering pollutants that cool the climate.

All of this adds up to a question that keeps some climatologists up at night: Is it possible to reduce emissions of toxic air pollutants in a way that will mitigate global warming, or at least not make it worse?

For example, reducing black carbon has the potential to improve health and reduce global temperatures by as much as a degree. On the other hand, reducing sulfates—which industries often emit along with black carbon—could negate any reduction in warming that pollution controls might produce. (These are just a few examples from the dozens of gases and particles that scientists have to factor in tabulating Earth’s energy budget.)

Almut Arneth, a researcher from Lund University in Sweden, and colleagues, including NASA climatologist Nadine Unger, considered the question recently in a “perspectives” piece in Science. You can read the full paper here (though you may need to brush up on your atmospheric chemistry to understand the details). Unger and her coauthors sum the complicated situation up this way:

“Given the toxicity of pollutants, the question is not whether ever stricter air pollution controls will be implemented, but when and where. The jury is out on whether air pollution control will accelerate or mitigate climate change. Still, the studies available to date mostly suggest that air pollution control will accelerate warming in the coming decades.”

If that’s correct, not only do we have a bigger climate problem on our hands than we may have thought, but some will surely misinterpret the finding by concluding that we ought to continue polluting—or even ramp up the emission of certain pollutants with geoengineering—to stave off climate change, a point that NASA climatologist Gavin Schmidt made recently on RealClimate.

–Adam Voiland, NASA’s Earth Science News Team