The Glory Initiative


Diehard fans of the hit television show Lost, which will air its final episode Sunday, know that the Swan (station number 3 of the mysterious Dharma Initiative) was designed to study strange electromagnetic fluctuations emanating from a tropical island in the South Pacific.

Likewise, thanks to an old orientation video about the Swan that turned up during the second season, they know that the station houses a computer that requires a code be entered and a button pushed every 108 minutes to avoid unleashing powerful forces capable of destroying the island and perhaps all of Earth.

And, finally, they know that Desmond Hume, a character from the show (named after influential Scottish philosopher David Hume), took the instructions in the video to heart and pushed the button fastidiously for years.

What they surely don’t know, regardless of how many hours they’ve spent scouring Lostpedia or regaling perplexed coworkers with Lost trivia, is that engineers for NASA’s Glory mission have a computer and button of their own at the University of Colorado’s Laboratory for Atmospheric and Space Physics (LASP) that’s keeping them up at night.

LASP’s button is related to a “24-hour test”, which is one of many tests that engineers have performed prior to Glory’s expected November 22 launch to ensure the climate satellite will be capable of handling the harsh environment of space. The test required that engineers at LASP follow a protocol nearly identical to Desmond’s notorious button routine.

The protocol was so similar that LASP engineer Patrick Brown, a hobbyist videographer and the person responsible for designing the pointing system of an instrument aboard Glory that will monitor the sun’s irradiance, was inspired to pull together an orientation video of his own. We checked in with Brown to learn more.


Does the clip show an actual test or is it just a spoof?
It’s actually real. The 24-hour test is a comprehensive simulation where we power the spacecraft and both of Glory’s science instruments on to simulate the orbit motion of the spacecraft; it helps to make sure the electronics are working well together. It’s sort of a “day-in-the life” test. LASP was responsible for continuously monitoring Glory’s TIM instrument during the test.

So why make this test into a Lost spoof?
As we were talking about the test protocol, I came to realize it was quite similar to the Lost button-pushing scenario. I suggested jokingly that we should make a parody, and I just did it one night after work. Everything that’s in the video is correct in terms of how we monitor the TIM during the 24-hour-test. It’s almost a 1-to-1 parallel. During the test, we actually had to call Orbital Sciences in Virginia, where the spacecraft  was, every 100 minutes to tell them to turn on the “stimulus”.

What is the “stimulus”?
As part of the test, we have stimulus lamps that simulate the sun. Every one of Glory’s orbits will take about 100 minutes, but we spend approximately 60 minutes in the sunlight and 40 minutes in the dark. We have to have the stimuli lights powered on when to simulate the time we’re in the sunlight and turned off to simulate the time Glory will be in Earth’s shadow.

Do the people on your team look forward to this particular test?
We divide up the time and have about four hour shifts, but the 2 am to 6 am shift definitely isn’t popular. Most of them time you’re looking at the screen, and there’s nothing happening. Still, you have to keep a close eye on the computer, and you can’t use the computer to do anything other than monitor the TIM instrument.

Who have you showed your video to and how did they react?
My coworkers have all seen it, plus my family and friends. The people who know both Lost and Glory absolutely love it. People who aren’t wrapped up in the whole Lost phenomenon have a harder time understanding the irony.

Who’s your favorite Lost character?
That’s a good question, but it would have to be Desmond.

–Adam Voiland, NASA’s Earth Science News Team

Fun with Aureoles and Aerosols

 
      Credit: Earth Science Picture of the Day/Rob Rathkowski


Earth Science Picture of the Day (EPOD)
recently ran a series of photos that illustrates nicely the impact that small airborne particles called aerosols can have on light.

As EPOD notes, the size of an aureole — the halo-like circle that appears around the sun when viewed through a haze or mist — depends on the amount of aerosol in the air. More aerosols mean more light is scattered, which produces larger aureole). Since most aerosols are concentrated near Earth’s surface, the aureole at sea level appears much larger than it would high on a mountain peak. You can try this experiment yourself to get a sense of the aerosol load in the air you’re breathing.

Aerosols are a major preoccupation for climate scientists as the particles—including dust, ash, sea salt, soot, and industrial pollutants—can scatter light and affect Earth’s energy balance. Infusions of ash and sulfate from volcanic eruptions, for example, are capable of cooling global temperatures by 0.3 degrees Celsius. Likewise, sulfate aerosols from factories and power plants can mask global warming somewhat and are often bandied around as possible components of geoengineering schemes.

Want to learn more about how aerosols scatter light? EPOD has another post on the topic that compares aureoles at sunsets in the Netherlands before (below left) and after (below right) the arrival of a massive volcanic ash cloud from the eruption of Eyjafjallajökull. Also, for optics aficionados, a site called Atmospheric Optics will walk you through a number of interesting examples of aerosols and atmospheric water and ice scattering light.


        Credit: Earth Science Picture of the Day/Kosmas Gazeas
— Adam Voiland, NASA’s Earth Science News Team

Are the Oceans Really Stuffed to the Gills with Carbon Dioxide?

Two months ago, NASA’s Timothy Hall and colleagues published a study that described how they had estimated the amount of manmade carbon dioxide absorbed by the ocean since the start of the industrial era.

Oceans absorb about a third of the carbon dioxide that humans release into the atmosphere, so sorting out a long-term record of carbon uptake is of great interest to climate scientists.

To create their record of the ocean’s uptake of carbon, Hall and Samar Khatiwala, the lead author of the study, devised a clever mathematical technique that proved to be a considerable advance. When Hall’s study appeared in the journal Nature, he assumed the creation of this new long-term, continuous record would headline the news.

But journalists gravitated toward something else entirely: a brief mention that the amount of carbon dioxide absorbed by the ocean seemed to be experiencing, as the researchers put it, “a small decline in the rate of increase in the last few decades.”

“Seas Grow Less Effective at Absorbing Emissions”, one headline trumpeted. Another article compared the world’s oceans to a fish “stuffed to the gills” with carbon dioxide and another reported a “sudden and dramatic drop in the amount of carbon dioxide being absorbed by the sea.

Given the caveats included in the original study, all of this caught Hall slightly off guard. I’ll let Hall, who summarized his reactions to the coverage for What On Earth, pick the story up from here:

My coauthors and I had viewed the ability to estimate the history of ocean uptake of anthropogenic carbon as the highlight of the paper. Previously, observationally-based estimates had only provided a few snapshots in time, and we were proud of the cleverness of our techniques.

It seems clever mathematical techniques, however, don’t make good press releases. Interestingly, coverage of the paper has not focused on the fact that we can estimate the uptake history. Instead it has focused on apparent reductions in the rate of uptake over the last 2 decades.

The figure below shows our estimate of ocean uptake since 1775. The first impression is the rapid increase since 1950, coinciding with the rapid rise in carbon emissions to the atmosphere. The oceans have prevented about 1/3 of anthropogenic carbon emissions from accumulating in the atmosphere. A closer reading of the curve reveals a reduction in the uptake’s rate of increase after about 1980, even while emissions continue to increase.

Scientists have long suspected that ocean carbon uptake would eventually be unable to keep pace with rising emissions. Basic aqueous chemistry tells us that, as dissolved carbon in seawater increases, seawater becomes less able to absorb new carbon. Eventually, the absorption saturates. The slowing down of the increase rate may be an early signal of this saturation.

However, recent changes in uptake were not our focus when we performed the study, and more importantly we did not analyze the statistical significance of the slowdown. We plan further analysis on these trend variations. What we can say is that there are physical reasons to suspect a reduction in the ocean’s capacity to keep pace with increasing carbon emissions, and that there are now strong observational hints for recent reductions.

Hall advises reading this story, which also appeared in Nature. It’s less dramatic and more technical than most of media accounts, but it is a more accurate representation of the paper.

–Adam Voiland, NASA’s Earth Science News Team
   Image Credit: (EPOD/K. Chrisodoulopoulus)

A Revolutionary Way to Observe Earth


Engineers watch a quarter scale model of a wing-like guidance system that could be used to steer a new type of Earth-observing balloon.  

Science tends to be a conservative profession. Only rarely are “discoveries” made or paradigms upended. And most researchers spend entire careers working toward incremental advances in understanding rather than dreaming up radical new ways to tackle a problem.

So it’s not often that you’ll find the word “revolutionary” in the pages of a peer-reviewed scientific journal. Yet, that’s precisely the word that a group of earth scientists and balloon boosters use liberally in a Bulletin of the American Meteorological Society article describing the experimental balloon platform that NASA-funded scientists and engineers have dreamed up.

They’re called StratoSats and, according to advocates like Warren Wiscombe, a senior scientist at NASA’s Goddard Space Flight Center who studies Earth’s energy budget, the long-duration balloons would cruise on the cusp of space far above airplane traffic. From high in the stratosphere, these super-pressure balloons could collect key data on Earth’s energy budget, climate, magnetic field, and atmospheric water vapor for a tiny fraction of the cost of competing technologies, such as unmanned aerial vehicles or satellites. 

Advocates for StratoSats envision hundreds floating in the stratosphere. Constellations of the balloons could be organized to suit the needs of scientists, from “string of pearl” formations that keep a hurricane constantly in view to more or less uniformly distributed formations – as shown in the simulation below (each yellow dot represents a StratoSat).
 
With the uniform distribution, Wiscombe says, the StratoSats could survey over 99 percent of the atmosphere both vertically and horizontally and cover certain areas near the poles that aren’t
readily detectable by satellite instruments in sun-synchronous orbits. The StratoSats would be able to ride strong zonal winds that would push them around the Earth every 10 to 20 days. 

One nagging drawback of research balloons is that they drift with the winds, which can make it difficult to collect usable data. However, the StratoSats would have a 15-kilometer tether toting a 5-meter wing far below. The wing would function much like the sail of a sailboat, and give scientists the means to keep the balloons on a set course. “Steering a StratoSat is somewhat like steering a cruise ship,” Wiscombe said. “You can’t make sharp turns, but you can achieve a new course within a few days.”

For the last ten years, NASA has been developing ultra-long-duration balloons (ULDB) that aim to study remnants of the early universe. Though some of these stratosphere capable balloons have failed to deploy completely during tests, NASA’s Balloon Program, based at Wallops Flight Facility in Virginia, has carried out a successful 54-day flight of a small Super Pressured Balloon.

Meanwhile, full-scale mechanical prototypes of the StratoSat guidance system have already been built and ground-tested. And NASA-funded engineers have successfully flown one-quarter scale balloon guidance systems (below) from blimps, Wiscombe said.

StratoSat boosters may not have too much longer to wait. According to David Pierce, the Chief of NASA’s Balloon Program, his team is already well on its way to providing the sort of capabilities that StratoSats would require.

“There is still some engineering development that must be accomplished to fully integrate the small super-pressure balloons with the StratoSat sail, but you can expect the smaller super-pressure balloons to be available within the next year for Earth science missions,” he noted. “We are quite confident that StratoSats could do a lot of science at much less cost than orbiting satellites.”


Image Information: The second image is an illustration of the StratoSat platform. The third is a map that shows the potential formation of a fleet of StratoSats (each yellow dot represents one StratoSat). All three images were published in the Bulletin of the American Meteorological Society without crediting information. The corresponding author of the paper, which is available here, is Kerry Kock. 

— Adam Voiland, NASA’s Earth Science News Team

Flying high with NASA's Joanne Simpson

Joanne Simpson, the first woman to earn a PhD in meteorology, didn’t just break into a field where women weren’t welcome. She broke the door down and accumulated a list of scientific achievements that’s rare for any scientist, regardless of gender.

Early in her career, she made the key insight that narrow cumulonimbus clouds–she called them “hot towers” — are the engines that drive tropical circulation and help sustain the eyes of hurricanes. Later, she became one of the first scientists to develop a cloud model, an advance that ultimately sparked a whole new branch of meteorology. She spent decades with NASA, helping to lead the Tropical Rainfall Measurement Mission, a satellite that’s led to key insights about how hurricanes start and how dust affects precipitation. And she was a key proponent for the upcoming Global Precipitation Measurement (GPM), the follow up satellite to TRMM.

No stranger to controversy, she stirred up a scientific furor when she sought to test the validity of her cloud model by experimenting with cloud seeding. Even well into her eighties, Simpson didn’t shy from vigorous debate about the scientific basis of global warming.

In March, at the age of 86, Simpson passed away in Washington, D.C. In a recent interview with the Discovery Channel, a producer asked her what was the most fascinating thing about studying the atmosphere. “In my case, it’s the clouds,” she said without hesitation. “There are some beautiful ones out there right now,” she said while gesturing toward the window.

In tribute to Simpson’s efforts to understand clouds, we’ve chosen four of our favorite cloud images from a series of images that Simpson donated to the NOAA Photo Library and likely took. The photographs were taken from NASA’s DC-8 during the TOGA-COARE project in the 1990s.

Joanne Simpson Portrait Information: Illustration by Martin Mueller of NRC and NASA GSFC via NASA’s Earth Observatory.


Puffy fair weather cumulus clouds and hints of reefs are visible below the right wing of NASA’s DC-8. Credit: NOAA Photo Library/Dr. Joanne Simpson Collection


A towering example of a showering anvil cloud roils over the Pacific Ocean. Credit: NOAA Photo Library/Dr. Joanne Simpson Collection


Dusk falls over the Pacific Ocean with a large cumulonimbus cloud in the distance. Credit: NOAA Photo Library/Dr. Joanne Simpson Collection

— Adam Voiland, NASA’s Earth Science News Team

A Closer Look at Dust

                    A wide plume of dust blowing off the Saharan Desert toward the Canary Islands.  Credit: NASA Earth Observatory


Each summer, sandstorms lift millions of tons of dust from the Sahara, carrying plumes of it off the West Coast of Africa and over the Atlantic Ocean. Eric Wilcox, a researcher at NASA’s Goddard Space Flight Center, has been using data from NASA satellites to examine the impact such storms can have on rainfall patterns. Wilcox has a new paper about his findings in Geophysical Research Letters; Nature Geoscience also highlighted it in a recent issue. As a result, we sat down with Wilcox to discuss his new findings and some little-known details about dust.

WhatOnEarth: How does dust affect the atmosphere?

Wilcox: Well, we know that dust isn’t just a passive particle floating around. We know it can either absorb or scatter sunlight. Dust outbreaks surely cool the planet by reducing the amount of sunlight that reaches the surface. Likewise, we know dust can warm the atmosphere, although the magnitude is still uncertain.

WhatOnEarth: What causes a particle to absorb rather than scatter light?

Wilcox: It has to do with the color of the particle and, to some degree, the shape. We call this property the single scattering albedo, which is the probability that a photon of light will scatter versus getting absorbed. If the scatter is very high—say 0.99—then we’re confident that 99 out of 100 photons will scatter. If it’s lower, say 0.85, that means there’s a 15 percent chance that the proton will be absorbed.

WhatOnEarth: Where does Saharan dust fit in?

Wilcox: Some Saharan dust is quite bright and some is much darker. It depends on where the sand is coming from and what its mineralogy is like.

WhatOnEarth: Why does it matter if dust is absorbing light?

Wilcox: We’ve found that dust outbreaks, along with other factors, seem to be shifting tropical precipitation (which typically occurs in a narrow band where winds from the northern and southern hemispheres come together) northward by about four or five degrees, which is about 240 to 280 miles at the equator.

WhatOnEarth: Really? What does dust have to do with precipitation?

Wilcox: The main pathway for dust off the Sahara is usually well north of the band of tropical Atlantic rain storms. However, dust storms coincide  with a strong warming of the lower atmosphere, so the atmospheric circulation over the ocean responds to that warming by shifting wind and rainfall patterns northward during the summer. The rainfall responds to the passage of a dust storm even if the dust does not mix with the rain. 

WhatOnEarth: Will the upcoming Glory mission help you study this phenomenon? I know it has an instrument that will measure aerosols such as  dust? 

Wilcox: Definitely. Over bright reflective surfaces such as deserts — where it has been nearly impossible to distinguish aerosols from the surface — we’re at the point that any new information will be helpful. 

WhatOnEarth: What’s the significance of a northward migration of rainfall during dusty periods?

Wilcox: Certainly people local to the area have an interest in understanding how dust affects their rainfall patterns. The finding also lends support to an idea from one of my colleagues—Bill Lau—who studies the elevated heat pump.The idea is that aerosols from dust storms and air pollution actually affect monsoons. Space Flight Center.

Image Details: The lead image was acquired by the MODIS Land Rapid Response Team at NASA’s Goddard Space Flight Center in 2004.

— Adam Voiland, NASA’s Earth Science News Team

Hydrology Takes the Cake at AGU

There’s a staggering amount of science presented every year at the American Geophysical Union meeting, Earth science’s equivalent of the post-season, prom, and a college reunion all rolled into one. This year, with more than 16,000 attendees and 15,815 abstracts on the docket, was no exception.

AGU groups all the abstracts into one of 27 categories. Hydrology garnered the most attention from scientists (12.2 percent of all abstracts) followed closely by Atmospheric Sciences (11.1 percent) and finally Volcanology, Geochemistry, and Petrology (8.0 percent). The full breakdown is below:

NASA, though best known for sending men to the moon and robots to Mars, had plenty of Earth science — including stories about black carbon, California’s carbon budget (and dwindling water supplies), greenhouse gases, and one of our Earth observing flagships — to add to the mix as well.

–Adam Voiland, NASA’s Earth Science News Team

Same Words But Different Meanings

Earth scientists milling around the lobby during coffee breaks at this year’s AGU had something unusual to mull over this year.  A phalanx of colorful posters, created by a visual communicator who describes herself as a note taker on steroids, adorned the lobby of the Moscone Center. Snippets from the illustrated notes offer a fascinating look into some of the brainstorming sessions that have taken place about communicating climate science. AGU intstalled the posters at a fitting time: it’s been a disorienting month for climate scientists who have watched seemingly specious charges of scientific malpractice become a major news item.

One of the posters — called Communicating with Congress (and Everybody Else) — brainstorms some of the pitfalls that make communicating climate science such a challenge. High on the list: jargon. Scientists use such a specialized language that it can be difficult for non-scientists — even for those of us who cover the topic regularly — to distill the meaning from certain scientific presentations or articles. Complicating matters more, there are some words that have distinctly different meanings to scientists and the public. The poster highlighted a handful of them. I’ve taken the liberty of elaborating upon and defining a few of them below. 

Did you know the difference?  Have any good examples to add to the list?

Aerosols
The Public: Spray cans that dispense a liquid mist, many of which damage Earth’s ozone layer.

Scientists: A suspension of any solid or liquid droplet in the atmosphere. Includes dust, soot, pollen, sea salt, sulfates and more. More details about aerosols. 

Radiation
The Public: Harmful material that leaks from nuclear material and is used to battle cancer.
Scientists: Energy that comes from a source and travels through some material or space. Includes electromagnetic radiation such as radio waves, infrared light, visible light, ultraviolet light, and X-rays.  More details about
electromagnetic radiation.

Ozone
The Public: Something over Antarctica that protects against cancer-causing light waves. 
Scientists: A molecule containing three oxygen atoms that functions as a harmful air pollutant near the surface, a greenhouse gas in the upper troposphere, and a buffer against ultraviolet radiation in the stratosphere. 
More details about ozone.

Bias
The Public: Willful manipulation of facts to suit political ideology.
Scientists: A term used to describe a statistical sample in which members of the sample are not equally likely to be chosen. Also a term used to describe the difference between an
estimator’s expectation and the true value of the parameter being estimated. For some scientific analyses, a certain degree of bias can actually be beneficial.


–Adam Voiland, NASA’s Earth Science News Team

The Uphill Road to Measuring Snow

One-sixth of the world’s population relies on melted snow for their freshwater, which means good estimates of snow are critical for making realistic predictions of a region’s water supply.

But measuring snow, especially the amount of water locked within that snow, challenges researchers across the globe. Why? The two means of estimating snow totals—weather modeling and satellite remote sensing—can vary as much as 30 percent.

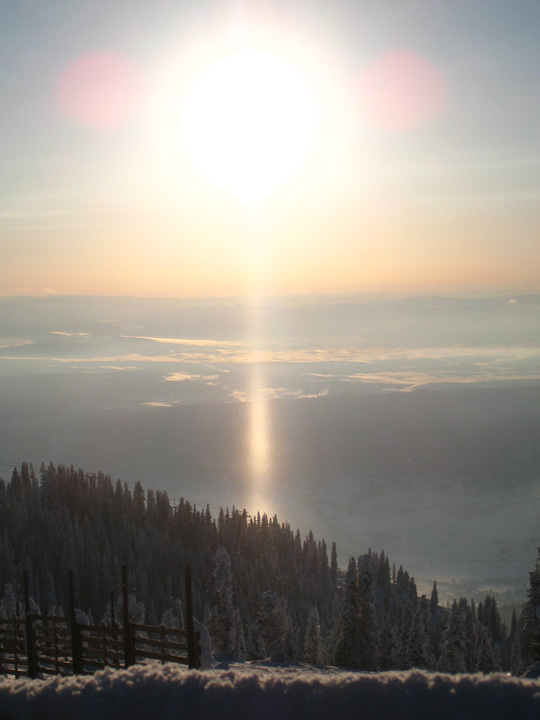
Scientists like hydrologist Edward Kim of NASA’s Goddard Space Flight Center continue to seek ways to reconcile the gap between measurement results. Kim and colleagues Michael Durand (Byrd Polar Research Center), Noah Molotch (Univ. of Colorado), and Steve Margulis (UCLA) are wrapping up a short field campaign to measure snow at the Storm Peak Laboratory, perched atop Colorado’s famed mountain at Steamboat Springs.

Their aim is to test and improve the accuracy of satellite-based snow measurements. In the midst of the expedition, they’ve also snapped some breathtaking photos, such as this sun pillar to the right. Sun pillars are typically caused by sunlight reflecting off the surfaces of falling ice crystals associated with certain cloud types.

This post was adapted from NASA’s Earth Observatory. For more updates on the expedition, please visit the Notes From the Field blog.

–Adam Voiland, NASA’s Earth Science News Team

Science at the Intersection of Air Quality and Climate Change


Smog over New York. Credit: NASA

The atmosphere is a stew of gases and particles. Some affect climate. Others degrade air quality and threaten human health. Some do both. Some do neither. Many of them interact with and affect one other.

Ozone, for example, causes respiratory problems near the surface, but also functions as a greenhouse gas. Black carbon aerosol particles do the same, and also contribute to heart disease.

Other pollutants — notably sulfates and nitrates—create health problems but simultaneously reflect incoming sunlight and cool the climate. Some, like nitrogen oxide, are precursors to ozone, but also affect the abundance of the light- scattering pollutants that cool the climate.

All of this adds up to a question that keeps some climatologists up at night: Is it possible to reduce emissions of toxic air pollutants in a way that will mitigate global warming, or at least not make it worse?

For example, reducing black carbon has the potential to improve health and reduce global temperatures by as much as a degree. On the other hand, reducing sulfates—which industries often emit along with black carbon—could negate any reduction in warming that pollution controls might produce. (These are just a few examples from the dozens of gases and particles that scientists have to factor in tabulating Earth’s energy budget.)

Almut Arneth, a researcher from Lund University in Sweden, and colleagues, including NASA climatologist Nadine Unger, considered the question recently in a “perspectives” piece in Science. You can read the full paper here (though you may need to brush up on your atmospheric chemistry to understand the details). Unger and her coauthors sum the complicated situation up this way:

“Given the toxicity of pollutants, the question is not whether ever stricter air pollution controls will be implemented, but when and where. The jury is out on whether air pollution control will accelerate or mitigate climate change. Still, the studies available to date mostly suggest that air pollution control will accelerate warming in the coming decades.”

If that’s correct, not only do we have a bigger climate problem on our hands than we may have thought, but some will surely misinterpret the finding by concluding that we ought to continue polluting—or even ramp up the emission of certain pollutants with geoengineering—to stave off climate change, a point that NASA climatologist Gavin Schmidt made recently on RealClimate.

–Adam Voiland, NASA’s Earth Science News Team