What On Earth Is That?
Author: avoiland

What On Earth is That #6
What on Earth is That?
This week we have our first sound-video What on Earth is That combo. Here’s the sound:
And now here’s what it looks like:
And now here’s what it looks like:
(Post your guesses in the comments section, and check back next week for the answer….)
Speaking of Contrails…
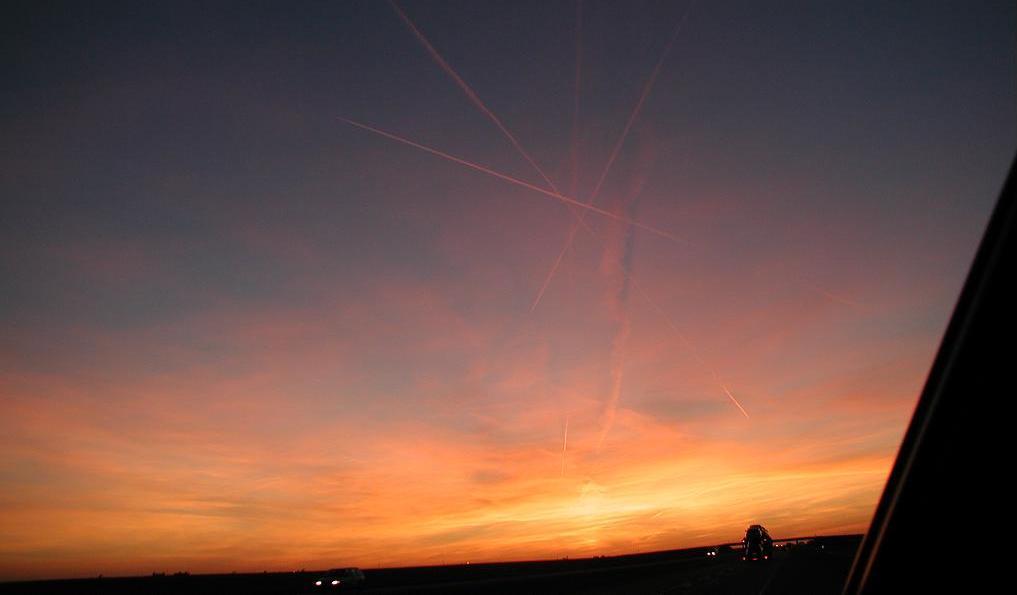
The prospect of a renegade missile transfixed newscasters last week after a videographer captured imagery of an unusual contrail near the coast of California. The now notorious plume initially baffled commentators as it seemed to point vertically into space and appeared larger than a standard airplane contrail.
The reality, which trickled out in the days following the uproar, turned out to be far less dramatic than some of the more inventive theories circulating. Most experts now say the mysterious plume was the product of a jet. The time of day and the particular trajectory of the jet conspired to create the illusion.
Sure, it might seem like a letdown, but here at What on Earth we would argue that jet contrails are perfectly fascinating in their own right. Where on Earth do they come from? The cirrus-cloud like condensation trails form when water vapor condenses and freezes around tiny airborne particles called aerosols that spill from jet engines.
NASA Langley Research Center, in Hampton, Va., hosts a thorough website that’s well-worth a look for those who happen to be contrail-curious. Langley points out, for example, that contrails are hardly monolithic, noting that there are actually three major varieties of contrails: short-lived, persistent, and persistent spreading. Here’s how Langley describes the three types:
Short-lived contrails look like short white lines following along behind the plane, disappearing almost as fast as the airplane goes across the sky, perhaps lasting only a few minutes or less. The air that the airplane is passing through is somewhat moist, and there is only a small amount of water vapor available to form a contrail. The ice particles that do form quickly return again to a vapor state.
Persistent (non-spreading) contrails look like long white lines that remain visible after the airplane has disappeared. This shows that the air where the airplane is flying is quite humid, and there is a large amount of water vapor available to form a contrail. Persistent contrails can be further divided into two classes: those that spread and those that don’t. Persistent contrails look like long, narrow white pencil-lines across the sky.
Persistent spreading contrails look like long, broad, fuzzy white lines. This is the type most likely to affect climate because they cover a larger area and last longer than short-lived or persistent contrails.
Meanwhile, Our Changing Planet, a book co-edited by a number of NASA scientists that offers a good overview of remote sensing, devotes a chapter to climate impacts of the ubiquitous artificial clouds. Via Our Changing Planet:
Persistent contrails also play a role in climate because they reflect sunlight and trap infrared radiation just like their naturally formed cousins. Thus, the presence of a contrail cluster in an otherwise clear sky can diminish the amount of solar energy reaching the surface during the daytime and increase the amount of infrared radiation absorbed in the atmosphere at all times of day. Currently, the overall impact appears to be a warming effect, but research is continuing to unravel the role of this phenomenon in climate change.
Another interesting tidbit from Our Changing Planet:
Persistent contrails can often grow into natural-looking cirrus clouds within a few hours, a phenomenon that is best observed from space. Although they typically last for only 4-6 hours, some clusters have been observed to last more than 14 hours and travel thousands of kilometers before dissipating. These persistent contrails are estimated to have caused cirrus cloud cover to rise by three percent between 1971 and 1996 over the United States and are well-correlated with rising temperatures, though not the only cause of them. Increasing traffic in nearly every country of the world will cause a rise in global cirrus coverage unless the upper troposphere dries out or advances in air traffic management and weather forecasting or in aircraft propulsion systems can be used to minimized contrail formation.
Indeed. Take a look at this mesmerizing data visualization of just a mere day of air traffic…
–Adam Voiland, NASA’s Earth Science News Team
Photo above of contrails in a star pattern by John Pertig, courtesy of NASA Langley Research Center.
Earth Buzz: Mount Merapi, AGU Blogosphere, and More
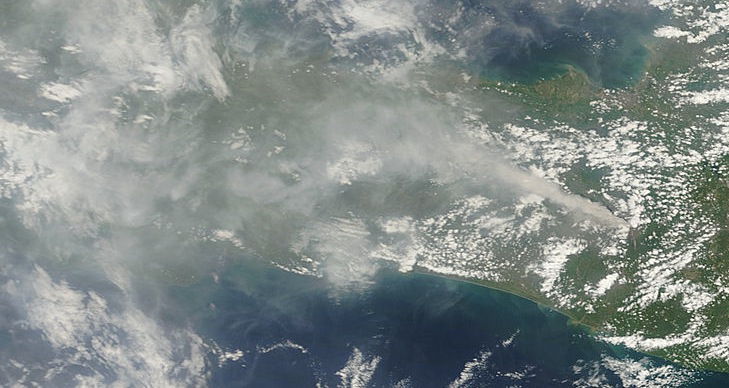
Merapi Blast Lingers
Nearly three weeks ago, Indonesia’s notoriously capricious Mount Merapi roared to life and began to fling towering plumes of ash and gas aloft. NASA’s MODIS instrument on the Terra satellite captured this image of the now waning eruption Wednesday. (MODIS Rapid Response)
AGU Launches Blogging Network
Confusions about a supposed AGU-sponsored misinformation response team aside, it is true that the American Geophysical Union recently launched a new blog network that is well worth a look. One of their bloggers is writing about how reporters can avoid making common mistakes when covering volcanoes. (AGU blogosphere)
Making Sense of Multiyear Ice Melt
A new study has quantified the amount ofolder and thicker “multiyear” sea ice lost from the Arctic via melting. “[The] results show that thick multiyear sea ice is not immune tomelt in the Pacific sector of the Arctic Ocean in today’s climate,” the author of the study said. (NASA Portal)
Tiny Particles, Big Impact
Despite their small size, tiny airborne particles called aerosols have major impacts on our climate. The problem: despite considerable advances in recent decades, estimating the precise climate impacts of aerosols remains an immature science. (Earth Observatory)
Overselling an Image
A picture can say a thousand words, especially if you are trying to explain earth science. But images can also mislead if not presented with care. One of NASA’s data visualization specialists explains one of his pet peeves: vertical exaggeration. (Elegant Figures)
Ed Begley Jr. on Climate
The Emmy award-winning actor and environmentalist guest blogs for My Big Fat Planet, and he’s hoping climate deniers are right. (My Big Fat Planet)
The Adventures of IceBridge
NASA scientists are back in the Southern Hemisphere flying IceBridge missions to Antarctica. Track their progress on the IceBridge blog and Twitter feed. (IceBridge)
Russian Fires Revisited
Remember the raging wildfires that paralyzed Moscow during the summer? A group from Goddard has released a new information that highlights the meteorological ingredients that fueled the disaster. (GES DISC)
Tweet of the Week
Veterans Day photo of the NASA DC-8 contrail taken from the Amundsen-Scott South Pole station on November 4 http://twitpic.com/35wqgw (IceBridge)
Image courtesy of NASA’s MODIS Rapid Response Team
Volcano Music
What on Earth was that sound? Was it a bird? A plane? A humpbacked whale?
No, it was fiercely hot gas whooshing through the guts of a volcano — Arenal Volcano in Costa Rica, to be precise. Milton Garces, the director of the Infrasound Laboratory at the University of Hawaii, Manoa, recorded the sound clip we posted last week.
Garces explains the phenomenon this way:
“Much like human voicings are defined by the combination of air flow through the vocal chords, tract, and mouth shapes, this harmonic tremor sound is shaped by the interaction of volcanic gases as they are released and flow through open conduits.”
NASA satellites have got Earth’s volcanoes covered from orbit. They provide round-the-clock monitoring of volcanic eruptions in progress or those possibly on the way. Just two of the satellites used to monitor volcanic activity are Aqua (with its MODIS instrument) and Terra (with its ASTER instrument).
Volcanologists use the satellite data from NASA’s fleet to detect heat and telltale volcanic gases emanating from volcanic vents. Also, Global Positioning System satellite devices allow researchers to gauge subtle changes in the land surface near volcanoes.
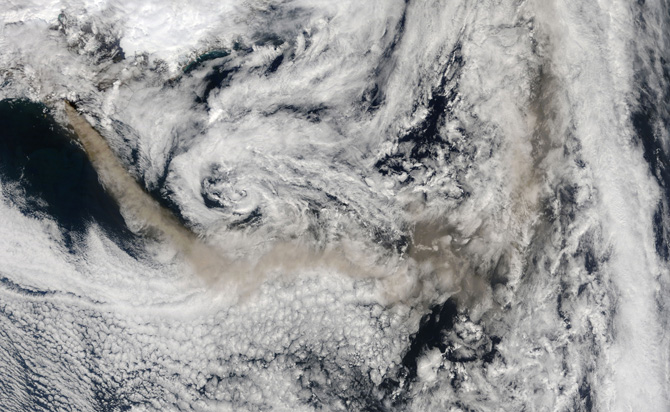
And once a volcano pops off, NASA satellites track drifting ash clouds that could threaten aircraft. (You may recall the shenanigans of a certain unpronounceable Icelandic volcano, Eyjafjallajökull, earlier this year.)
As the NASA birds pass silently overhead, Garces clambers up live volcanoes to record their subterranean rumblings. He uses the sounds to diagnose the physical status of volcanic plumbing systems – for example, whether they might be recharging with molten rock (magma) and getting ready to erupt.
These very low frequency waves are called infrasound. In fact, they are too low in their raw form to be audible to humans. So Garces speeds them up artificially to a frequency range the human hearing can detect. Here’s how he explained it to us:
“This signal, which has been sped up by a factor a hundred to make it audible, in reality has a dominant periodicity of about 1 cycle per second (1 Hz). In the field, it sounds like a chugging sound with 1 s puffs, and it is not tonal at all. We lose our sense of tonality at frequencies below around 16 Hz, so infrasound, however harmonious, will be perceived by us more like a beat than a tune.”
In other words, volcano infrasound is pretty interesting to a scientist, but you can’t dance to it — or at least it would be the ultimate slow dance.
— Daniel Pendick, Geeked on Goddard; Eyjafjallajokull image courtesy of NASA Goddard’s MODIS Rapid Response Team
Halloween Edition: What On Earth is That?
Geeked on Goddard’s Dan Pendick offers up an eerie “What On Earth is That” sound for Halloween. As always, post your guesses in the comments, and check back next week for the answer…
What On Earth is That?
The A-Train Meets NASA Edge
Live television from the A-Train symposium in New Orleans courtesy of the unscripted, unpredictable, and always entertaining folks from NASA Edge. Watch the full show here.
NASA's Pouring Funds, Scientists and Satellites into Pakistan Flood Warning
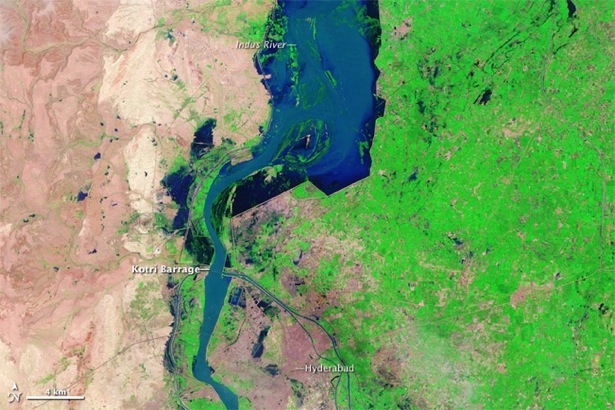
In July 2010, monsoon rains came to Pakistan in a Biblical way. Three months’ worth of rain fell in just one week. Historic flooding ensued in the weeks to follow — spanning 600 miles along the flood zone of the Indus River Valley — taking the lives of as many as 1,600 people. The flood waters also displaced as many as 20 million.
If only the warnings of historic flooding had come more swiftly and more accurately, it’s possible some of those who perished could have lived to tell about it. Countless numbers of the nearly 2 million homes destroyed might still be standing. And relief aid to refugees of the floods might have reached villages in need with greater precision and speed. If only…
Humanitarian aid efforts in the months after the flooding have been generous, but have paled in comparison with Haitian earthquake relief, and the world’s response to the aftermath of the 2004 Asian tsunami. But, additional assistance continues to arrive. In at least one instance that assistance hails in part from an unconventional source – NASA — with a native son of Pakistan leading the charge.
Growing up in a rural mountainous area near Gilgit, Pakistan, Sadiq Khan never experienced first-hand any of the devastation that more often than not wreaks havoc on the country’s densely populated, lower lying regions like Punjab and Sindh. But, a few years following the untimely death of a friend in the 2005 earthquake that killed upwards of 85,000, Khan, a graduate research assistant at the University of Oklahoma (OU), along with associate professor Yang Hong of the school’s Remote Sensing Hydrology Group, developed a proposal to build Pakistan’s capacity to reduce the risk of life and agricultural damage during natural disasters. And a specific proposal focus – developing an early warning system for flooding – would prove serendipitous.
On the heels of the catastrophic floods, Khan and Hong received a half-million dollar grant in August for their three-year project from the Pakistan – U.S. Science and Technology Cooperation Program that Pakistan’s government and the U.S. Agency for International Development are funding. Of the 28 projects (out of 270 applications) chosen for funding, Khan’s ranked as the most relevant to society.
“Pakistan has been limited by a lack of human resources, training for personnel, and data availability,” said Khan, who is also a 2008-2011 NASA Earth Sciences Graduate Fellow. “So, the reliability of the current flood-warning system in Pakistan is poor, and likely the reason flood mortality was unusually high. They’re using an older generation of hydrologic models, probably from the 1980s, that don’t require remote sensing data.”
 So, where does NASA come in? Well, Khan, NASA collaborator Shahid Habib, head of applied sciences at NASA’s Goddard Space Flight Center, and other colleagues will work to train Pakistani scientists to access and use free data from several of NASA’s remote sensing satellites in what are called predictive hydrometeorological models. These models can improve the ability to forecast floods accurately and with more warning time.
Starting in mid-November, Khan and others will begin three years of training researchers at the National University of Science and Technology in Islamabad to use a flood model they developed at OU in collaboration with NASA that makes use of a lot of NASA data.
They’ll use precipitation data from NASA’s Tropical Rainfall Measurement Mission satellite, because heavy rain causes most of flooding. The model also uses a whopping amount of other NASA remote-sensing information: digital elevation (Digital Elevation Model), topographical (Shuttle Radar Topography Mission), radiometry (Advanced Spaceborne Thermal Emission and Reflection Radiometer), and land cover data (from an instrument aboard NASA’s Terra and Aqua satellites), as well as soil moisture estimates from Advanced Microwave Scanning Radiometer – Earth Observing System Advanced Microwave Scanning Radiometer – Earth Observing System.
“The plains agricultural regions – the ‘bread basket’ of Pakistan – suffered extreme damage in the floods and the deaths were heartbreaking,” Khan explained. “So, it’ll be an honor for me to go back home, visit affected areas that are home to more than 100 million people, evaluate needs, and work with my government to create a 21st-century flood-warning system that can prevent this level of suffering from flooding from occurring again.”
— Gretchen Cook-Anderson, NASA’s Earth Science News Team; Images courtesy of the NASA Earth Observatory (top) and Sadiq Khan (bottom).
Some Tunes to Get Into An A-Train State of Mind
Each afternoon, some 705 kilometers (438 miles) above the surface, a parade of Earth-observing satellites soar across the equator. Chances are you’ve never heard of them since the close-flying satellites keep a far lower profile than, say, attention hogs like Hubble or the International Space Station.
Still, anybody who cares about the future of Earth’s climate ought to keep an eye on the cluster of satellites, which are known collectively as the A-Train. The A-Train has emerged as one of the best tools that Earth scientists have for understanding the nuances of the climate. Their unique tight-flying formation makes it possible to study the same patch of Earth’s atmosphere and surface from multiple perspectives. This makes A-Train measurements — particularly of difficult-to-study clouds and aerosols — richer and more robust than those individual instruments can provide.
Four satellites — Aura, CALIPSO, CloudSat, and Aqua — make up the A-Train today. Three more — Glory, OCO-2, and GCOM-W1 — are slated to join by 2013. The train of satellites — some flying just about 15 minutes from one another — cross the equator at 1:30 PM each afternoon. (That, in part, is why there that “A” in the name; A stands for “afternoon.” Less known is the fact that it was a NASA earth scientist who helped coin the name as a reference to Billy Strayhorn’s “Take the A Train” jazz standard, which became a signature tune of the Duke Ellington orchestra.)
Want to find out more? Well, you can try to spot the A-Train satellites with a pair of binoculars or powerful telescope (though they’re not particularly bright). You can track the trajectory of A-Train satellites in real time on websites such as this. (Here’s Aqua, for example). Or if you’re feeling ambitious, you can slog through A-Train data on Goddard’s A-Train Data Depot. This excellent Physics Today article has some good A-Train info, as does NASA’s A-Train website and that of the 2nd A-Train symposium, which kicked off in earnest this morning in New Orleans.
But, my advice: kick back, crank up the volume on Duke Ellington and Ella Fitzgerald to get yourself in an A-Train state of mind, and just watch the satellites zip around the planet in the animations above and below. The bottom set shows what the A-Train will look like when Glory joins; the top set shows A-Train measurements of Tropical Storm Debbie.
–Adam Voiland, NASA’s Earth Science News Team
Earth Buzz: Weather Satellites, A Solar Stumper, and More
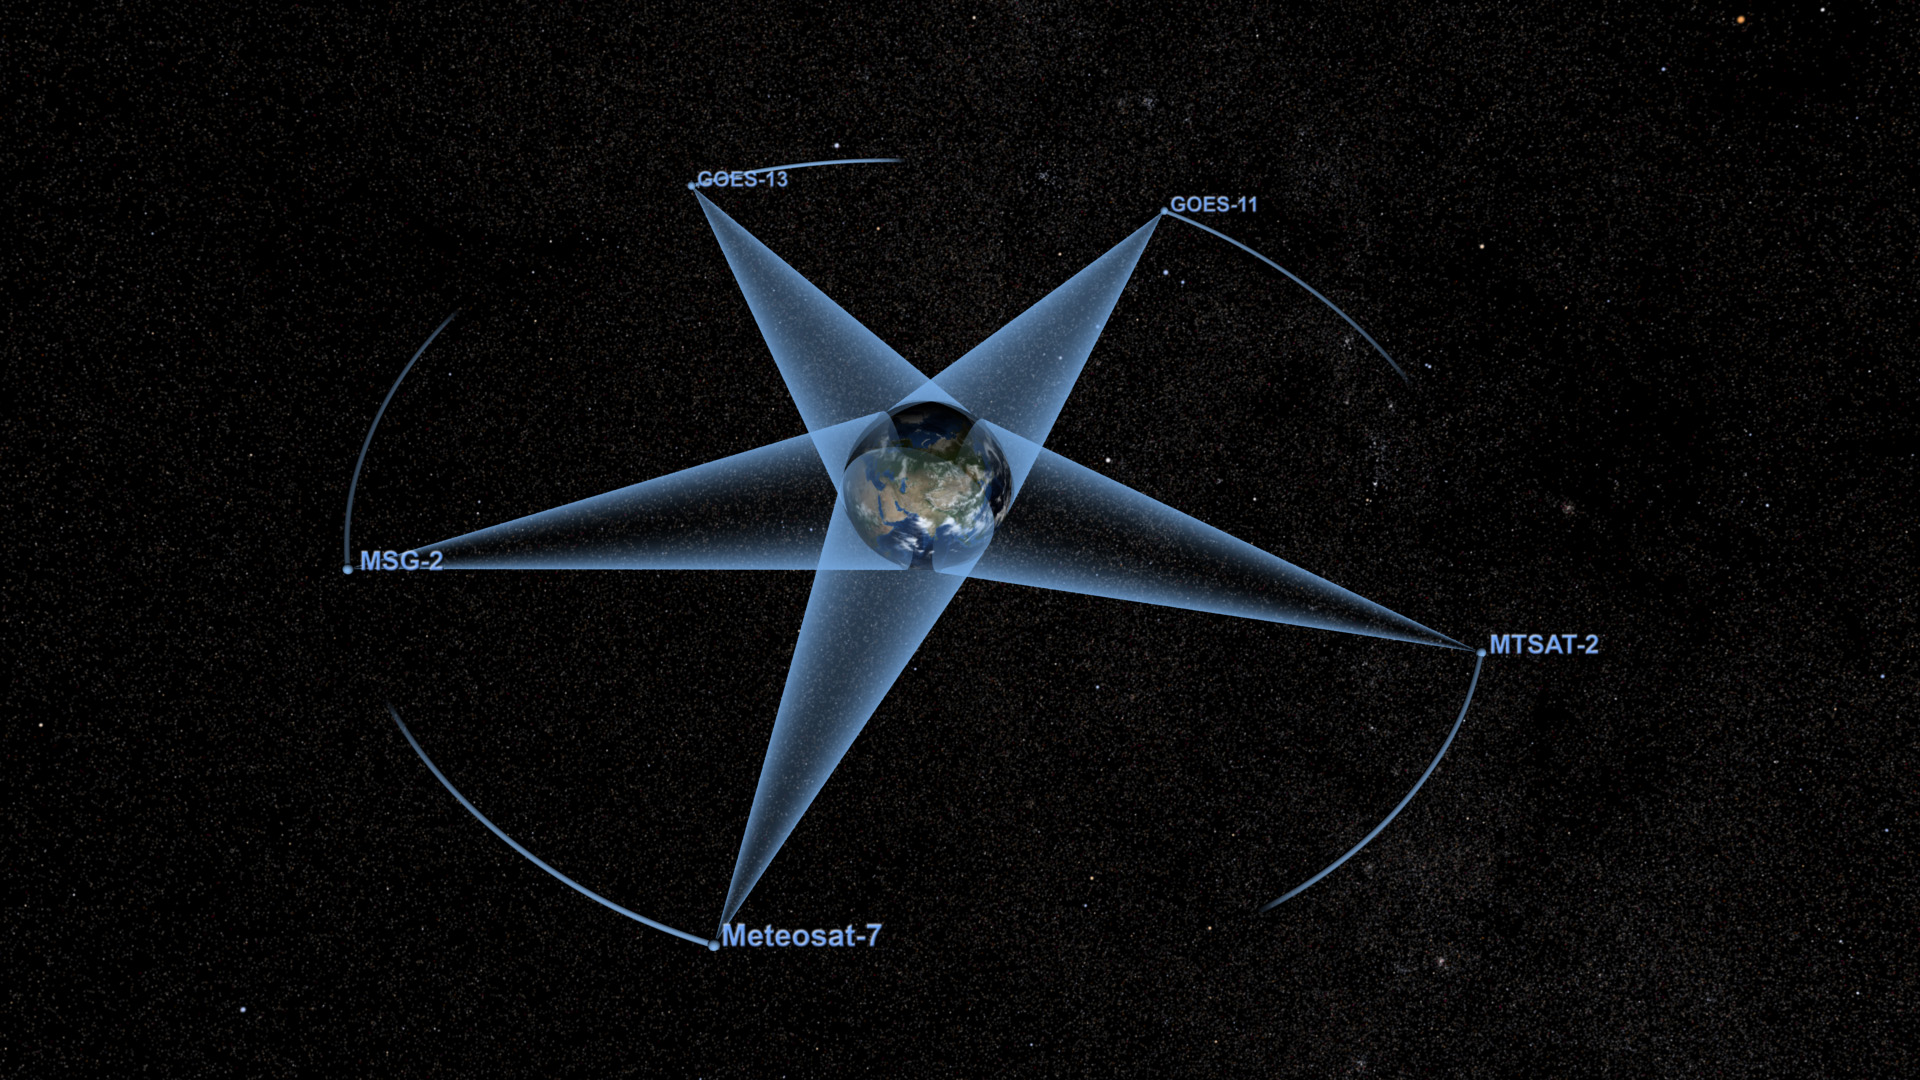
Look Up
Fabulous new animation shows orbital paths of weather satellites. (GSFC SVS)
Antarctica, Here We Come
Operation IceBridge heads to Chile to begin a new phase of its campaign. (NASA Explorer)
Solar Spectral Stumper
Every now and then Nature throws scientists a curve ball — such as (ifthey turn out to be right) these provocative finding about the sun’sspectral irradiance. (RealClimate)
Sorry, Water Vapor
It’s actually carbon dioxide that controls Earth’s temperature. (NASA.gov)
Food For Thought
Ten things you probably don’t know about Earth. (NASA Global Climate Change)
Get On Board
Scientists from across the country are prepping for next week’s A-Train meeting in New Orleans. (Langley)
Fire Breathing Storms
Pyrocumulonimbus: the fire-breathing dragon of clouds. (Langley)
Tweet of the Week
Whoa, the sun just got mooned! SDO Observed its First Lunar Transit HD Video here: http://bit.ly/djeEnU & #photo here: http://bit.ly/d8Wc8l (NASA_GoddardPix)
–Adam Voiland, NASA’s Earth Science News Team, Image courtesy of Goddard Space Flight Center’s Scientific Visualization Studio