What to Expect from the Arctic

Guest science writer KarenRomano Young reports from the ICESCAPEmission:
The U.S. Coast Guard Cutter Healy, our chunky red-and-white icebreaker, sits at the gates of the Arctic Ocean. In the wee hours this morning, the sun set and quickly rose again, and a rainbow stretched up into low clouds. The ICESCAPE mission had reached station 5 of a seven-stop transect of the Bering Strait, between Fairway Rock — resembling Kong Island, but with pointy ears — and Little Diomede (U.S.) — something like the “Cliffs of Insanity” in The Princess Bride. Close by is Big Diomede (Russia), topped with fog.

Movie references aside, this is a dramatic spot in which to find yourself when you wake up in the morning — or in the evening, as is the case for the half of the science crew working the night shift to process the samples.

It seems that no matter how many times a scientist has been to sea, it doesn’t get old. Greg Mitchell (below right), a specialist in ocean optics from the Scripps Institution of Oceanography, reckons he has spent about four years of his life aboard ships. His first trip to the Arctic was in 1987, his first year at Scripps. Mitchell’s research has taken him all over the world — to Antarctica and back again many times — but he hasn’t been inside the Arctic Circle since 1989. He expects change. Greg Mitchell

Observing the system…..and how it interacts with the edge of the sea ice…..and what’s going on with the ice melt…..and how it affects the ocean…..those principles won’t be any different than they were 20 years ago. “What we’re clearly seeing is that the sea ice is reducing more and more all the time,” said Mitchell. “This means less sunshine reflecting off the ice back into space, and more getting into the ocean.”

He expects the increase in sun-light on the sea to do three things:

  • “The light that’s not reflected will heat the ocean, accelerating the warming and accelerating the melting of the sea ice.”
  • “As the ocean warms it becomes more stratified. If you dive in a lake in the summertime, it’s warmer at the surface. But as you dive down, you feel the cold. That’s because the warm water is lighter than the cold water, and it stays at the surface. That’s thermal stratification. As you warm the ocean, it’ll stratify more and that will create a warm layer with a lot of light for algae to bloom (as long as they have nutrients).”
  • “More light in the ocean should cause more total photosynthesis in the Arctic, so we’ll lose habitat for polar bears but we’ll gain habitat for plankton.”

Like the rest of us, Mitchell is concerned about that. “I’m not saying it’s a good trade off. I think we should leave things alone. But the system’s changing, and as it changes we don’t know what the consequences of those changes will be. It’s hard to say what we could do. What we really need to do is to find a way for humans to have smaller footprint on earth. So we need to understand the processes better and then we need to model it.”

That’s why he’s here.

Mitchell, along with his group from Scripps, is involved in ground-truthing the optical properties of the Arctic Ocean (photos at the top and bottom of this post). That is, he’s helping to ensure that what they see at the surface squares up with the methods NASA satellites use to assess ocean color, an indicator of the level of chlorophyll and, by proxy, phytoplankton. NASA’s satellites measure the color of the ocean by flying over the earth and picking up blue, blue green, and green. If there’s not a lot of algae, the ocean is blue. If there is a lot of algae, the ocean is green.

But color is just one way of looking at phytoplankton levels. In order to truly assess the situation — for example how much carbon dioxide the phytoplankton are taking in – scientists need to assess the processes at work in the sea. “The optics don’t tell us this, so we have to take water samples, process the water, and then relate that to the optics we measure from the ship,” Mitchell said.

The global mapping you can see on the NASA site uses mathematical equations developed from the shipboard work. Satellite validation and calibration is based on the findings of scientists who go to sea and study the water to see what’s living there. Mitchell’s research group claims responsibility for about 20 percent of the global observations used by NASA for their models to convert satellite-measured optical measurements to chlorophyll estimates.

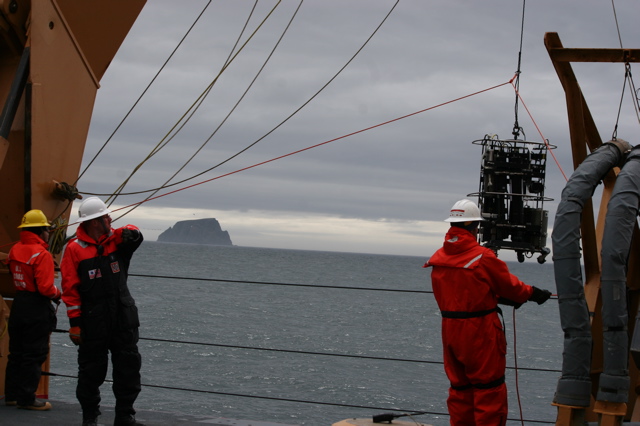
lowering gear from the Healy

The data contributes to models that allow prediction of primary production — the growth and health of organisms — under various conditions. Mitchell’s instruments include a small optical profiler — a fish-shaped instrument lowered from the Healy’s bow — and an optical package of instruments that measure water properties when it is lowered from the powerful A-frame at the stern.

“As ecologists, we don’t want to just know what color the ocean is,” he said. “We want to know how much plankton there is.” He walks to the edge of the ship and looks over the rail. “Now what we’re seeing out here is green water. There’s a lot of chlorophyll.” That means a strong pulse of phytoplankton, busy photosynthesizing the extra sunlight.

All photos shot by and courtesy of Karen Romano Young

Beautiful Radiance

Karen Romano Young (right), a freelance writer and illustrator embedded with NASA’s ICESCAPE field campaign, sent this report from an icebreaker headed to the Arctic. You can follow the expedition on the ICESCAPE blog

Here on the U.S. Coast Guard Cutter Healy, heading north toward sampling stations in the Bering Strait, there’s plenty of light — a beautiful radiance nearly around the clock. Since arriving in Alaska on June 12, I’ve only awakened once in the middle of the night to find it dark. Last night at nearly 11 p.m., I sat drinking tea in front of my porthole, and saw a rainbow descend between strips of clouds into the grey Bering Sea. We’re in the land of the midnight sun, and as we continue north the night light will grow longer. It’s the opposite of the conditions that lead to Seasonal Affective Disorder down south where I come from (Connecticut!) For me, it’s joy.

Up here where there used to be more ice, the radiance is, well, radiating. This is the key: the Arctic ice reflects sunlight back into space. If there’s no ice, the sunlight goes into the water, warming it, and creating an environment in which phytoplankton — tiny plantlike algae at the water’s surface — can thrive. There’s less ice because our atmosphere is trapping greenhouse gases — carbon dioxide and methane — and the result is a warming Arctic.

Many of the 40-plus scientists participating in ICESCAPE, a NASA-led research cruise, are involved in studying the effects of sunlight. ICESCAPE stands for Impacts of Climate Change on the Eco-System of the Arctic Pacific Environment, and its purpose is to bring ice scientists and ocean scientists together to gather a greater understanding of the conditions in the Bering, Chukchi, and Beaufort Seas.

Who better to begin a discussion of the sun’s warming effects than a University of Washington scientist named Bonnie Light? Light has been working in the Arctic Ocean since 1998 when, as a grad student, she boarded the Canadian icebreaker Des Grosseilliers, which had purposely pulled up to the edge of the 1997 autumn ice and got fro-zen in through the 1998 thaw. That was the SHEBA (Surface Heat Budget of the Arctic) project, designed to increase understanding of the Arctic system.

Getting frozen in to the ice was a nod to the so-called “father of Arctic science,” Fridtjof Nansen, who purposely did the same a century earlier to prove his theory that the ice cap drifted. One of the purposes of SHEBA was to provide a baseline for under-standing Arctic conditions that might be affected by global warming. Several other scientists aboard ICESCAPE also participated in SHEBA, including Bonnie’s group leader and co-chief scientist Don Perovich.

The flight to the SHEBA site from Barrow, Alaska — the northernmost city in the United States — was the first time Light saw sea ice. “I’d calculated the total square kilometers that the Arctic ice cap occupies many, many times,” she said, “but to be in a little air-plane and fly over it and just see it…this endless stretch of pack ice was really striking.” During the ICESCAPE cruise she is eager to explore the western coast of Alaska for the first time.

“People have told me that the sea ice in the Chukchi Sea has already begun to open up and is very loose this year,” Light says. She expects to be one of the “ice party,” the group of scientists that descends from the deck of the Healy (shown left), via a basket dangling from a crane, to work on the ice. “I don’t know if we’ll get out on it or not. We’ll have to just wait and see what it looks like when we get there. It’s something I’m not sure a satellite can tell you.”

Light is interested in the physics of solar irradiance – what happens to the sun’s light in ice on a small-scale, but also at the larger scale of the melt ponds that form atop sea ice. One of the experiments she’ll conduct involves a comparison of how sun radiates through bare ice and ice that has a melt pond on top. “We already know that melt ponds make really good skylights,” she says. But could they accelerate melting of already-melting ice, hastening the tipping point between ice cover and open sea? Bonnie Light’s ICESCAPE experience could tell.

Image Information: Courtesy of the U.S. Coast Guard (bottom left) and Karen Romano Young (top right).

Working (Very) Remotely

If you are trying to view this post on Internet Explorer, please use Firefox or Safari instead. We are experiencing a technical problem with the slideshow on Internet Explorer. You can also view the slideshow on Flickr.

Bryan Fabbri, Fred Denn, and Bob Arduini typically drive to their jobs at NASA’s Langley Research Center in Hampton, Va. But then there are a few days each month when they take the helicopter instead.

The three scientists are part of the small, hands-on team that maintains a suite of meteorological and climate-observing instruments on the Chesapeake Light, a platform lighthouse 15 miles off the Virginia coast in the Atlantic Ocean.

The instruments record air and sea surface temperature, the amount of sunlight and heat absorbed and reflected by the ocean surface, wind speed, aerosol composition, and on and on. The measurements are made to validate the observations made by the Langley-managed Clouds and the Earth’s Radiant Energy System (CERES).

The CERES satellite instruments have been operating for more than a decade, creating a long-term record of a key driver of Earth’s climate – the balance of incoming and outgoing solar radiation known as the “energy budget.” And the instruments that Fabbri, Denn and Arduini maintain on Chesapeake Light serve to validate the observations CERES makes over the oceans. The project is called COVE (CERES Ocean Validation Experiment) and began along with CERES more than a decade ago.

In a job that usually demands a lot of time crunching data in front of a computer screen, the regular trips to the lighthouse offer a chance for something different. They also highlight a side of science that isn’t often discussed: the grunt work of making sure your instruments are working properly…or haven’t corroded in the humid salt-air…or haven’t blown off the platform with an open-ocean gust. If the sensors aren’t working properly, CERES observations over the ocean would be much more difficult to validate.

It doesn’t hurt that this important work means getting out in the middle of the ocean every now and then.

“You can’t beat that part of it,” Fabbri said. “I get a little stir crazy. I like getting out of the office and out there to work on the instruments. It doesn’t hurt to take the helicopter out.”

— By Patrick Lynch, NASA’s Langley Research Center


Same Words But Different Meanings

Earth scientists milling around the lobby during coffee breaks at this year’s AGU had something unusual to mull over this year.  A phalanx of colorful posters, created by a visual communicator who describes herself as a note taker on steroids, adorned the lobby of the Moscone Center. Snippets from the illustrated notes offer a fascinating look into some of the brainstorming sessions that have taken place about communicating climate science. AGU intstalled the posters at a fitting time: it’s been a disorienting month for climate scientists who have watched seemingly specious charges of scientific malpractice become a major news item.

One of the posters — called Communicating with Congress (and Everybody Else) — brainstorms some of the pitfalls that make communicating climate science such a challenge. High on the list: jargon. Scientists use such a specialized language that it can be difficult for non-scientists — even for those of us who cover the topic regularly — to distill the meaning from certain scientific presentations or articles. Complicating matters more, there are some words that have distinctly different meanings to scientists and the public. The poster highlighted a handful of them. I’ve taken the liberty of elaborating upon and defining a few of them below. 

Did you know the difference?  Have any good examples to add to the list?

Aerosols
The Public: Spray cans that dispense a liquid mist, many of which damage Earth’s ozone layer.

Scientists: A suspension of any solid or liquid droplet in the atmosphere. Includes dust, soot, pollen, sea salt, sulfates and more. More details about aerosols. 

Radiation
The Public: Harmful material that leaks from nuclear material and is used to battle cancer.
Scientists: Energy that comes from a source and travels through some material or space. Includes electromagnetic radiation such as radio waves, infrared light, visible light, ultraviolet light, and X-rays.  More details about
electromagnetic radiation.

Ozone
The Public: Something over Antarctica that protects against cancer-causing light waves. 
Scientists: A molecule containing three oxygen atoms that functions as a harmful air pollutant near the surface, a greenhouse gas in the upper troposphere, and a buffer against ultraviolet radiation in the stratosphere. 
More details about ozone.

Bias
The Public: Willful manipulation of facts to suit political ideology.
Scientists: A term used to describe a statistical sample in which members of the sample are not equally likely to be chosen. Also a term used to describe the difference between an
estimator’s expectation and the true value of the parameter being estimated. For some scientific analyses, a certain degree of bias can actually be beneficial.


–Adam Voiland, NASA’s Earth Science News Team

Science at the Intersection of Air Quality and Climate Change


Smog over New York. Credit: NASA

The atmosphere is a stew of gases and particles. Some affect climate. Others degrade air quality and threaten human health. Some do both. Some do neither. Many of them interact with and affect one other.

Ozone, for example, causes respiratory problems near the surface, but also functions as a greenhouse gas. Black carbon aerosol particles do the same, and also contribute to heart disease.

Other pollutants — notably sulfates and nitrates—create health problems but simultaneously reflect incoming sunlight and cool the climate. Some, like nitrogen oxide, are precursors to ozone, but also affect the abundance of the light- scattering pollutants that cool the climate.

All of this adds up to a question that keeps some climatologists up at night: Is it possible to reduce emissions of toxic air pollutants in a way that will mitigate global warming, or at least not make it worse?

For example, reducing black carbon has the potential to improve health and reduce global temperatures by as much as a degree. On the other hand, reducing sulfates—which industries often emit along with black carbon—could negate any reduction in warming that pollution controls might produce. (These are just a few examples from the dozens of gases and particles that scientists have to factor in tabulating Earth’s energy budget.)

Almut Arneth, a researcher from Lund University in Sweden, and colleagues, including NASA climatologist Nadine Unger, considered the question recently in a “perspectives” piece in Science. You can read the full paper here (though you may need to brush up on your atmospheric chemistry to understand the details). Unger and her coauthors sum the complicated situation up this way:

“Given the toxicity of pollutants, the question is not whether ever stricter air pollution controls will be implemented, but when and where. The jury is out on whether air pollution control will accelerate or mitigate climate change. Still, the studies available to date mostly suggest that air pollution control will accelerate warming in the coming decades.”

If that’s correct, not only do we have a bigger climate problem on our hands than we may have thought, but some will surely misinterpret the finding by concluding that we ought to continue polluting—or even ramp up the emission of certain pollutants with geoengineering—to stave off climate change, a point that NASA climatologist Gavin Schmidt made recently on RealClimate.

–Adam Voiland, NASA’s Earth Science News Team

Rising Temperatures in the Midst of Heavy Snow?

The last few months have been a bit odd. Too much snow in the mid-Atlantic. Too little for the Winter Olympics in Vancouver. And a dusting nearly everywhere else. Meanwhile, a blizzard of confusing and often conflicting commentary has left many people asking: Is the climate really warming? Warming faster than ever? Or perhaps just weirding out?

Since NASA scientists have been tracking global temperatures and climate change for decades, we checked in with researchers from across the agency to get their take on the state of Earth’s climate (which, it’s worth noting, isn’t the same thing as Earth’s weather). The result is a collection of feature stories, videos, and web interactives that describe what we’ve found on NASA’s Global Climate Change Site. Here’s a sampling:

•     Why the Arctic Oscillation has made this winter one to remember (Article)

•     How the ocean’s natural rhythms can hide or accentuate global temperatures (Article)

•     Why the last decade has been the warmest on record (Article)

•     On the record about the temperature record (Q&A)

•     Piecing together the temperature puzzle (Video)

•    2009 Temperature update (Video)

•     Sorting out the squiqqles in the global temperature record (Interactive graphic)

•     Watching the world’s changing temperature (Data Visualization)

•     Snaps from space: The impact of a warming world (Image gallery)

–Adam Voiland, NASA’s Earth Science News Team

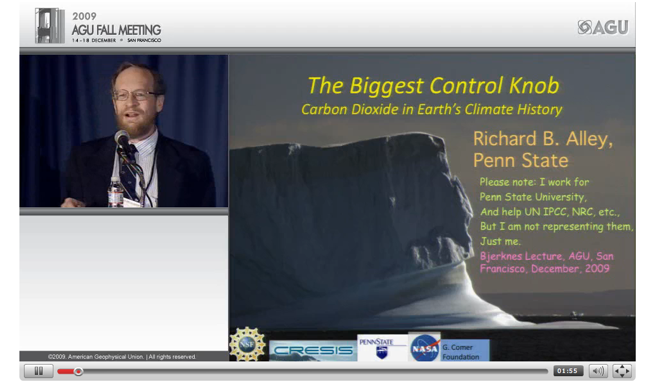
Richard Alley on Earth's Biggest Climate Control Knob


Click here for a multimedia presentation of Richard Alley’s AGU talk.  (Credit: AGU)

Scientists aren’t known for being the savviest of public speakers, but Penn State’s Richard Alley is that rare researcher who knows how to give a talk. Alley — who’s willing to sing, dance, and gesticulate vigorously to get a point across — gave a lecture about carbon dioxide to an overflow crowd of scientists at the American Geophysical Union meeting this year that’s well worth watching.

Blogger and University of Toronto computer scientist Steve Easterbrook has an excellent blow-by-blow of the talk, but the heart of it came down to this point, which Alley made on his last slide:

An increasing body of science indicates that CO2 has been the most important controller of Earth’s climate. 

If you want the details, (and the details are a pleasure to sit through in this case because of Alley’s gregarious speaking style) AGU has posted video and slides of the full talk. Still want to know more about carbon dioxide? NASA’s Jet Propulsion Laboratory (JPL) released new details about the distribution of carbon dioxide in the troposphere, the region of Earth’s atmosphere that is located between 5 to 12 kilometers, or 3 to 7 miles, above Earth’s surface. (JPL also released a ten question quiz about the gas that you can access here).  

Meanwhile, Alley participated in a NASA science update back in 2005 that explored the nature of sea level rise, a topic that NASA researchers continue to investigate and that you can explore interactively using our Sea Level Viewer.

–Adam Voiland, NASA’s Earth Science News Team

Greenhouse Molecules Laid Bare

The Earth is a bit like the human body; its temperature is very finely balanced, and when it gets slightly out of whack, big things can happen. In the case of our home planet, gases in the atmosphere play a vital role in maintaining this delicate equilibrium, by balancing the absorption and emission of all the electromagnetic radiation (microwaves, infrared waves, ultraviolet light and visible light, for example) reaching the surface of the Earth.

As reported recently, the Earth is getting warmer. Scientists believe the main driver behind this warming trend is rising levels of man-made greenhouse gases. These gases, which we pump out into the air, act to trap heat radiation near the surface of the Earth that would otherwise be sent back out into space. Carbon dioxide (CO2) is the Paris Hilton of greenhouse gases, and gets a lot of face time because its concentration in the atmosphere has increased relatively rapidly since the Industrial Revolution. But methane, nitrous oxide, hydrofluorocarbons (HFCs), chlorofluorocarbons (CFCs) and perfluorocarbons (PFCs) are also important agents of global warming. Some of them are actually much more potent than CO2 and they stick around for hundreds to thousands of years longer. This has some scientists concerned that these B-listers could actually impact global temperatures significantly more than CO2.

greenhouse warming cartoon

In a new paper, Partha Bera and colleagues at NASA’s Ames Research Center and Purdue University put these gases under the microscope to find out exactly why they are such powerful heat trappers. They focus on CFCs, HFCs and PFCs — all chemicals containing fluorine or chlorine — that are used in medicine, fridges, and as solvents, among other things. By probing the molecular structure of these compounds, they have found that molecules containing several fluorine atoms are especially strong greenhouse gases, for two reasons. First, unlike many other atmospheric molecules, they can absorb radiation that makes it through our atmosphere from space. Second, they absorb the radiation (and trap the heat) very efficiently, because of the nature of the fluorine bonds inside them. (In technical terms, fluorine atoms create a larger separation of electric charge within the molecule, and this helps the molecular bonds absorb electromagnetic radiation more effectively.) HFCs and other fluorine-based gases have been called “the worst greenhouse gases you’ve never heard of.” Now we know why.

Until now, scientists had not looked in detail at the underlying physical or chemical causes that make some molecules better global warmers than others. Bera and colleagues say that their work should help improve our “understanding [of] the physical characteristics of greenhouse gases, and specifically what makes an efficient greenhouse gas on a molecular level.” They hope their findings will be used by industry to develop more environmentally-friendly materials.

Amber Jenkins, NASA’s Global Climate Change team 

Tour NASA's New Climate Reel

We’re less than two weeks away from the United Nation’s long awaited Copenhagen Climate Change Conference. In anticipation of the event, NASA has compiled a climate resource reel that highlights ten of its most compelling climate videos and visualizations. 

Video topics range from a 3-D tour of the Earth’s rapidly changing cryosphere, and the unexpected role that honey bees can play as climate data collectors, to NASA’s efforts to understand the ozone layer. 

Two of the videos offer details about NASA’s new climate satellite GloryOne of them discusses Glory’s Total Irradiance Monitor, a sensor that will help monitor the sun’s fluctuations. The other  — titled Hello Crud — delves into the perplexing world of airborne particles called aerosols

You can see all ten of the top picks at NASA’s Global Climate Change website. Additional climate-related videos and animations are available through NASA’s Scientific Visualization Studio.


–Adam Voiland, NASA’s Earth Science News Team

How Do Global Soot Models Measure Up?


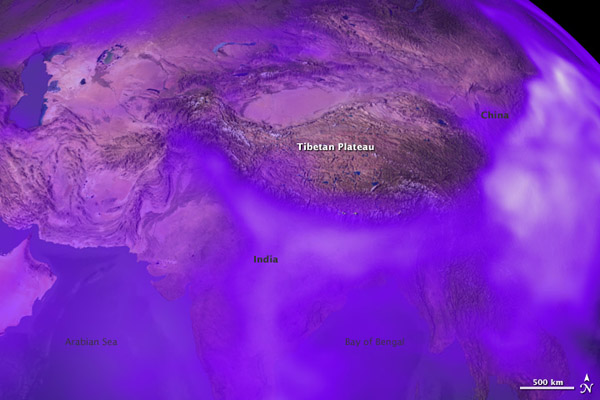
A image from a simulation that shows the spread of black carbon aerosols in Asia. Areas where the air was thick with
the pollution particles are white, while lower concentrations are transparent purple. (Credit:
Earth Observatory)

As NASA atmospheric scientist Eric Wilcox recently told Time magazine, emerging evidence suggests that a short-lived type of air pollution called black carbon—known popularly as soot—can exacerbate global warming by absorbing incoming solar radiation.

Yet pinning down precisely how much the black carbon exacerbates warming is no easy task, research conducted by Goddard Institute for Space Studies climatologist Dorothy Koch suggests. The study, published in Atmospheric Chemistry and Physics tracked how the predictions from 17 global black carbon models compared with actual measurements collected by airplane, satellite, and ground-based sensors. It shows, among other things, that models generally underestimate black carbon’s warming effect on climate.

Koch tested all the models in three ways. In the simplest of the three, she compared the models’ predictions to the amount of black carbon measured at the surface, finding that they matched real life reasonably well.

Her second test compared the models’ predictions to black carbon measurements made higher in the atmosphere using airplanes, and the results were much less clear cut. Though the models usually had too much black carbon over pollution sources, most had too little over remote regions such as the Arctic.

Koch’s final and most important test looked at how much solar radiation black carbon actually absorbs, an indicator of the amount of warming the particles actually produce. Again, the results were mixed. The models were largely accurate over North America and Europe, but were not for areas that have high levels of black carbon such as Central Africa, Southeast Asia, and the Amazon.

In a write-up on the Goddard Institute for Space Studies web site, Koch summarizes her findings this way:

We concluded from this study that most models have enough black carbon at ground level in polluted regions, too much in the atmosphere above source regions, but not enough in the Arctic where black carbon may play an important role in contributing to Arctic warming and ice/snow melt. The models’ soot generally does not absorb enough sunlight and therefore these models would underestimate black carbon heating effects. This probably results from underestimating the absorbing properties of the particles rather than the amount (mass) of black carbon.

Wondering how climate modelers can continue to close the gap between model predictions and reality? Koch put forward some advice on how to fine-tune the next generation of aerosols models. Her top three:

1) Account for mixing between black carbon and other components of the atmosphere,
2) Incorporate better measurements of particle size and source amount in some regions.
3) Continue to mine ongoing satellite and field campaigns for data about black carbon.

You can read more GISS science briefs and NASA news stories about black carbon here, here, and here.

–Adam Voiland, NASA’s Earth Science News Team