Can Climate Change Fuel Tornadoes?

Between April 25 and April 28, a record-breaking total of 362 tornadoes tore through the southeastern and central United States. Could climate change fuel such an unprecedented cluster of twisters? A number of commentators have addressed the question, but the most concise answer I’ve heard yet comes in the 36th minute of an On Point interview with NOAA tornado expert Harold Brooks. [The bolding is mine.]

On Point: When you look at the architecture of the weather that produced these storms can you tie it to global climate change? We’ve seen warning after warning saying that we may see an increase in storm conditions because of climate change.

Brooks: Well, the planet has undoubtedly warmed in the last 50 to 100 years. And it will undoubtedly continue to warm as greenhouse gases play a greater role. It’s not really clear what the connection is between tornadoes [and climate change] in particular. Some of the ingredients we look for in the production of supercells, such as the warm moist air at low levels, are going to increase in intensity and frequency and be supportive of supercell storms. On the other hand, one of the main predictions of climate change is that the equator to pole temperature difference will decrease because the poles will warm more than the equator. That’s related to the change of the winds with height term, which is one of the things that helps organize storms and make them more likely to produce tornadoes. That’s predicted to lessen as we go along. So we’ve got some ingredients that will be increasing in intensity and some that will be decreasing. If we look historically at the record and try to make some adjustments over the last 50 years for what we know is changes in reporting, we really see no correlation between occurrence and intensity and global surface temperatures or even the US national temperature.

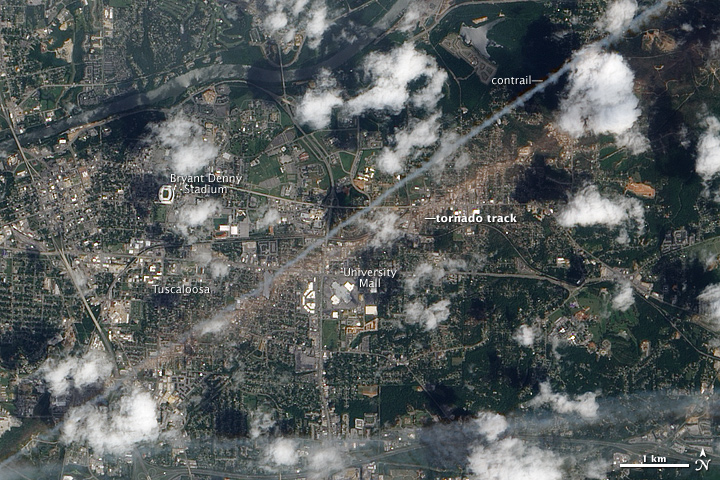
While scientists will surely continue to study this, one thing is quite certain: When tornadoes do come along, NASA will do all it can to track and monitor them and their aftermath using satellites and other assets. On May 2, 2011, for example, the NASA Earth Observatory reported that the Advanced Land Imager (ALI) on NASA’s Earth Observing-1 (EO-1) satellite captured the natural-color image above of a massive tornado’s destructive path through Tuscaloosa.

The trail of damage stretched 80.3 miles (129.2 kilometers) long and as much as 1.5 miles (2.4 kilometers) wide.The tan-toned, debris-filled path passes through the center of town, affecting both commercial and residential properties. The track passes south of Bryant Denny Stadium and just north of University Mall. The Tuscaloosa tornado caused more than 1,000 injuries and at least 65 deaths across several town and cities, the highest number of fatalities from a single tornado in the United States since May 25, 1955.      –Adam Voiland

For more information about this image, please visit this NASA Earth Observatory page.

Tsunami Hits Home for Goddard Scientist

On March 11, Teppei Yasunari, 31, a visiting scientist at Goddard Space Flight Center, heard that a massive earthquake off the coast of Japan had rocked his homeland and unleashed a deadly tsunami. For Yasunari, an atmospheric scientist who studies the climate effects of tiny airborne particles called aerosols, the frantic days that followed have offered powerful lessons in both patience and science communication as Yasunari grappled with the news that one of his best friends was missing and that a nuclear plant in Fukushima prefecture seemed poised to send a plume of radioactive steam aloft. We sat down with Yasunari to hear his perspective on the disaster.

WoE: You are both an Earth scientist and Japanese. What went through your mind when you heard about the tsunami?

Yasunari: Like everybody, I was shocked. There are no words to describe it. It was hard to believe the video clips I was seeing on the web.

WoE: I know you grew up in Kyoto and Tsukuba, but have you spent any time in Sendai?

Yasunari: Some. I went to undergraduate college in Aomori prefecture, which is not so far from Sendai. I have visited friends who live in Sendai a number of times. 

WoE: Were your friends from college ok?

Yasunari: One of the first things I did after I heard the news was try to contact one of my best friends from Hirosaki University who now lives in Iwate prefecture, which is just immediately north of Miyagi prefecture, the prefecture the earthquake hit the hardest. I tried emailing and calling, but I couldn’t get through. All lines of communication were down. I tried calling friends of friends. Nothing worked. Finally, I registered his name in Google Person Finder.

WoE: How long were you in limbo?

Yasunari: About three days. Finally, I saw something on Person Finder that said he was probably ok. A friend of his from grade school had heard from somebody else that a firefighter had found him. I later heard through Person Finder that he’d been moved to someone’s home, but I still haven’t been able to email or call him. On March 22, I did get an e-mail directly from him. He said his house has been completely destroyed by the tsunami. It was such a relief to have finally heard from him directly.

WoE: I imagine you must have been glued to the Internet looking for information. 

Yasunari: Yes, especially Twitter, Facebook, and Japanese SNS. Since the phone and power is out in some parts of Japan, these sites are often the quickest way to get information. My personal Twitter feed is @TJ_Yasbee.

WoE: Did you look to Twitter for scientific information about what was going on with the earthquake and nuclear plant?

Yasunari: Yes. Actually something surprising happened on Twitter. Since I have studied the long range transport of aerosols, I calculated some air mass transport patterns using the NOAA atmospheric dispersion model called HYSPLIT when I heard about the possibility of a radioactive plume, I wanted to help, so I made some simple figures that showed what direction, based on the model, a plume might move.

WoE: And you tweeted the figures? 
Yasunari: Yes. I only had less than 300 followers at that point. However, a physicist from the University of Tokyo, Ryugo Hayano, saw the figures and contacted me by email. He ended up tweeting his comments with my figure to his more than 40,000 followers. Neither of us could have imagined how quickly that tweet spread. It wasn’t long before newspapers were contacting me to use the figures. I couldn’t believe it.

WoE: Forty-thousand followers is quite a lot for a scientist.

Yasunari: He is well known. He tweets from @hayano. Now he has more than 150,000 followers in just a couple of days because of the earthquake. 

WoE: Did you see a surge of followers on Twitter as well? 

Yasunari: Yes, originally I had about 300. Now I have more than 2,100.

WoE: How did people react to the figures?

Yasunari: The model I made the figures with has quite a coarse resolution, and it can’t show any more than a broad view of how a plume might move. But people in Japan are so worried about the threat of radiation and eager for information that some of them treated it like it was very fine resolution and accurate. 

WoE: So did the newspapers end up using the figure?

Yasunari: In the end, in consultation with a scientist from NOAA, we decided that it would be more confusing than helpful for the public. We asked the newspapers not to use them, and I took them down from Twitter. I learned a lot from this.

WoE: You can’t really delete a tweet, though, can you?

Yasunari: No, but I had tweeted it through Twitpics, and professor Hayano had use a similar site called Plixi, so we were able to take the figures down.

WoE: It certainly raises interesting questions about social media and science communication. Do you wish you had never tweeted the figure in the first place?

Yasunari: Yes and no. The tweet was intended just for my small number of followers, but I never realized how quickly it would spread. Of course, I expected it would spread some, but I didn’t expect it to go viral. In the future, I will be much more aware that the public doesn’t pay much attention to the uncertainties when I show a figure.

At the same time, I wish they would. Twitter and other social media can be a very convenient way for scientists to communicate, so I don’t want to say that scientists should never use social media or have a blog. I guess the best thing to do is try to find a balance between showing too much information and too little.

WoE: What about your family? Were they affected by the earthquake? 

Yasunari: I contacted my family immediately after the earthquake. They were fine because they live in a western part of Japan, about 500 miles away from Sendai. We were extremely lucky. My father, also a scientist, was supposed to be in Sendai on business the day of the earthquake. Fortunately, he canceled the trip the day before he was suppose to leave because he was busy with other things. 

WoE: How lucky. Does your father also study aerosols and climate? 

Yasunari: No, but he is also an atmospheric scientist. He focuses on meteorology and climatology related to Asian monsoons. In fact, he has collaborated with Bill Lau, the chief of the branch I’m in at Goddard. Both Bill Lau and my father are examining the idea that aerosols can have an important impact on the monsoons — a hypothesis called the “elevated heat pump.”

WoE: Is that a topic that you study as well?

Yasunari: In some ways, yes. I recently published a paper that will help quantify how much black carbon and dust are affecting the rate of Himalayan glacier retreat. Another study, led by a scientist from the Pacific Northwest National Laboratory, cited both my paper and my father’s paper at the same time. It was the first time double Yasunari reference in the same paper.

WoE: Thanks for talking to us, and best of luck to your friend.

Yasunari: You’re welcome.  I know Japan will overcome this difficult situation.

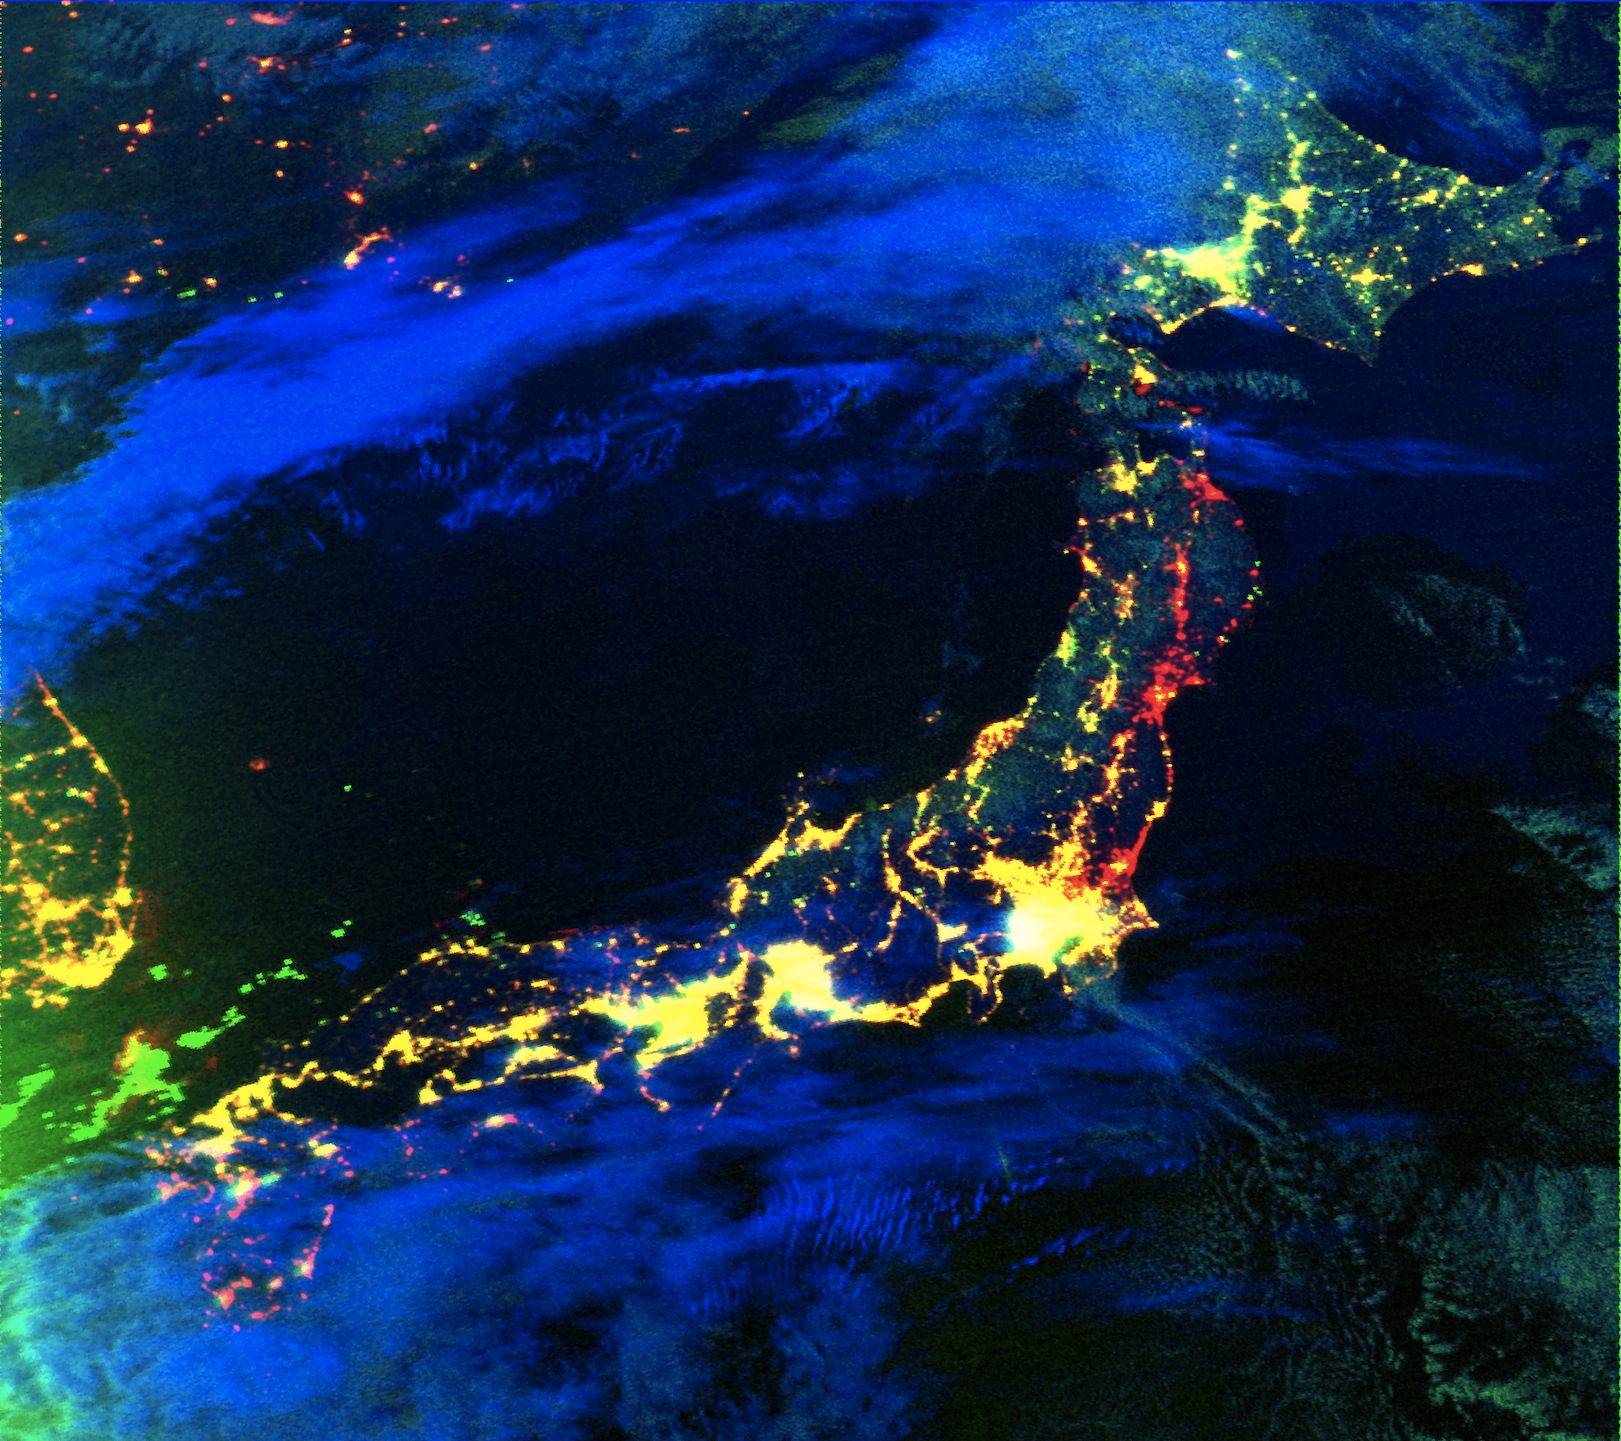
Top Image: A United States Air Force satellite observed the widespread loss of electricity in parts of northeastern Japan after the earthquake. The image, a composite, shows functioning electricity from 2010 and 2011. Red indicates power outages detected on March 12, 2011, compared to data from 2010. For more information about the map, please visit this page. Credit: NASA Earth Observatory/NOAA National Geophysical Data Center.

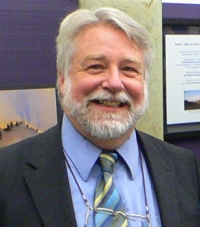
Middle Image: Teppei Yasunari in his office. Credit: NASA/Adam Voiland

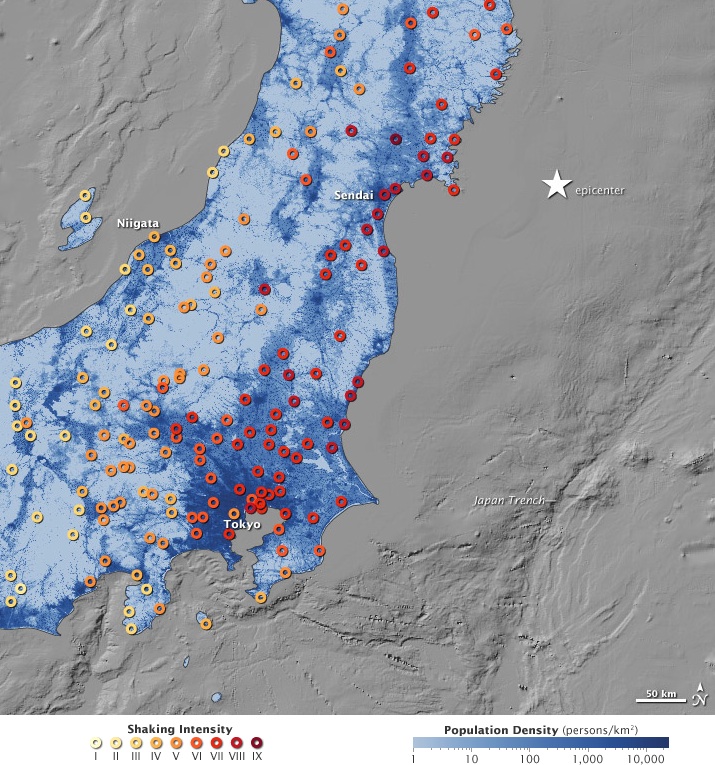
Lower Image: A shaking intensity map based on USGS data shows ground motion at multiple locations across Japan during the earthquake. A shaking intensity of VI is considered “strong” and can produce “light damage,” while a IX on the scale is described as “violent” and likely to produce “heavy damage. For more information about the map, please visit this page.  Credit: NASA Earth Observatory/Rob Simmon & Jesse Allen

–Adam Voiland, NASA’s Earth Science News Team
Can NASA Satellites Monitor Radiation Plumes from the Fukushima Disaster?


NASA is using multiple satellites and sensors to monitor the aftermath of the devastating earthquake and tsunami that rattled Japan on March 11.

However, NASA’s Earth-observing satellites are unable to directly measure radiation-containing plumes, such as those experts fear may have wafted from a damaged Japanese nuclear plant in Fukushima prefecture.

We checked in with Robert Cahalan, the head of Goddard Space Flight Center’s Climate and Radiation Branch and the project scientist for the SORCE satellite, to find out why. Here’s how Cahalan explained it:

“NASA could fly a drone directly into a cloud to detect radioactivity, but it’s not easy to measure the damaging radiation from the Fukushima plant with a satellite. 

The radiation consists mostly of negatively charged electrons from so-called “beta decay” of radioactive products of the nuclear fission reactions, as well as positively charged alpha particles, which are identical to a helium nucleus (for example, two protons and two neutrons all bound together into a single particle). 


NASA does have detectors in space that measure such charged particles, but the great majority of these particles don’t come from Earth. Rather, they come from the sun, which emits a very large number of charged particles in what is called the “solar wind” — which is especially intense when the sun is active. The particles can also come from sources outside our solar system, so-called galactic cosmic rays, or GCRs, that become more detectable when the sun is less active.

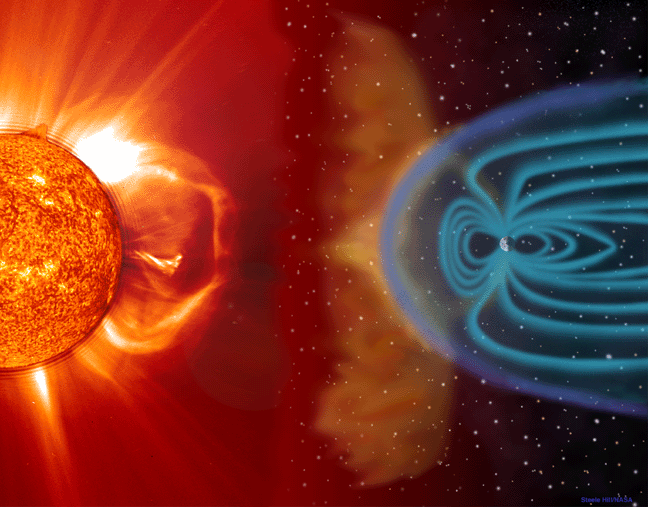
Fortunately, we humans down on Earth are protected from a lot of this particle radiation by Earth’s magnetic field, which steers charged particles along the field lines toward Earth’s magnetic poles, and thus acts as a shield for the human population. 

Trying to pick out the Fukushima radioactivity from the huge number of charged particles in outer space would be like finding the proverbial “needle in the haystack.” So, unfortunately, we have to rely on ground-based particle detectors, like the common Geiger counters that have been shown in use by the workers in their white hazmat suits in the tragic scenes in Japan.


There is also high-energy gamma radiation, which is electromagnetic radiation. Again, NASA has had the Compton Gamma Ray Observatory (GRO) in space, and now has FERMI. But these look for extremely intense bursts of gamma radiation that come from colliding galaxies, quasars, and other extreme events in the universe. The low flux of gamma radiation from the nuclear power plant is all absorbed in the Earth’s atmosphere, and never makes it into space. The only way we might detect some gamma radiation from Earth’s surface would be if we created a gamma ray burst by detonating a large nuclear bomb. That kind of event cannot happen in a nuclear reactor, even in the worst case of a core meltdown.

NASA’s Earth-observing satellites monitor many health related quantities including aerosols and ozone, nitrous oxides, and other constituents in the air we breathe, as well as fires, floods, and other events that impact life on Earth; however, near-Earth radioactivity can only be detected near the radioactive source, not by satellites.”

Visualization of solar wind and Earth’s magnetosphere courtesy of Steele Hill and NASA’s SOHO team. Visit this page for more information.

–Adam Voiland, NASA’s Earth Science News Team

Volcano Music


What on Earth was that sound? Was it a bird? A plane? A humpbacked whale?

No, it was fiercely hot gas whooshing through the guts of a volcano — Arenal Volcano in Costa Rica, to be precise. Milton Garces, the director of the Infrasound Laboratory at the University of Hawaii, Manoa, recorded the sound clip we posted last week.

Garces explains the phenomenon this way:

“Much like human voicings are defined by the combination of air flow through the vocal chords, tract, and mouth shapes, this harmonic tremor sound is shaped by the interaction of volcanic gases as they are released and flow through open conduits.”

NASA satellites have got Earth’s volcanoes covered from orbit. They provide round-the-clock monitoring of volcanic eruptions in progress or those possibly on the way. Just two of the satellites used to monitor volcanic activity are Aqua (with its MODIS instrument) and Terra (with its ASTER instrument).

Volcanologists use the satellite data from NASA’s fleet to detect heat and telltale volcanic gases emanating from volcanic vents. Also, Global Positioning System satellite devices allow researchers to gauge subtle changes in the land surface near volcanoes.

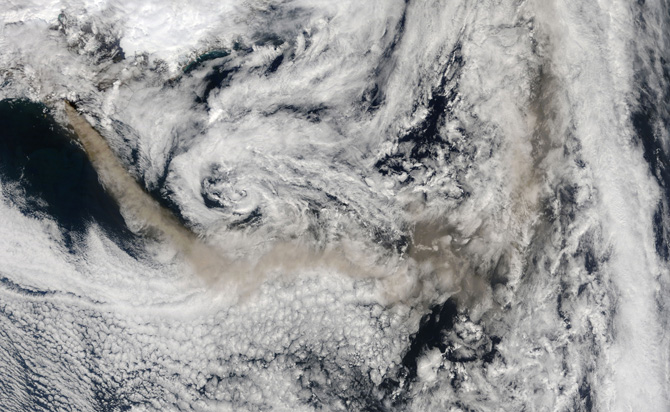
And once a volcano pops off, NASA satellites track drifting ash clouds that could threaten aircraft. (You may recall the shenanigans of a certain unpronounceable Icelandic volcano, Eyjafjallajökull, earlier this year.)

As the NASA birds pass silently overhead, Garces clambers up live volcanoes to record their subterranean rumblings. He uses the sounds to diagnose the physical status of volcanic plumbing systems – for example, whether they might be recharging with molten rock (magma) and getting ready to erupt.

These very low frequency waves are called infrasound. In fact, they are too low in their raw form to be audible to humans. So Garces speeds them up artificially to a frequency range the human hearing can detect. Here’s how he explained it to us:

“This signal, which has been sped up by a factor a hundred to make it audible, in reality has a dominant periodicity of about 1 cycle per second (1 Hz). In the field, it sounds like a chugging sound with 1 s puffs, and it is not tonal at all. We lose our sense of tonality at frequencies below around 16 Hz, so infrasound, however harmonious, will be perceived by us more like a beat than a tune.”

In other words, volcano infrasound is pretty interesting to a scientist, but you can’t dance to it — or at least it would be the ultimate slow dance.


— Daniel Pendick,
Geeked on Goddard
; Eyjafjallajokull image
courtesy of NASA Goddard’s MODIS Rapid Response Team

Piloting Through Hurricane Earl

NASA scientists are deep into a two-month airborne hurricane research campaign known as GRIP (Genesis and Rapid Intensification Processes). GRIP is designed to put multiple aircraft, outfitted with scientific instruments, above a hurricane at the same time, allowing scientists to observe these destructive storms for longer periods than ever before. GRIP is breaking new ground by flying the unmanned Global Hawk at 60,000 feet above the surface, the first time NASA has used this drone in a hurricane field campaign.

But the NASA’s DC-8 and WB-57 planes get to a hurricane the old-fashioned way — with pilots in the cockpit. Dryden Flight Research Center DC-8 pilot Dick Ewers spoke to the media in Ft. Lauderdale, Fla., last week about what it takes and what it’s like to fly into the heart of a storm that your average pilot would try to avoid entirely. What On Earth was on hand to get some of his thoughts.

What should a first-time rider expect on a DC-8 flight through a hurricane?

It’s pretty bumpy at times, but most of the time it’s a lot of clouds. Then, as we get closer, we’ll go into some bumps and turbulence. As we break out into the eye, hopefully we’ll be able to see the sky above and all the way down to the water below. That’s very nice. All the sudden you’re out of the car wash and you’re looking down and can see what’s happening below. Normally it’s about 10 to 15 minutes of excitement per hour.

What’s the strongest Earl was when you flew through it?

At our level it was about 100 mph, but the worst part is down below. We’re above where it’s very intense. And when you’re flying in an airplane and through an airmass, and the airmass is moving at 100 mph, you don’t really notice that. But what you do notice is when you come out, the winds drops off and the airplane rises and falls based on what’s happening around it. So the plane isn’t able to be very level at times.

What’s your strategy to make sure the plane rides smoothly?

Most of the time it’s very solid. It’s bumpy but it isn’t weaving back and forth.

Even in 100 mph winds?

Oh, yeah. It goes right through it.

Is there a level of risk involved?

My job is to take the risk out of it. My job is to make sure what I do is safe and doesn’t put the scientists or the instruments at risk. My whole mission is to make sure that plane is back here tonight. Where the risk and danger is, I will take precautions and go around it and do something to avoid something where danger is involved.

How many flights did you make through Earl?

This will be the fourth and final flight. We thought it was declining yesterday, but it’s stronger this morning, so we’re going back out.

How was the view of the eye?

There are rare storms that are very crystal clear. This one had a lot of strataform in there, so there were clouds around and some clouds above us, so it wasn’t a pristine, clear blue eye. But you were able to see daylight above us and the water below us. I want to say it was 20 to 25 miles wide inside. You wouldn’t want to be in a boat down there.

— Patrick Lynch, NASA’s Earth Science News Team
Images taken by Patrick Lynch during the Sept. 2 GRIP media day in Ft. Lauderdale, Fla.

Snowpocalypse Revisited


Though the summer heat and humidity makes it seem like a lifetime ago, the record-breaking snows in the eastern U.S. last winter are not something we will soon forget. Several feet of powder fell on most of the Mid-Atlantic region during February 2010, and this week a study from Columbia University’s Lamont-Doherty Earth Observatory gives us new insight into what caused the freaky weather.

A rare combination of weather — not climate — patterns seems to be the culprit. El Niño produced abnormally wet conditions in the southeastern U.S.; a negative North Atlantic Oscillation pushed frigid Arctic air down from the North. This collision of moisture with abnormally cold air led to more than six feet of snow over the region between December 2009 and February 2010.

The visualization above, derived from the Goddard Earth Observing System Model Version 5 (GEOS-5) and created by NASA Goddard’s Scientific Visualization Studio, shows the first wave of the February snowstorms hitting the East Coast about four seconds into the animation. The second wave forms off the west coast of Mexico’s Yucatan peninsula — about twelve seconds in — and then pummels the East Coast.

— Michelle Williams, NASA’s Goddard Space Flight Center

NASA's Count Rises as More Land Slides: An Interview with Dalia Kirschbaum


When a deadly landslide killed nearly 100 people and forced the evacuation of 75,000 in
Guatemala on May 30, NASA carefully documented it. And when more than 300 other rain-triggered landslides pulled the Earth out from beneath towns and villages in China, Uganda, Bangladesh, Pakistan and other countries in 2010, NASA researched and documented each one.

Sudden, rain-induced landslides kill thousands each year, yet no one organization had consistently catalogued them to evaluate historical trends, according to landslide expert Dalia Kirschbaum of NASA’s Goddard Space Flight Center. Three years ago, Kirschbaum set out to change that by creating a searchable inventory of landslides specifically triggered by rain.

WhatOnEarth spoke with Kirschbaum to understand how this tool might tell us more about when and where landslides are most likely to occur.

WhatOnEarth: What is a landslide?

Kirschbaum: Landslides occur when an environmental trigger like an extreme rain event — often a severe storm or hurricane – and gravity’s downward pull sets soil and rock in motion. Conditions beneath the surface are often unstable already, so the heavy rains or other trigger act as the last straw that causes mud, rocks, or debris — or all combined — to move rapidly down mountains and hillsides. Unfortunately, people and property are often swept up in these unexpected mass movements.

Landslides can also be caused by earthquakes, surface freezing and thawing, ice melt, the collapse of groundwater reservoirs, volcanic eruptions, and erosion at the base of a slope from the flow of river or ocean water. But torrential rains most commonly activate landslides. Our NASA inventory only tracks landslides brought on by rain.

WhatOnEarth: What prompted you to develop the NASA landslide inventory?

Kirschbaum: The project was initially meant to evaluate a procedure for forecasting landslide hazards globally. Studying landslide hazards over large areas is a thorny, complicated task because data collection is not always accurate and complete from one country to another. Improving our record-keeping is a first step in determining how to move forward with landslide hazard and risk assessments.

As a byproduct, we knew the catalog would provide information on the timing, location, and impacts of the landslides, which is valuable for exploring the socio-economic effects of these disasters. The International Disaster Database, the largest of its kind, often does not record smaller landslide events or detail their human or property toll.

Each one of our landslide entries contains information on the date of the event; details about the location; the latitude and longitude; an indication of the size of the event; the trigger; economic or social damages; and the number of fatalities.

WhatOnEarth: How is a landslide inventory useful or important?

Kirschbaum: As the catalog of events grows, we’ll be able to extract more and more information about which countries have the highest number of landslide reports, highest number of fatalities, etc. We can also break down events by region, season, and latitude, which helps us identify some large-scale patterns. Though the database is limited by occasional reporting biases and incomplete data, the catalog indicates that the highest reported number of rainfall-triggered landslides and fatal landslides occur in South and Southeastern Asia.

We also believe that in the longer term, the catalog will enable us to identify patterns in the global and regional frequency of landslides with respect to El Nino and related climate effects.

WhatOnEarth: Have you used satellite observations for the inventory?

Kirschbaum: No. In a few instances we’ve been able to obtain satellite images over an area where a landslide is clearly visible. However, landslides typically occur over small areas. Satellites cannot generally “see” such fine ground details or do not pass over the affected area with the frequency necessary to capture when the landslide occurred.

We hope to use satellite imagery, for example from NASA’s Earth Observing 1 (EO-1) satellite, to evaluate the location and area of some larger landslides. This remains a work in progress.

WhatOnEarth: So, if satellites can’t yet help you track landslides, how do you analyze each landslide event?

Kirschbaum: We have searched online literature – sources such as news reports, online journals and newspapers, and disaster databases — for the years 2003 and from 2007 to the present. The landslide inventory is only as good as the availability and accuracy of the reports and sources used to develop it. The work can be tedious and time-consuming, so we’ve enlisted the help of several excellent graduate students to keep the inventory updated over the past three years.

Our database tries to capture as many rainfall-triggered landslides as possible, but this is often difficult due to limitations in reporting of landslide hazards. The accuracy and completeness of details surrounding an event — especially when many landslides are triggered from a very large rainfall event over a broad area– can be less than informative so we are continually trying to improve the cataloguing effort. At the end of this year we’ll have a five-year record of events which will provide us more information to identify global trends.

WhatOnEarth: Is the NASA’s landslide inventory only available to lay people?

Kirschbaum: Our compilation methods were published in a scientific journal last year, and the actual inventory is now openly available to anyone on the Web. We’ll be posting the inventory from January through June 2010 shortly.

Image Information: A massive landslide covered the Philippine village of Guinsaugon, in 2007, killing roughly half of the 2,500 residents. Credit: U.S. Marine Corps./ Lance Cpl. Raymond Petersen III (top).  A map of landslide events in 2003, 2007, and 2008. Credit: NASA/Dalia Kirschbaum (above right).

— Gretchen Cook-Anderson, NASA’s Earth Science News Team