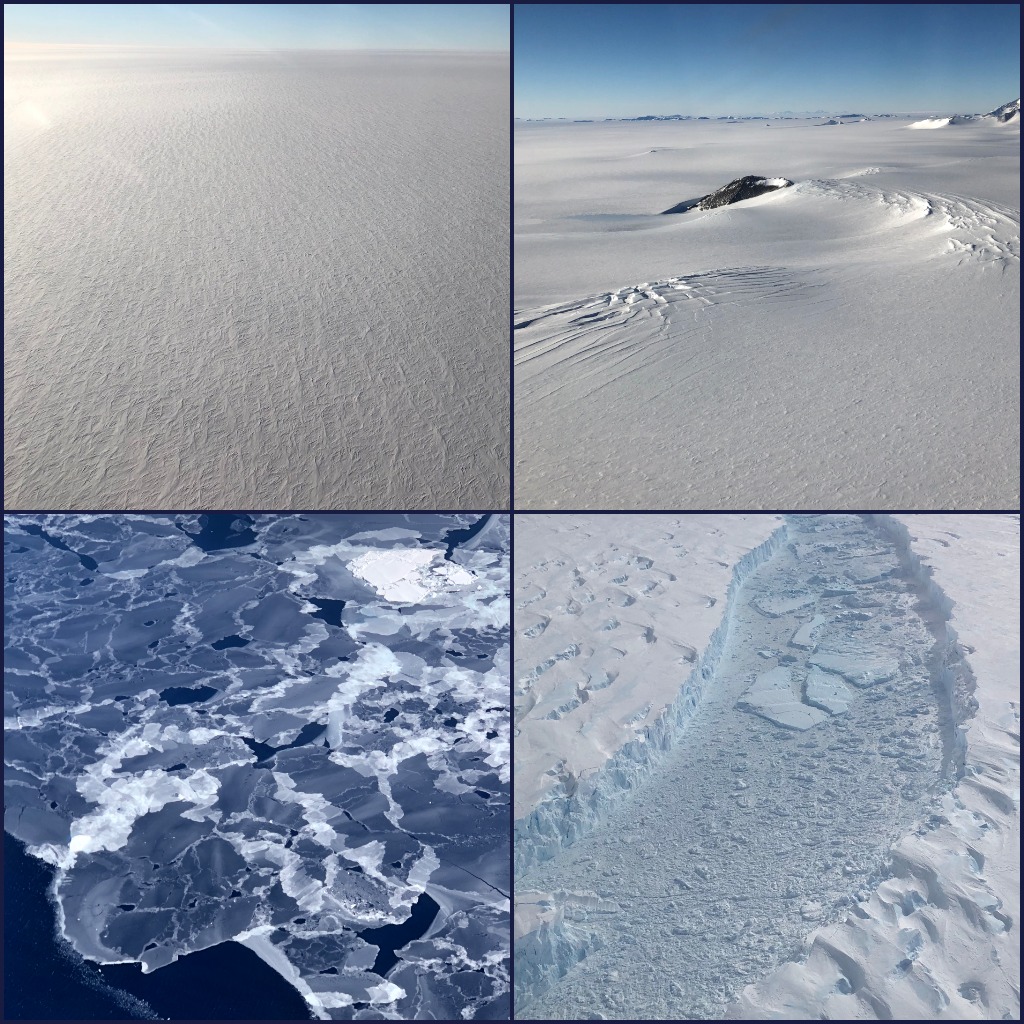
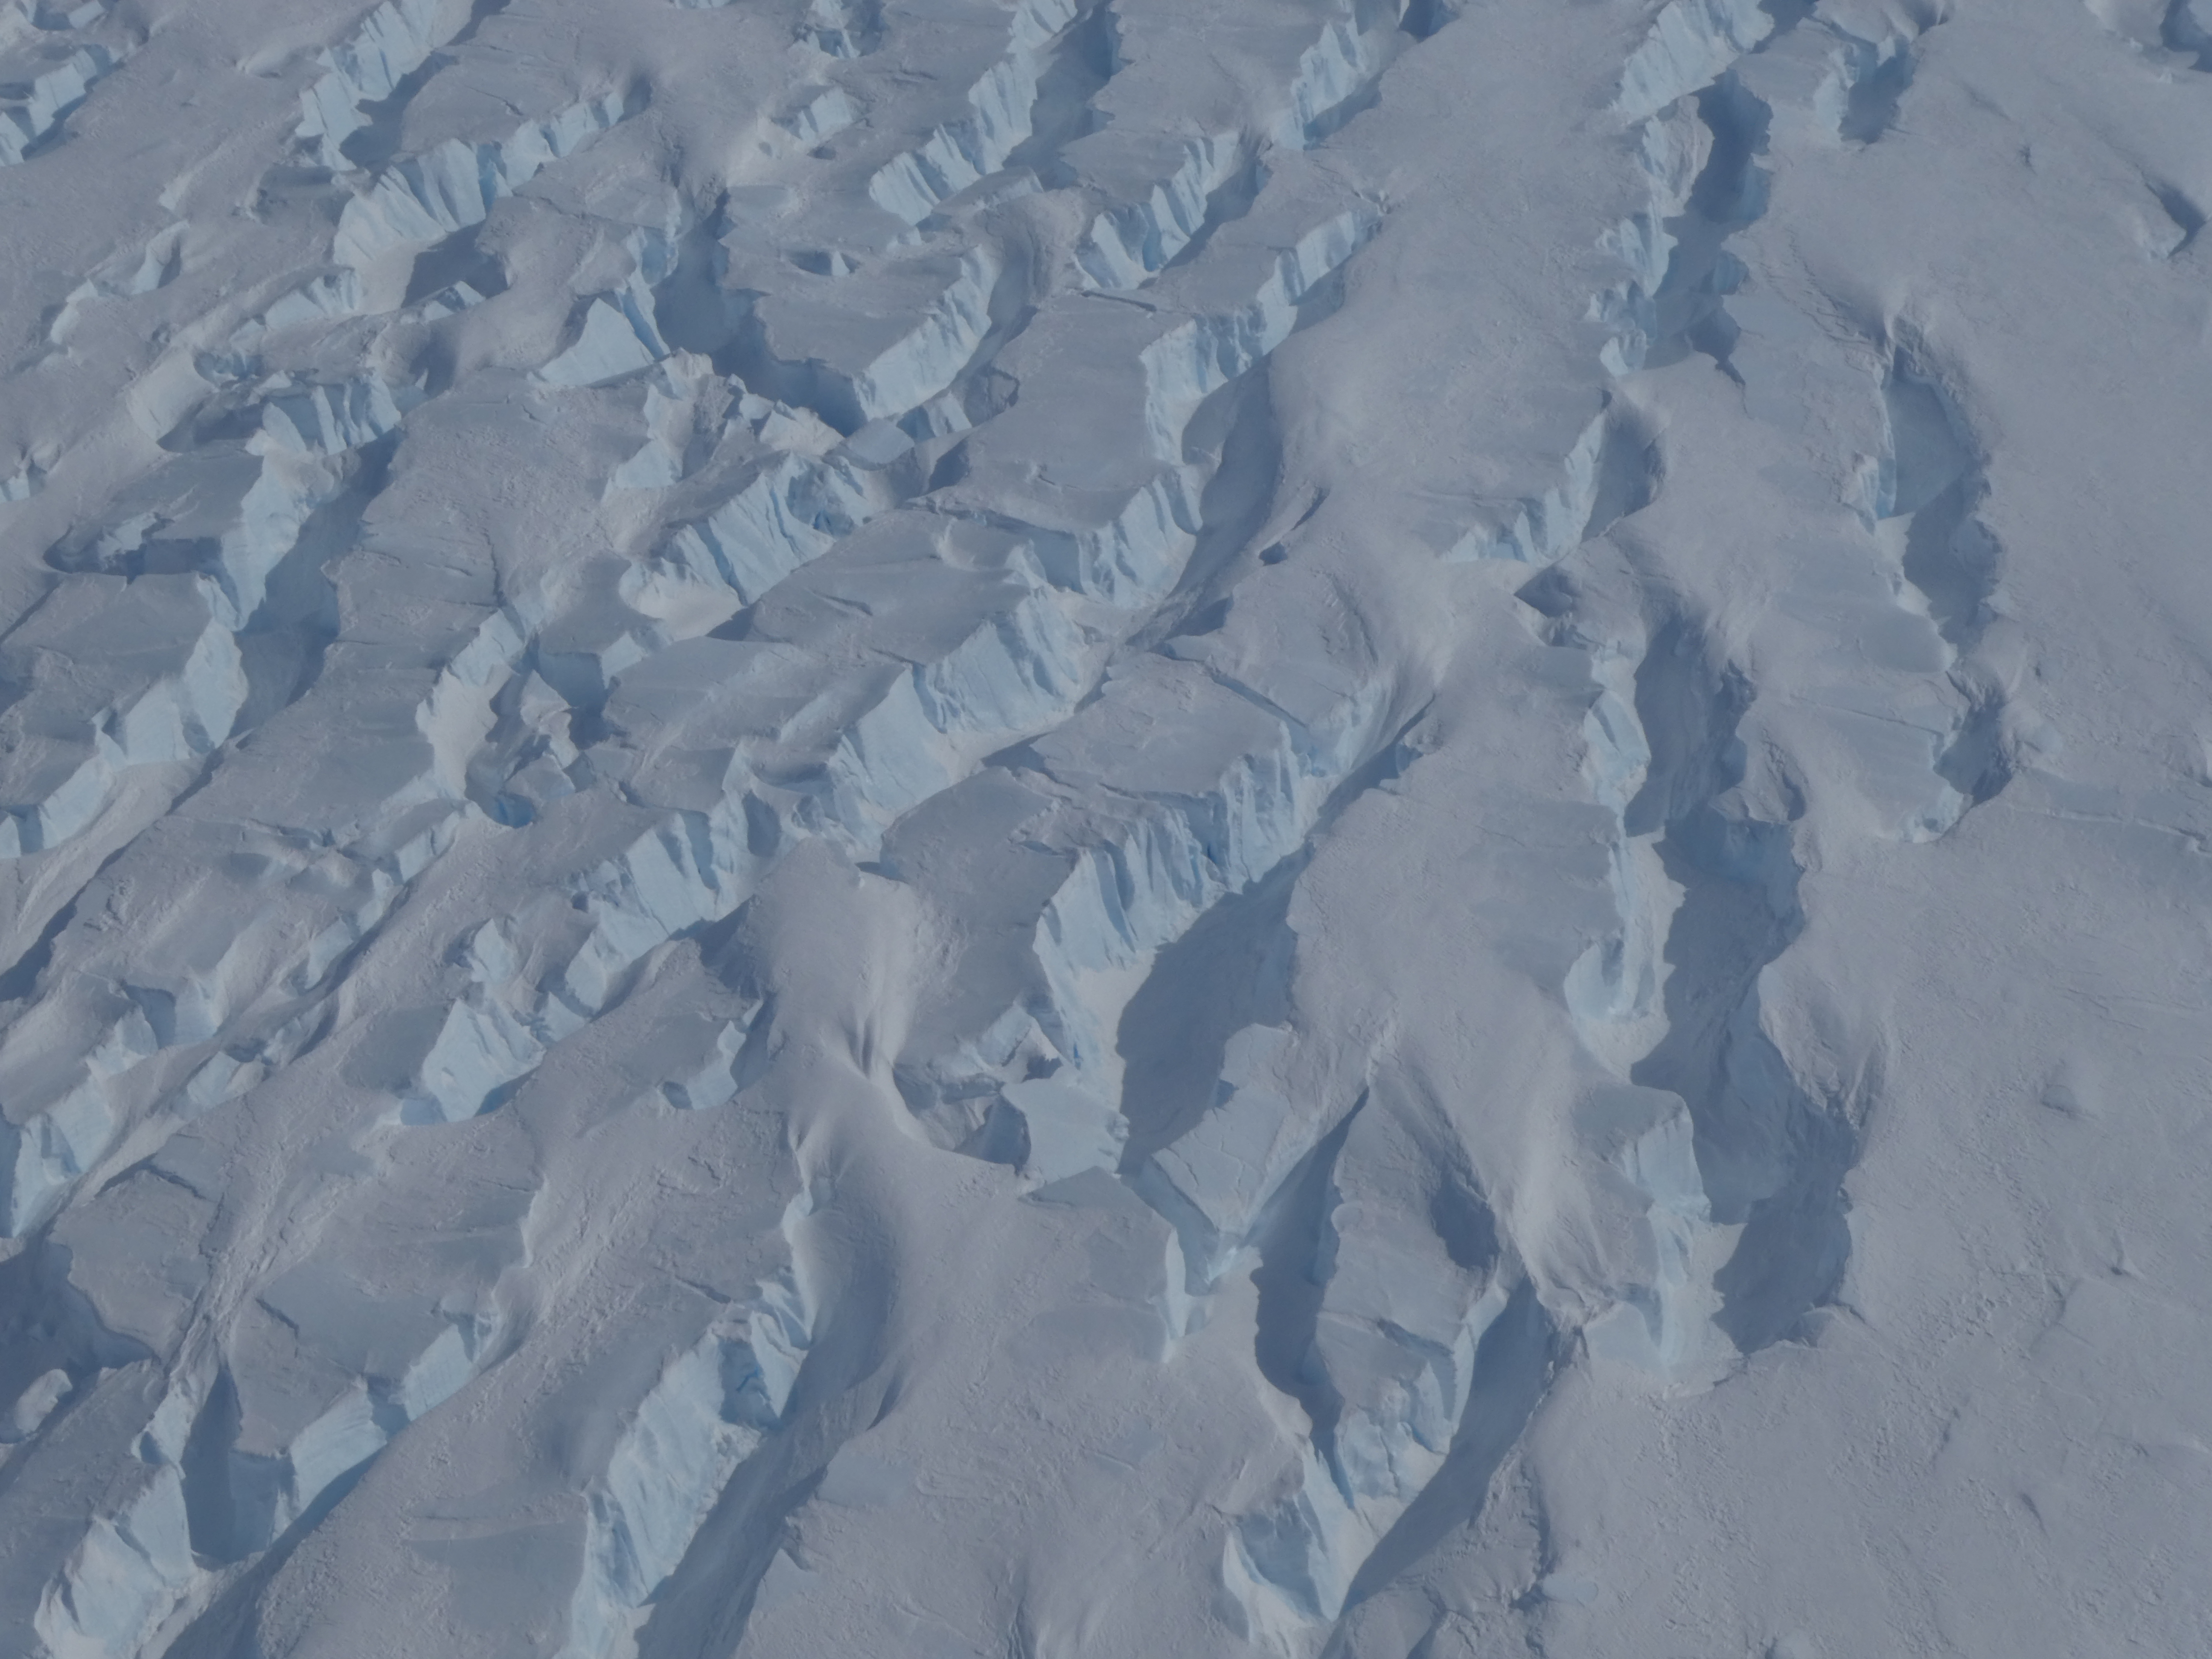
Sastrugi, crevasses, sea ice, and bergy bits—a few of my ever-changing favorite things. Credits: NASA/Kate Ramsayer
by Kate Ramsayer / ANTARCTICA /
I knew they were my favorite as soon as I saw them. Sastrugi, the ice dunes of the polar desert, covered the landscape when I first flew low over Antarctica with Operation IceBridge. They were amazing—winds had shaped them into repeating patterns, appearing as diamonds or fish scales or branching tree roots. They were the only texture in the vast ice sheet that stretched as far as the eye could see.
The next day, however, crevasses took the top spot. Gigantic cracks that bent around mountains as the mass of ice crept toward the ocean—those were definitely my new favorite ice formations. As our IceBridge team took measurements down a path that ICESat-2 would trace from its orbit in space, I wondered how the height profile from these instruments could reflect these seemingly bottomless and terrifying cracks in the ice.
Then sea ice made an appearance. Icebergs were trapped at awkward angles in the frozen floes, and new ice spreading across open waters in translucent blues and whites—those had to be the most artistic formations, right? Maybe so—in my mind—until the next flight, which measured a newly created gigantic iceberg, and I glimpsed the jumble of bergy bits and sea ice in the rift between it and the glacier.
A glacier on the Antarctic Peninsula flows into the Bellingshausen Sea. Credits: NASA/Kate Ramsayer
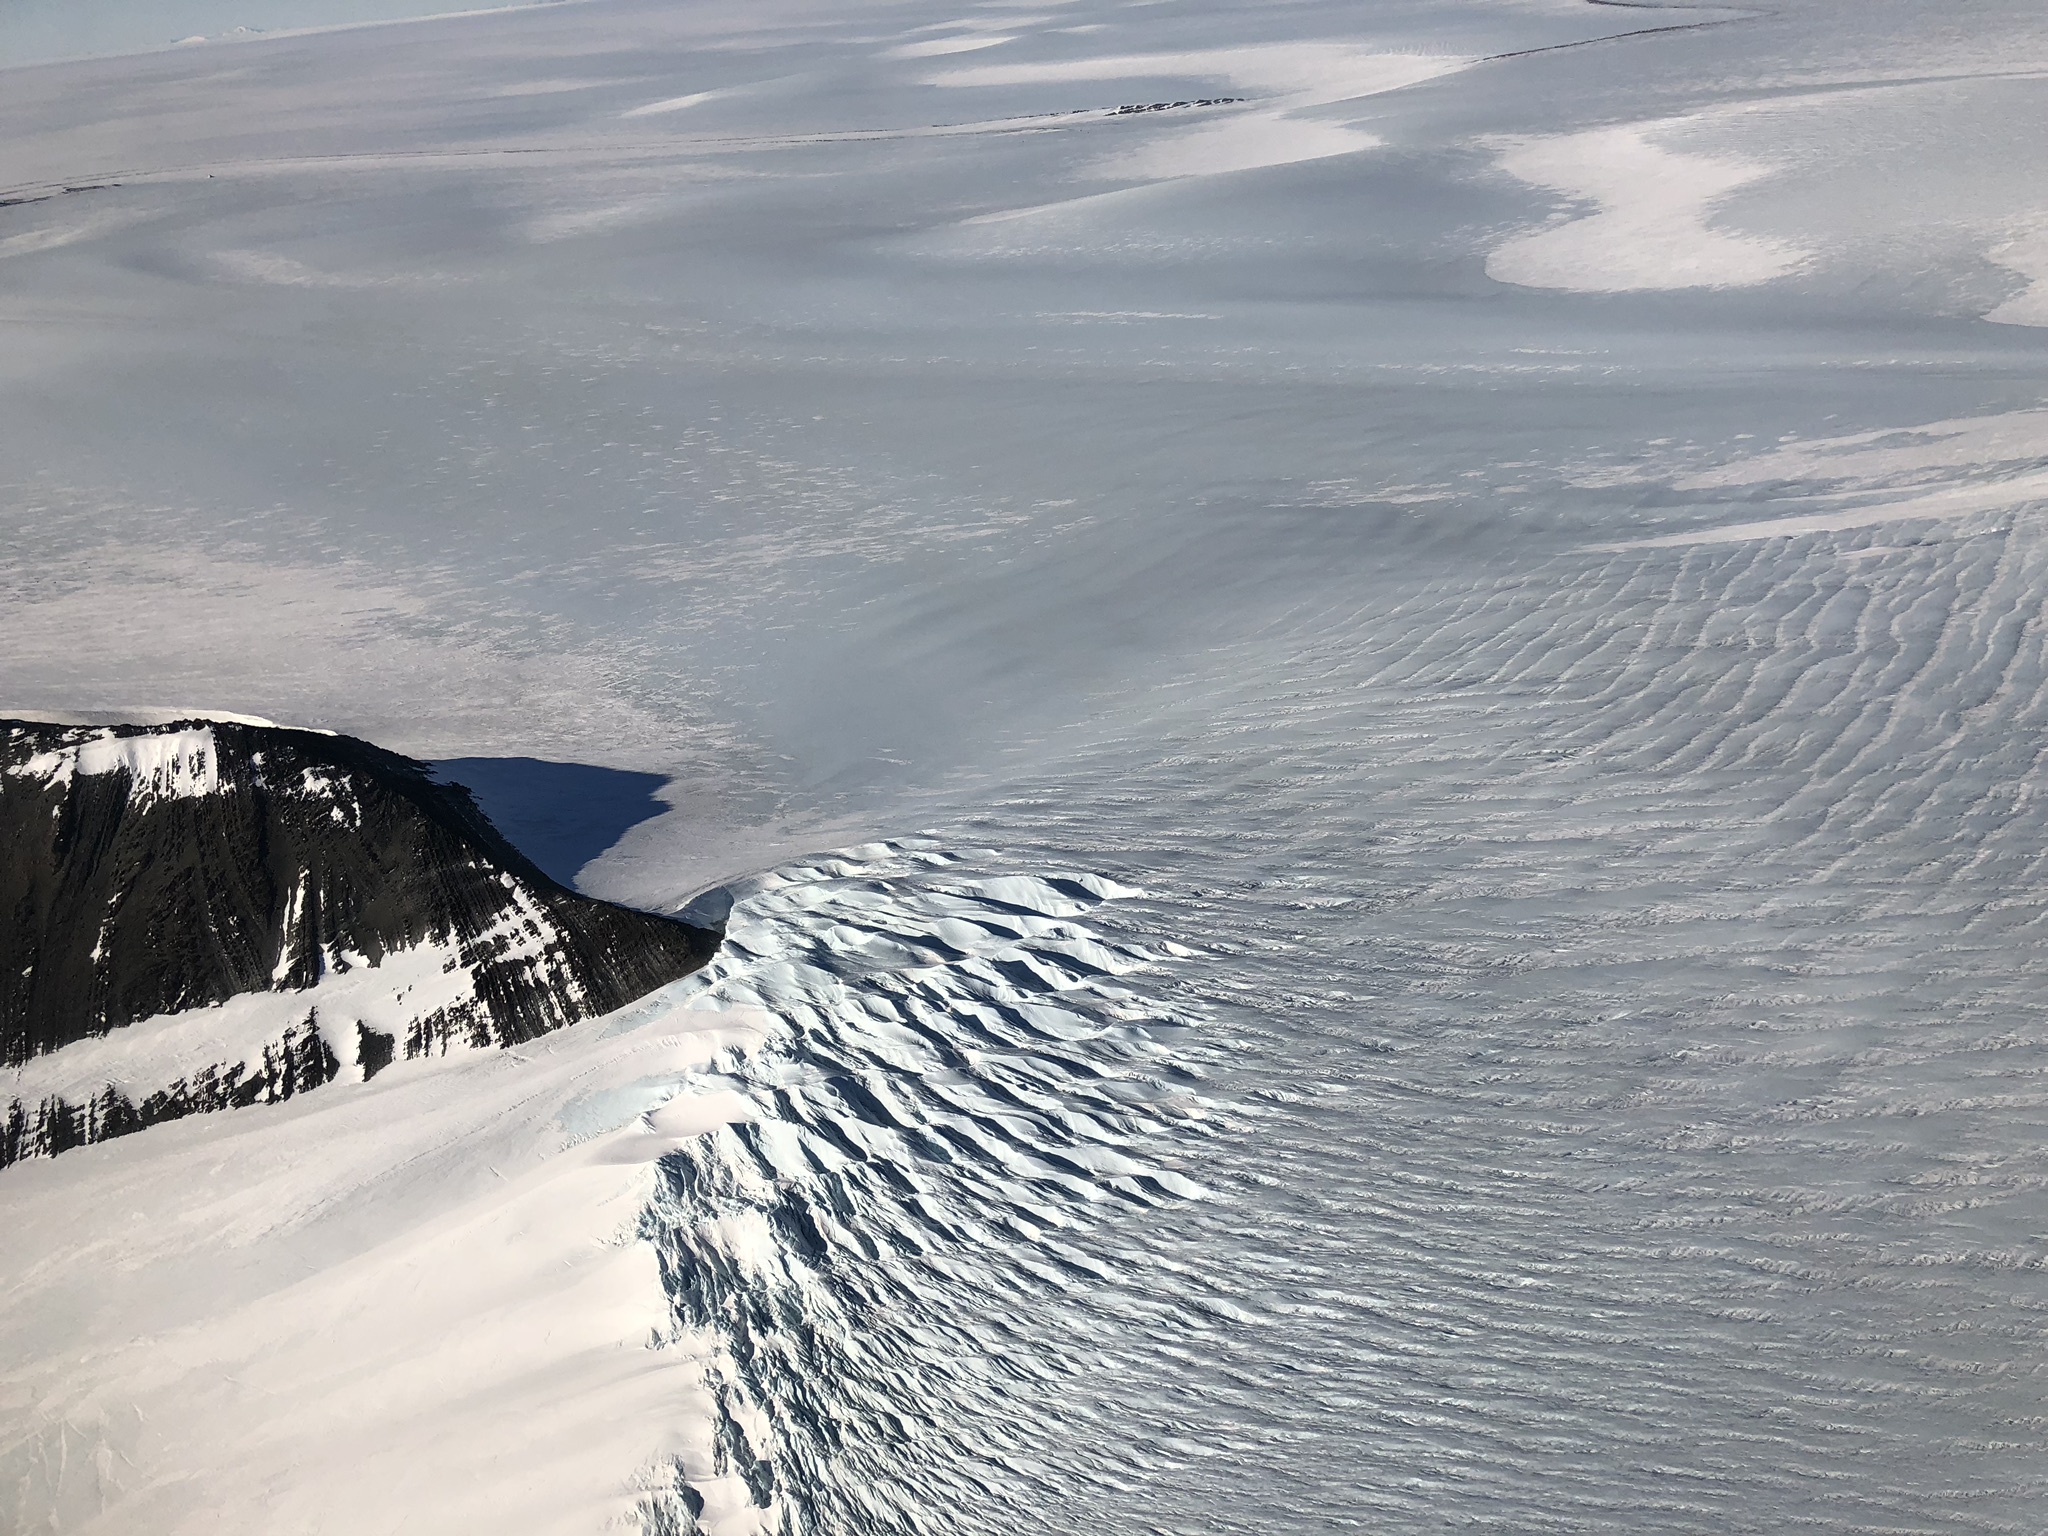
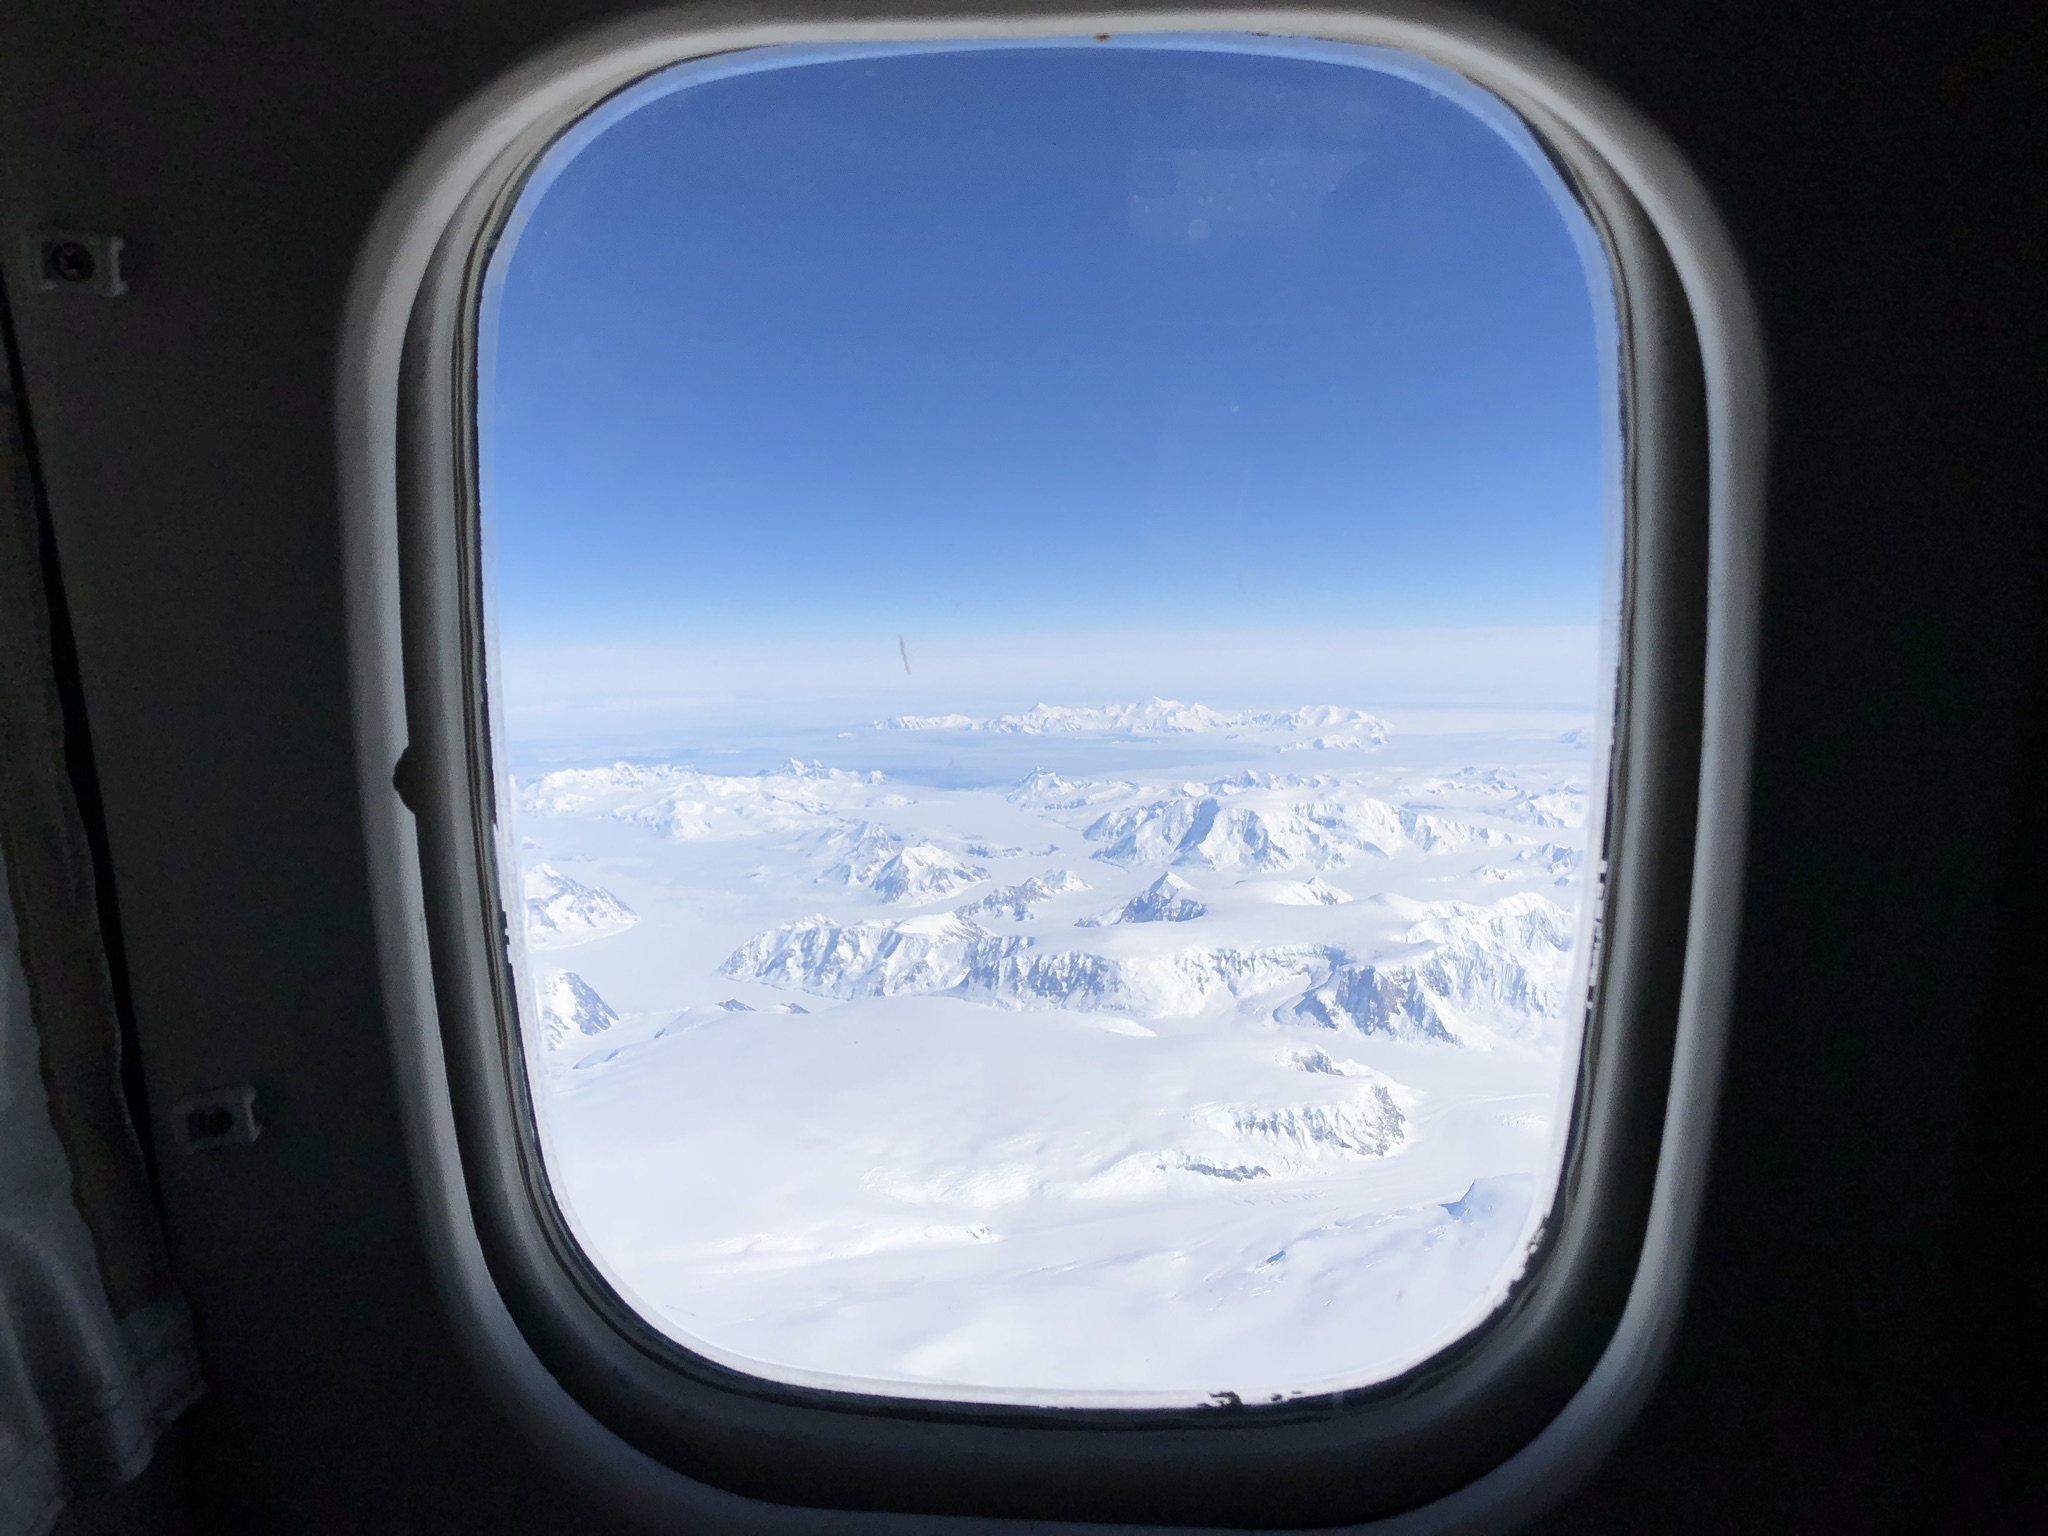
At least I would be safe from a new favorite ice formation on my last flight, I thought. A survey farther inland of a region we had flown before, it should be old hat. But no. As we flew toward the site, the skies cleared over the Antarctic Peninsula, revealing glacier after glacier after glacier, all textbook examples of how spectacular glaciers can be.
Every day flying over Antarctica with the Operation IceBridge campaign brought a new incredible stretch of ice that left me, a new visitor to the continent, awestruck. Many members of the team have been surveying the continent for years, using a suite of instruments to map the ice and bedrock and monitor change. I couldn’t pick a favorite view, and can’t imagine they could either, so instead I just asked some of the IceBridge crew for an example of one of the neatest things they’ve seen flying over Antarctica.
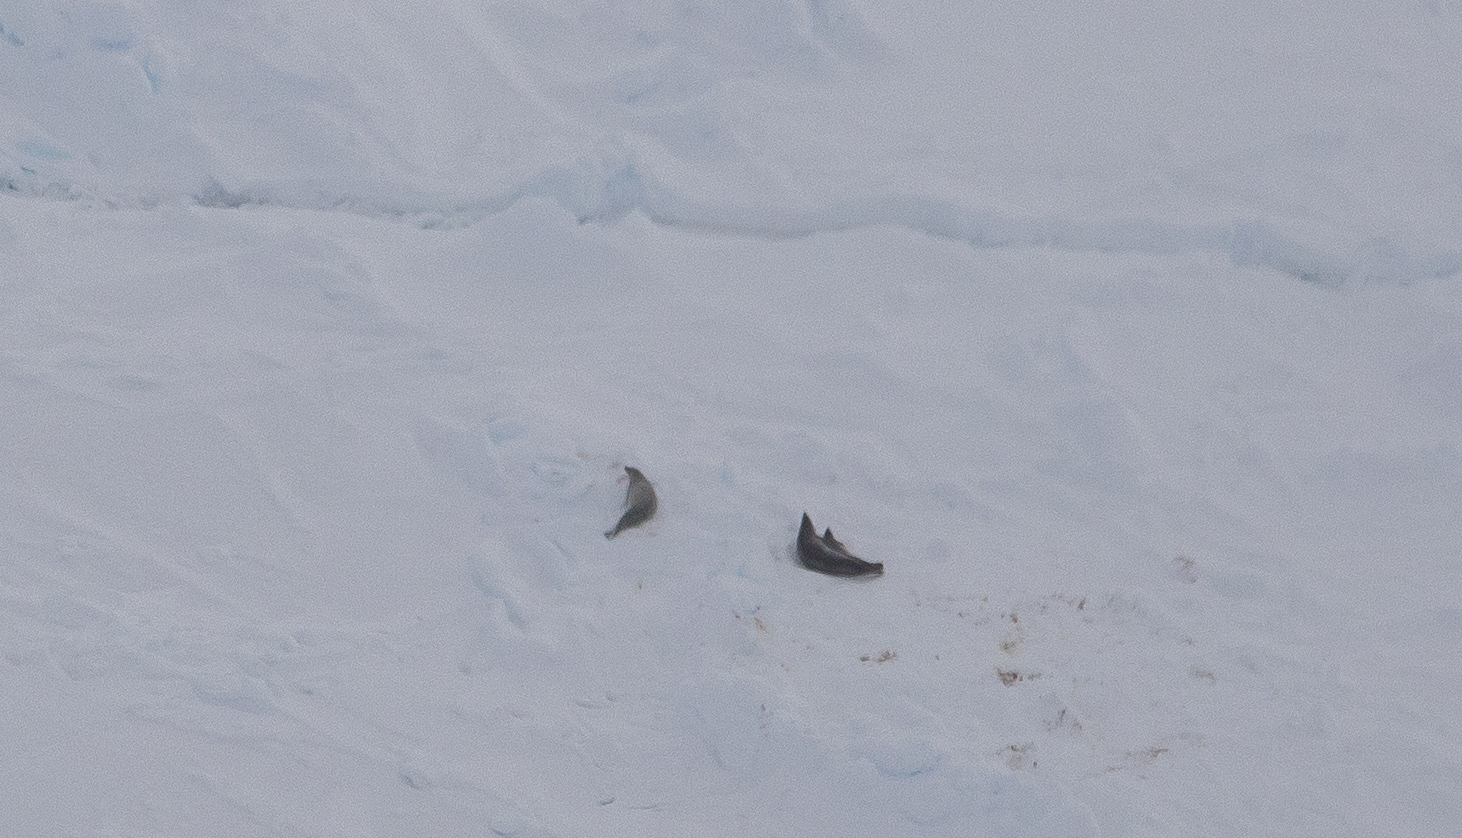
Actually seeing Pine Island and Thwaites glaciers, which she has studied for more than a decade, is a highlight for Brooke Medley, IceBridge’s deputy project scientist. Her research showed that enough ice flows out of each glacier to contribute 1 millimeter to global sea level rise per decade. They’re massive glaciers, and flying over them puts into perspective just how massive they are. Credits: NASA/Kate RamsayerThe vastness of the Antarctic ice sheet can leave Eugenia DeMarco, IceBridge’s project manager, speechless. It’s just raw nature, she said, and provides a glimpse of what early explorers might have felt when they first ventured to this distant part of the world. Credits: NASA/Kate RamsayerIn massive ice streams that appear solid and unmoving, it’s the crevasses that remind you the ice is in motion, said Thorsten Markus, ICESat-2 project scientist. These giant breaks form as the faster ice downstream pulls away from the slower ice upstream. Credits: NASA/Brooke MedleyFrom above, crevasses can appear as wrinkles on fabric. Credits: NASA/Kate RamsayerThe ice may seem desolate, but there’s life in Antarctica, and Lyn Lohberger, an aircraft mechanic and safety technician, points to seals visible on the ice floes. They provide a contrast as well, he said—the black seals on the white ice, with blue seas and sky. Credits: NASA/Jeremy HarbeckIcebergs that have broken off of glaciers and ice shelves create different three-dimensional shapes in the flat sea ice, noted Victor Berger, with the CReSIS snow radar team. And Tim Moes, DC-8 project manager, pointed out the blue color of the older ice visible in the bergs. Credits: NASA/Kate RamsayerOperation IceBridge has surveyed Arctic and Antarctic ice for a decade, collecting scientific data on the changing ice. It’s the best office window view, said Jim Yungel, Airborne Topographic Mapper team lead—and it never gets old. Credits: NASA/Kate Ramsayer
The NASA DC-8 aircraft’s shadow is dwarfed in scale by the B-46 iceberg. Credits: NASA/Brooke Medley
by Kate Ramsayer / THE SKIES ABOVE ANTARCTICA /
The crack that would become B-46 was first noticed in September 2018 – and the berg broke the next month.
NASA’s Operation IceBridge flew over a new iceberg that is three times the size of Manhattan on Wednesday – the first known time anyone has laid eyes on the giant berg, dubbed B-46, that broke off from Pine Island Glacier in late October.
The flight over one of the fastest-retreating glaciers in Antarctica was part of IceBridge’s campaign to collect measurements of Earth’s changing polar regions. Surveys of Pine Island are one of the highest priority missions for IceBridge, in part because of the glacier’s significant impact on sea level rise.
On Wednesday, IceBridge’s approach to the iceberg began far above the glacier’s outlet, in the upper reaches of ice that will eventually flow into the glacier’s trunk. There, as far as the eye can see, it was flat and it was white.
As the aircraft headed toward the glacier’s outlet in the Amundsen Sea, snow-covered crevasses became visible when sunlight struck at just the right angle. Every once in a while, a dark hole appeared in the crevasses where the snow had fallen through, providing a glimpse into the depths of the ice sheet. Then the holes got bigger.
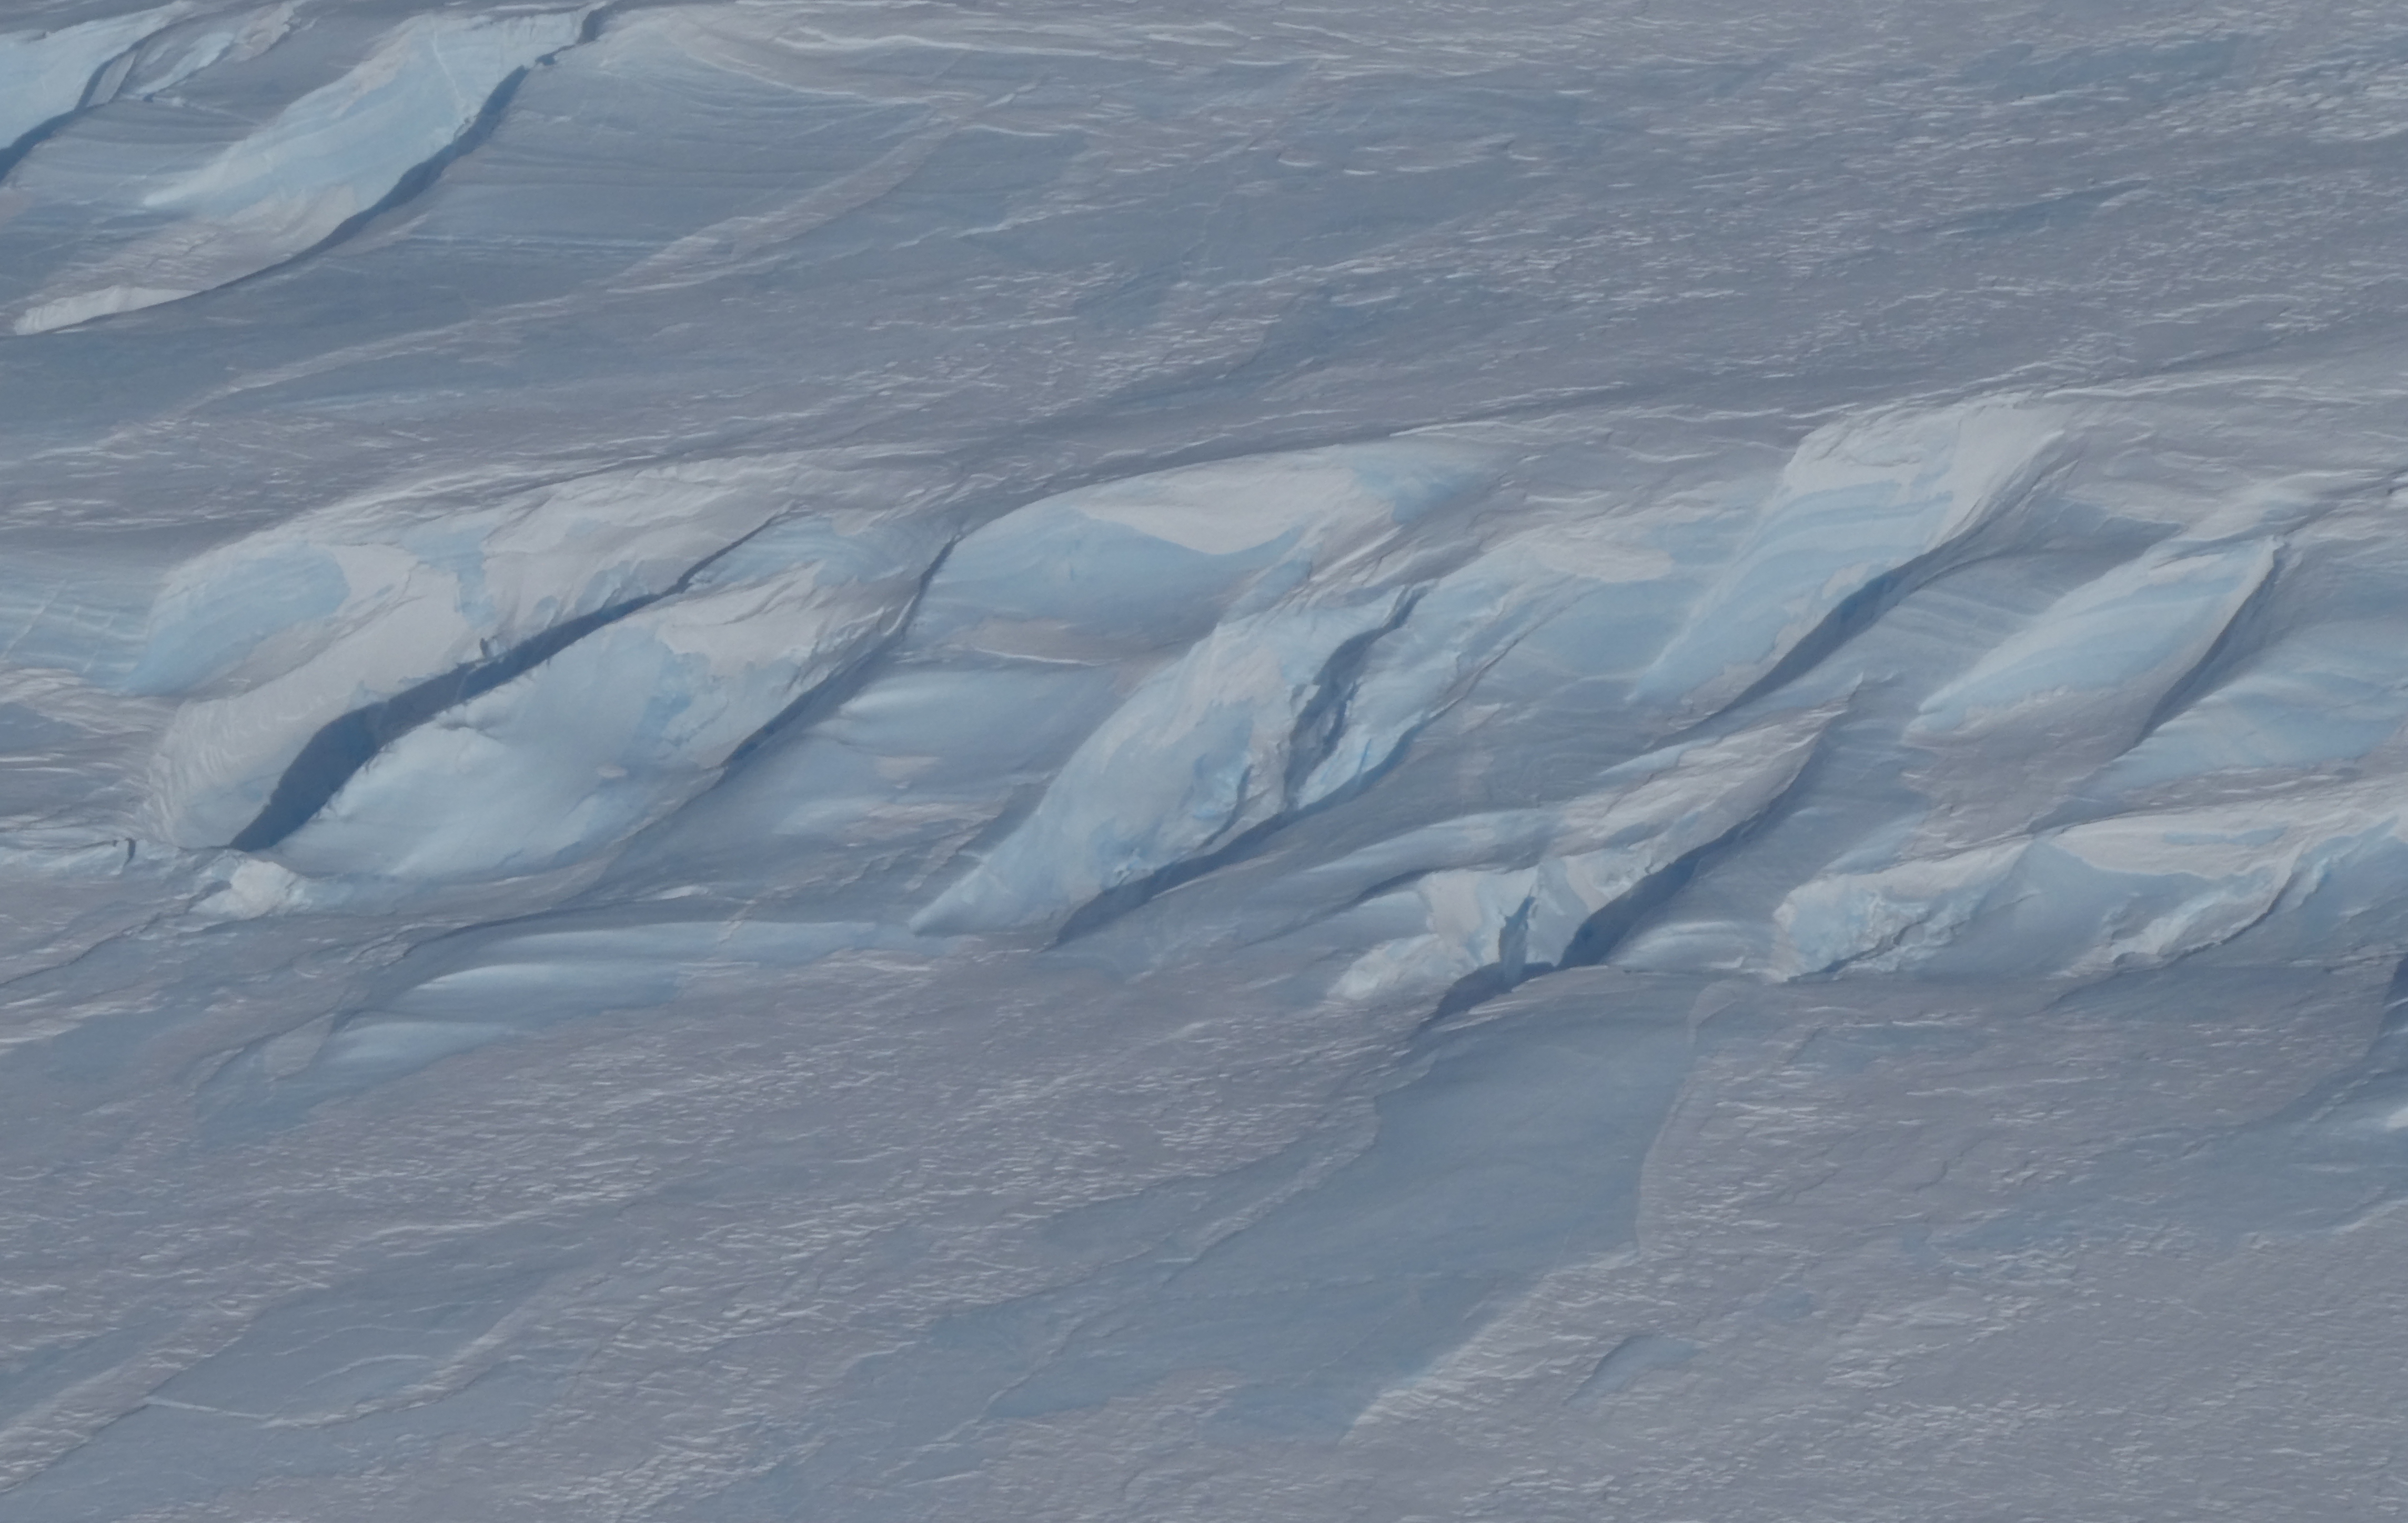
The crevasses and dunes became a jumbled mess of ice, as Pine Island Glacier picks up speed as it flows to the sea. The crevasses got deeper and wider, swirling around each other. Striated snow layers in white and pale blue were visible down the crevasse walls, like an icy version of the slot canyons in the American West.
Crevasses in Pine Island Glacier indicate how fast the ice is moving. Credits: NASA/Kate RamsayerCrevasses in Pine Island Glacier get larger as the ice moves faster toward the Amundsen Sea. Credits: NASA/Kate Ramsayer
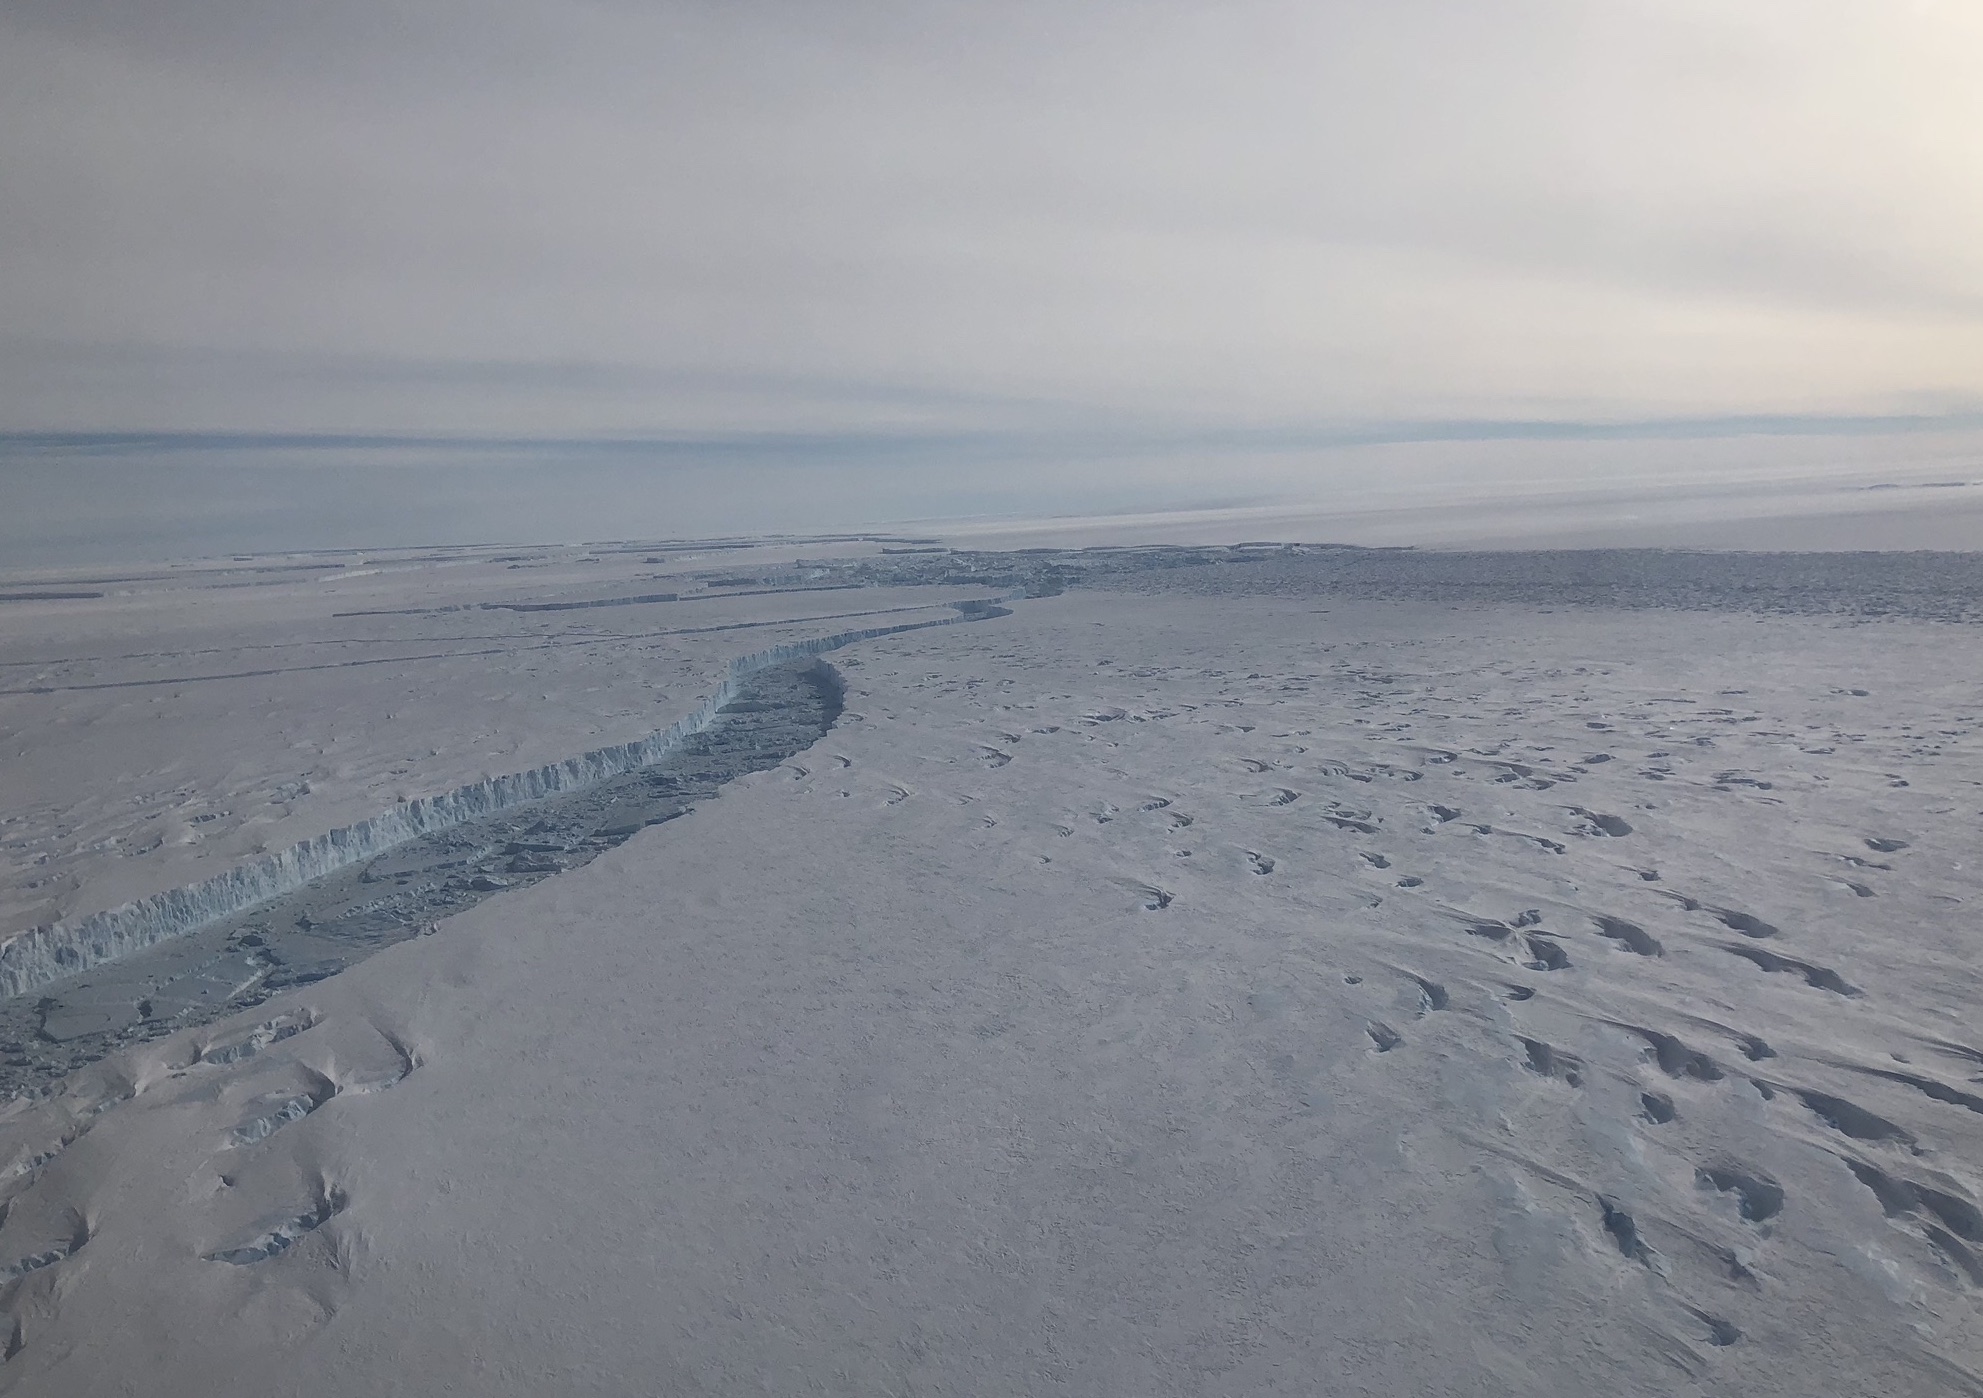
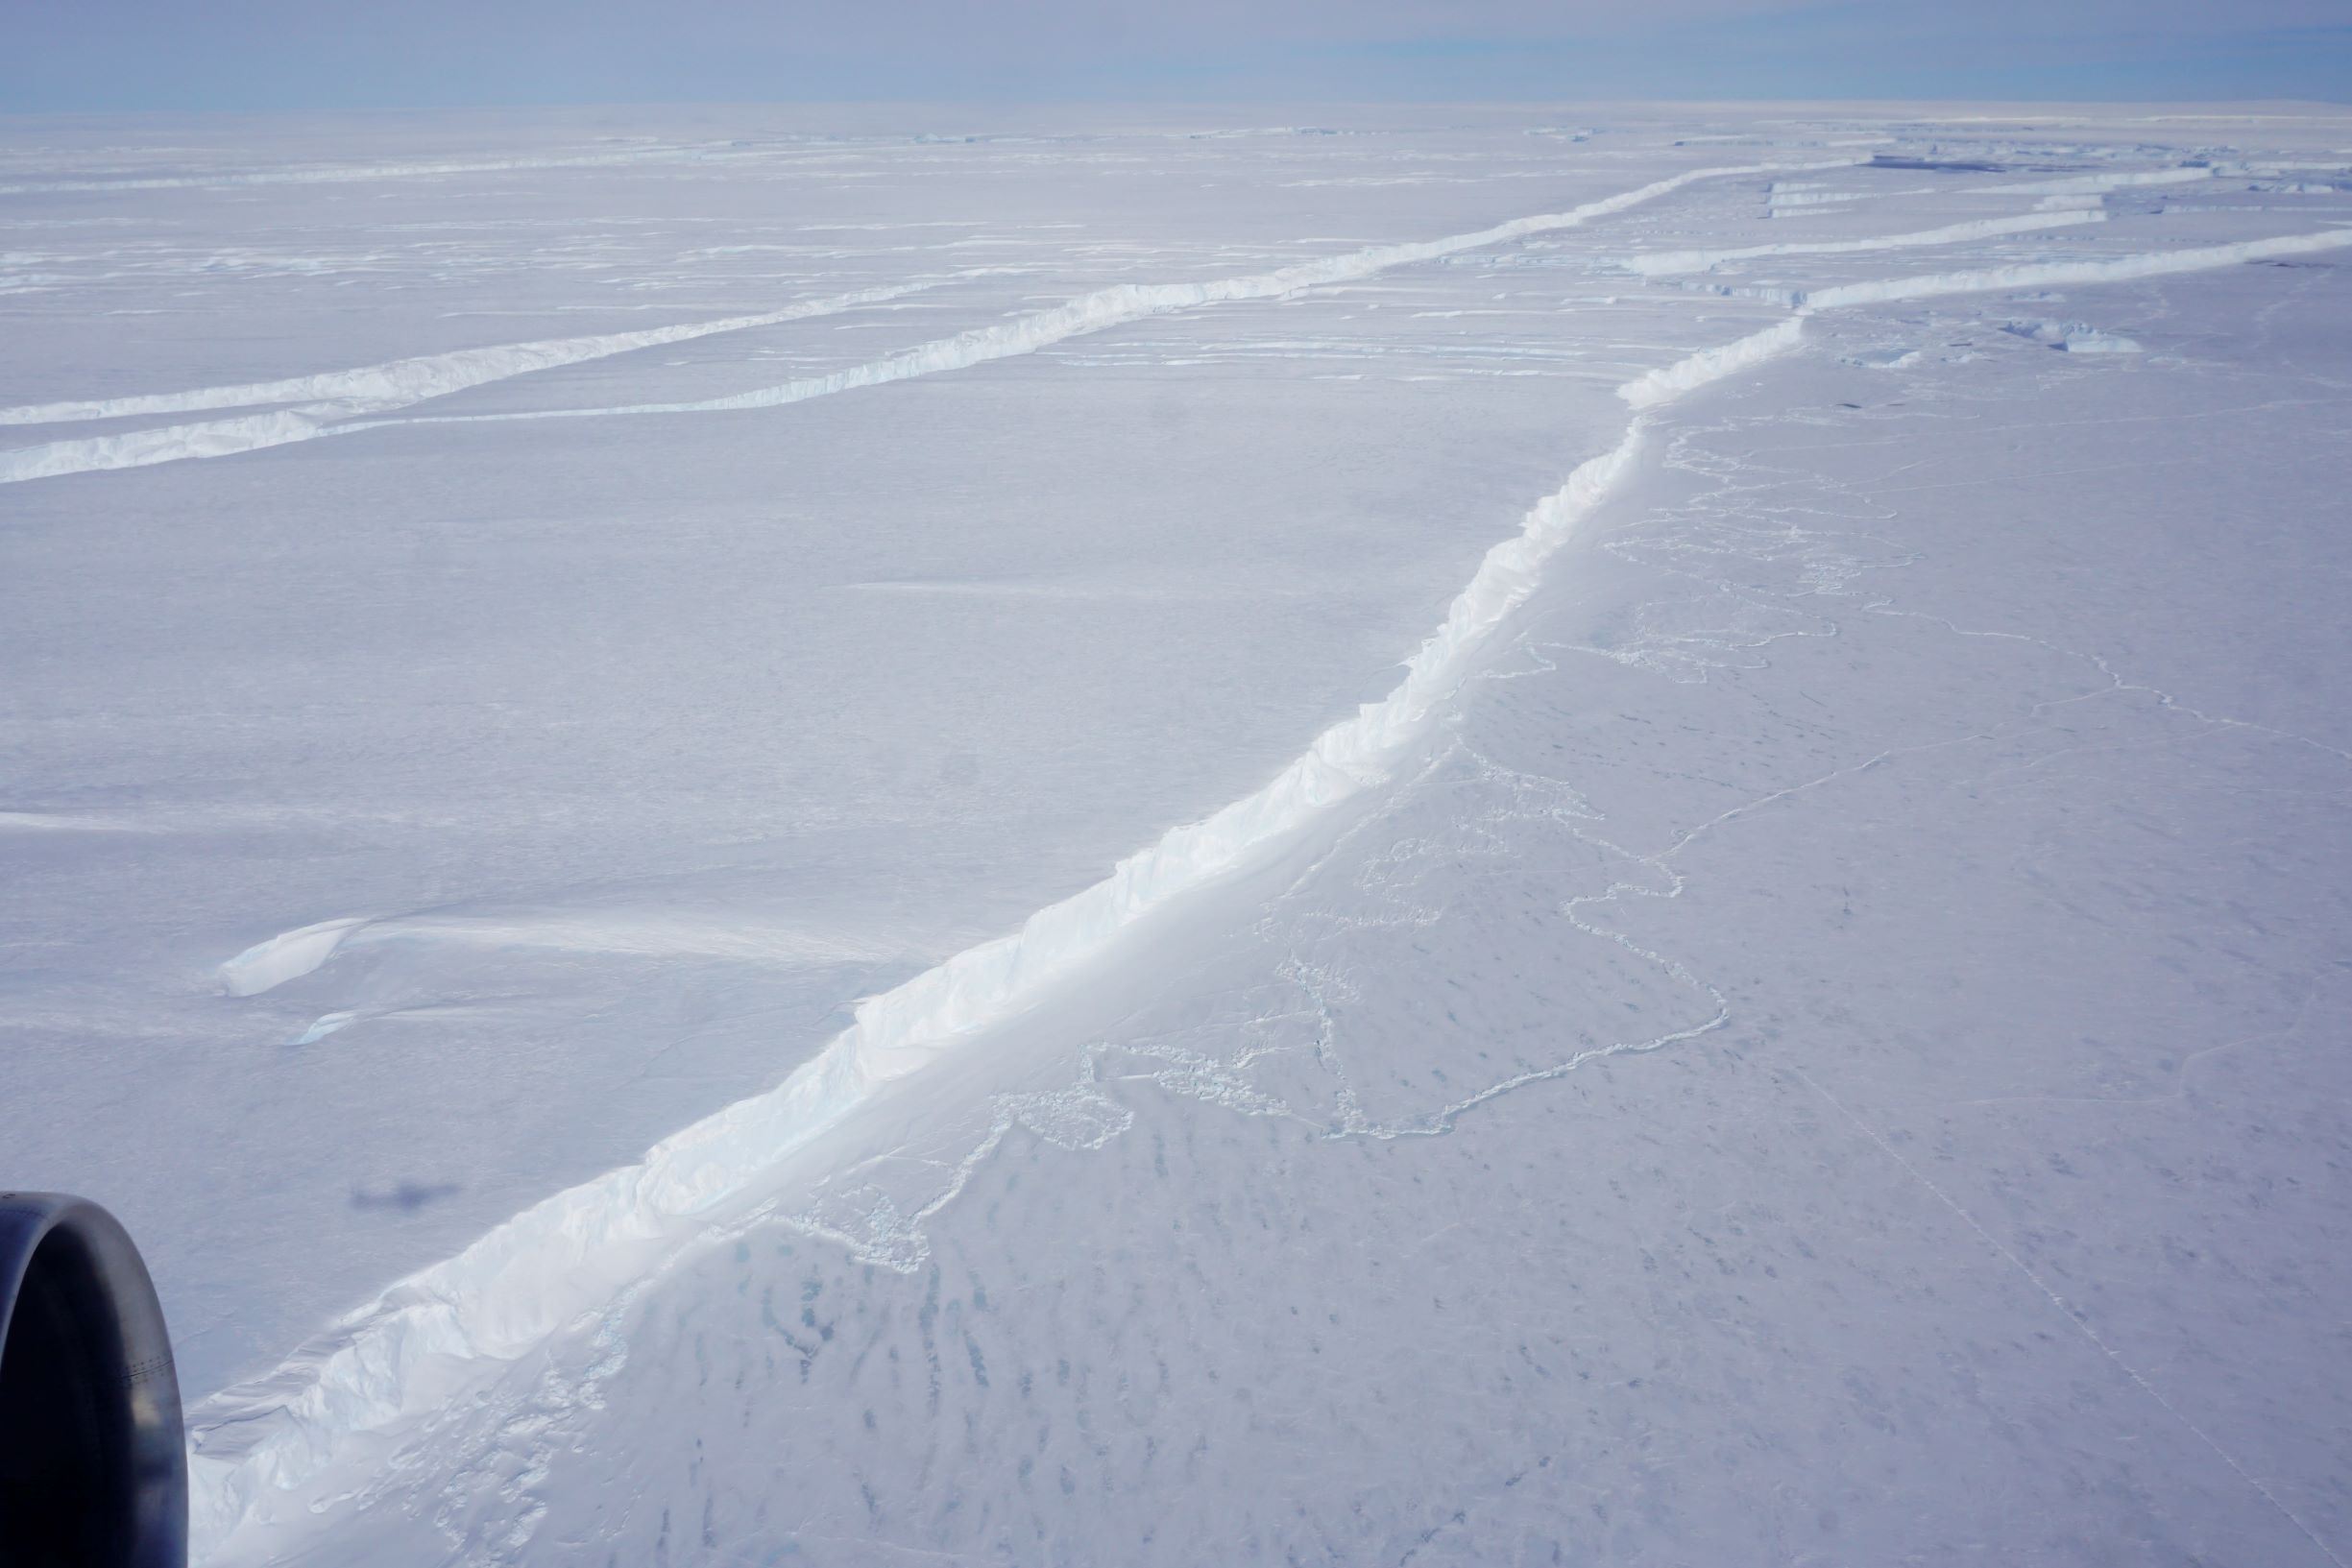
Then finally – the berg. Satellite imagery had revealed a massive calving event from Pine Island in late October, and the IceBridge crew was the first to lay eyes on the newly created iceberg.
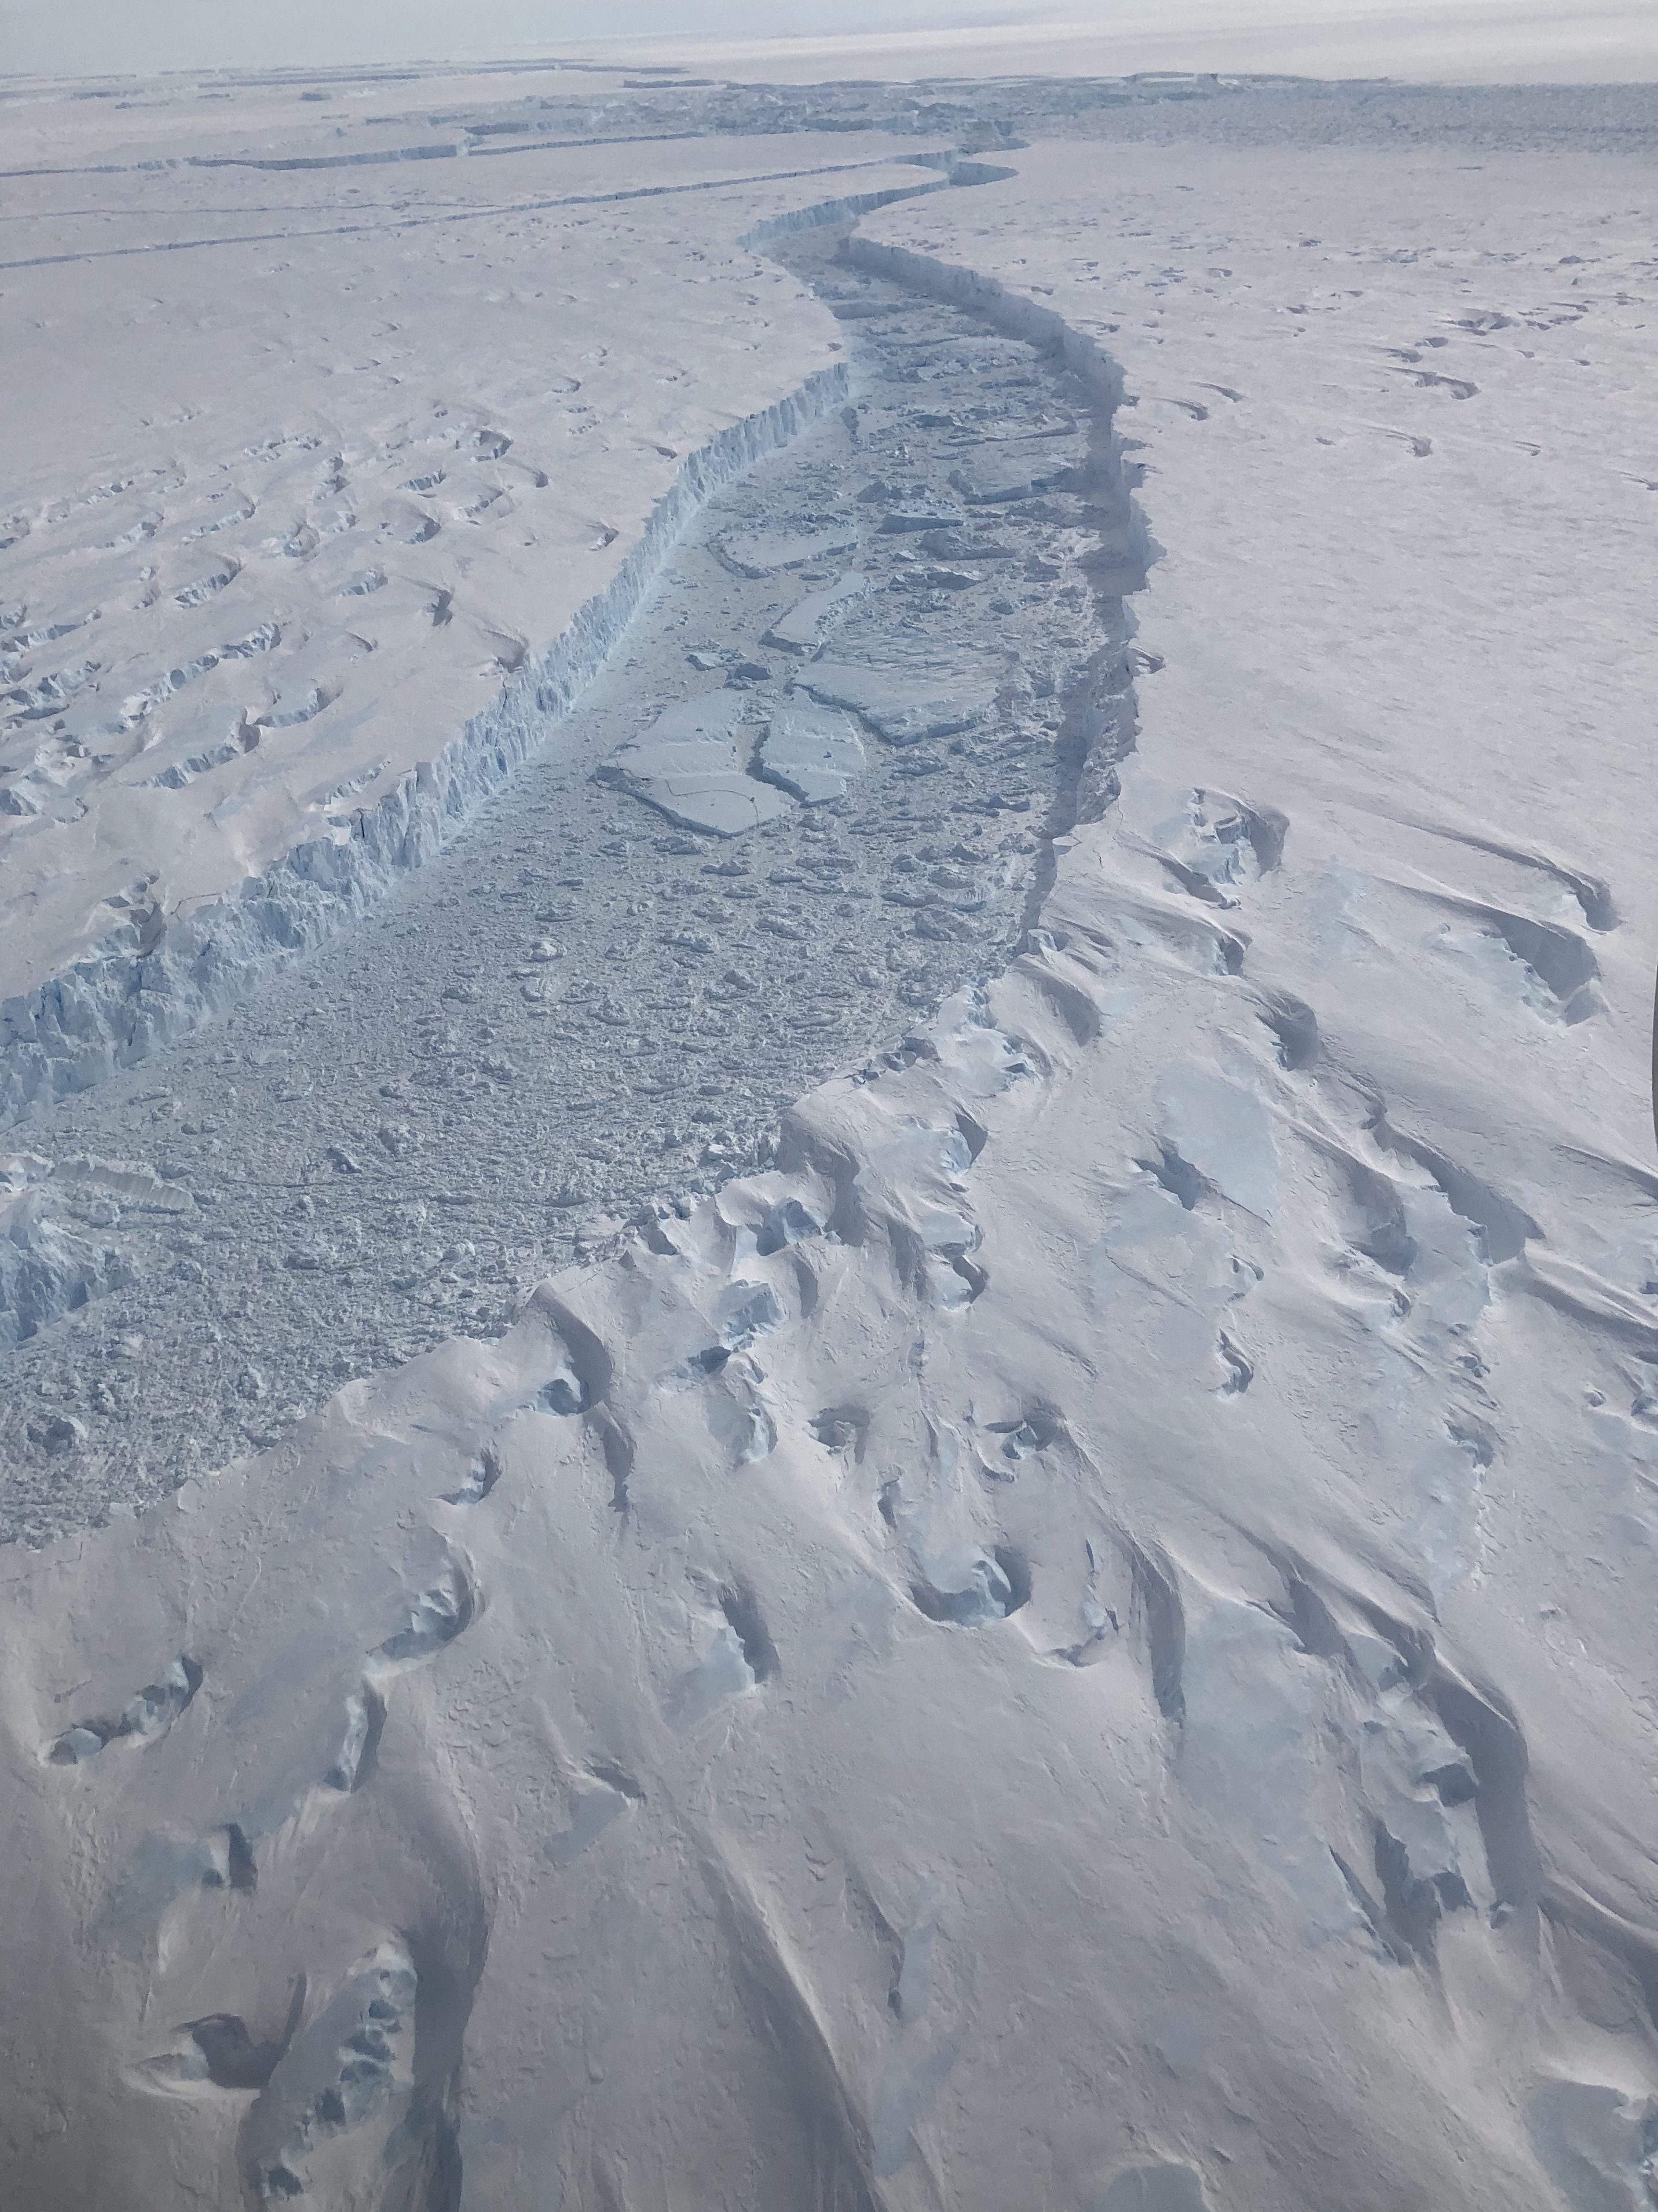
The glacier ends in a sheer 60-meter cliff, dropping off into an ocean channel filled with a mix of bergy bits, snow, and newly forming sea ice. On the other side, a matching jagged cliff marked the beginning of B-46, as it stretched across the horizon.
The rift between Pine Island Glacier and a new giant iceberg, dubbed B-46, in Antarctica. Credits: NASA/Kate Ramsayer
“From this perspective at 1,500 feet, it’s actually really difficult to grasp the entire scale of what we just looked at,” said Brooke Medley, Operation IceBridge’s deputy project scientist who has studied Pine Island Glacier for 12 years. “It was absolutely stunning. It was spectacular and inspiring and humbling at the same time.”
Even though it had calved just over a week ago, the berg was already showing signs of wear and tear. Cracks wove through B-46, and upturned bergy bits floated in wide rifts. The iceberg will probably break down into smaller icebergs within a month or two, Medley said.
Iceberg calving is normal for glaciers – snow falls within the glacier’s catchment and slowly flows down into the main trunk, where the ice starts to flow faster. Eventually it encounters the ocean, is lifted afloat, and over time travels to the edge of the shelf. There, ice breaks off in the form of an iceberg. When the amount of snowfall and ice loss (from iceberg calving and melt) are the same, a glacier’s in balance. So it’s hard to link a particular iceberg like B-46 to the increasing ice loss from Pine Island Glacier.
A sheer wall of the new iceberg B-46 looms over a mix of sea ice, bergy bits, and snow at the base of Pine Island Glacier, as seen from a NASA Operation IceBridge flight on Nov. 7, 2018. Credits: NASA/Kate Ramsayer
But the frequency, speed, and size of the calving is something to keep an eye on, Medley said. In 2016, IceBridge saw a crack beginning across the base of Pine Island; it took a year for an actual rift to form and the iceberg to float away.
The crack that would become B-46 was first noticed in September 2018 – and the berg broke the next month.
They’re not the biggest glaciers on the planet, but Pine Island and its neighbor, Thwaites, have an oversized impact on sea level rise. Enough ice flows from each of these West Antarctic glaciers to raise sea levels by more than 1 millimeter per decade, according to a study led by Medley. And by the end of this century, that number is projected to at least triple.
“It’s deeply concerning,” Medley said. The geography of these glaciers make them highly susceptible to ice loss: relatively warm waters cut under the ice shelf, weakening it from below. This shock to the system has the capability to initiate an unstoppable retreat of these glaciers. There’s a reason Pine Island and Thwaites are dubbed the “weak underbelly” of Antarctica.
NASA has been monitoring Pine Island Glacier from aircraft since 2002, and IceBridge started taking extensive measurements of the fast-moving ice in 2009.
“Both Pine Island and Thwaites are ready to go and to take their neighboring glaciers with them,” Medley said. “Ice is getting sucked out into the ocean – and it’s hard to stop it.”
Satellite image of ocean color showing variations in phytoplankton biomass in the Northeast Pacific Ocean (cyan colored swirls). Station P is at the bottom of the image, hidden under the clouds. Credits: NASA
Adrian Marchetti is an associate professor in the department of Marine Sciences at the University of North Carolina at Chapel Hill and was aboard the R/V Roger Revelle for the EXPORTS field campaign this August and September.
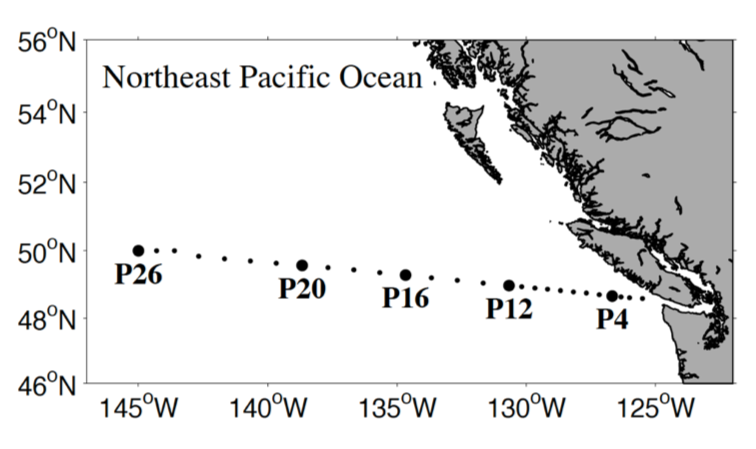
So perhaps you read about the EXPORTS cruise and have heard about this place called Station P. You are now probably wondering why NASA would fund a mission that includes two research vessels spending over three weeks at this place? Well, to some, Station P (also known as Ocean Station Papa or P26) is simply a point on a map in the middle of the North Pacific Ocean – latitude 50 degrees north, longitude 145 degrees west. But to others it is much more than that.
Historically, in the 1950’s the Canadian weather service established a program to position ships off the west coast of Canada to forecast the incoming weather and sea state conditions. Station P was occupied for six weeks at a time by one of two alternating weather ships. Spending that much time at sea at one location can get, well, boring. To help pass the time, the crew collected samples and obtained measurements of the ocean. In the early days, these included bathythermograph casts that measured ocean temperatures at various depths. As more sophisticated approaches were developed to measure additional ocean properties, they started collecting samples for analysis of seawater chemistry (salinity, nutrient concentrations, etc.), chlorophyll concentrations (used as a proxy for phytoplankton biomass) and performed the occasional plankton haul to discover what critters called Station P their home.
A few decades later, with the development of new satellite technologies that enabled the monitoring of weather conditions from space (thanks NASA!), the weather ships became obsolete, and so the program was discontinued in the early 1980s. But as a result of the decades-long time series, what became apparent was the critical need for long-term monitoring of the ocean. So the Department of Fisheries and Oceans Canada established the Line P program made up of a transect where Station P is the endpoint. Today the Line P program is one of the longest ongoing oceanographic time series.
Map of the Line P transect, ending at Station P (also known as Ocean Station Papa or P26) in the Northeast Pacific Ocean. Credits: Karina Giesbrect.
So what’s so special about Station P? Well, this mostly depends on who you ask. For one, the North Pacific is one of the largest ocean basins. It undergoes periodic oscillations on approximately decadal timescales that can influence global climate. The North Pacific also represents the finish line of a long conveyer belt that transports deep waters from far-off regions of the planet to the surface.
From a biologist’s perspective (yes, I am a biological oceanographer), Station P also happens to reside in a so-called High Nutrient, Low Chlorophyll (HNLC) region where the growth of phytoplankton is limited by the availability of the micronutrient iron. This is a relatively new discovery, and although evidence for iron limitation in this region dates back to the early 1980s, the most compelling data was obtained in 2002 when Canadian scientists performed a large-scale iron fertilization experiment at Station P. The experiment was named the Subarctic Ecosystem Response to Iron Enrichment Study, or SERIES.
I participated in SERIES as a graduate student while completing my Ph.D at the University of British Columbia. My Ph.D. research focused on pennate diatoms (a type of phytoplankton) of the genus Pseudo-nitzschiathat that dominate iron-induced blooms in many HNLC regions across the globe .
Microscope image of the pennate diatom Pseudo-nitzschia granii. Diatoms like this one are common responders to iron enrichment in many iron-limited regions of the ocean, including Station P. Credits: Adrian Marchetti.
These particular diatoms can achieve rapid growth rates at iron concentrations that would leave their coastal counterparts fully anemic and left for dead. These oceanic diatoms have many adaptations to survive in low-iron waters and sometimes flourish when new inputs of iron, which are primarily from atmospheric dust, periodically enter the ocean. Prior to SERIES I joined a number of Line P cruises adding iron to diatoms in bottles to make them bloom. We now know that not all phytoplankton are created equal and, given their extensive diversity and important role in contributing to the planet’s carbon cycle, we need to keep studying them.
During the SERIES experiment we also created a massive bloom of diatoms (you guessed it, dominated by Pseudo-nitzschia) as a consequence of adding several tons of iron to an initial patch of seawater approximately 80 square kilometers in size. At the peak of the bloom, the patch had grown to a size of about 700 square kilometers, representing one of the largest experimental manipulations on the planet to date. Fortuitously, the patch was captured by a satellite image of ocean sea surface color at the peak of the bloom, the only such image obtained throughout the entire SERIES experiment. Indeed, the North Pacific Ocean is known for having dense cloud cover almost every day of the year.
Satellite image from July of 2002 showing surface chlorophyll concentrations in the North Pacific. Warmer colors indicate more chlorophyll. The arrow is pointing to the enhanced chlorophyll concentrations due to a diatom bloom that developed as a result of the SERIES iron enrichment at Station P. Data courtesy of NASA’s SeaWiFS Project. Credits: Institute of Ocean Sciences/Jim Gower
So this brings us back to EXPORTS, which marked my seventh trip to Station P, so I am beginning to feel quite at home there. With so many measurements obtained from Station P over the span of almost seven decades, what possibly is there left for us to learn? Well, to put it bluntly—lots! In my career I have been fortunate enough to participate on a number of field missions, and by far the EXPORTS program constitutes one of the most extensive scientific undertakings I have been part of. Although, this time we were not adding iron into the ocean but instead making observations of its natural state by following the same parcel of water that passed through Station P.
Scientists retrieve an instrument that collects ocean optical measurements while aboard the R/V Revelle during the EXPORTS cruise. These optical measurements are similar to those obtained from satellites in space. Credits: Adrian Marchetti
A primary objective of EXPORTS is to quantify the components of the ocean’s biological carbon pump, the process by which organic matter from the surface waters makes it’s way to ocean depths. Scientists aboard both ships measured the processes that constitute the initial formation of organic matter by phytoplankton all the way to its export from the upper ocean or it’s remineralization back into inorganic carbon.
UNC graduate student Weida Gong hard at work collecting phytoplankton on filters aboard the R/V Revelle during the EXPORTS cruise. Credits: Adrian Marchetti.
Bacteria or little animals known as zooplankton that feed on phytoplankton, bacteria, or other small animals perform both these processes. Other scientists were focused on measuring the fate of the carbon that does sink out of the upper ocean by looking at the overall amount and what forms these sinking particles take. It was quite an undertaking that had a lot of moving parts, all happening on two moving ships.
There was also a large effort to obtain as much information about this region using a multitude of underway systems that includes mass spectrometers, particle imaging “cytobots” and flow cytometers, autonomous instruments that includes gliders, floats and wire walkers, and instruments that collect optical measurements. Although we may consider ourselves lucky if we are able to obtain more than a handful of satellite images of ocean properties from space, we are making similar measurements from ships. We are also making new measurements that do not currently exist on satellites but perhaps will one day so that we can continue to develop new ways of monitoring our precious planet from above.
Through the years we have learned a lot about how this part of the ocean operates, yet there is still so much more for us to learn. This is especially important at this period in Earth’s history as we continue to place considerable pressures on our valuable ocean resources.
And as for that postcard, well lets just say that it’s in the mail.
by Kate Ramsayer / 20,000 FEET ABOVE THE SOUTH POLE /
This was my first flight over Antarctica, and the vast expanse of ice – just white on the ground and blue in the sky as far as the eye can see – took my breath away.
As Operation IceBridge flew directly over the South Pole, my eyes went to the updating flight map. We were already off the edge of the map, as our survey line along 88 degrees south latitude had dropped below the extent of the Mercator projection. And now, as the latitude indicator counted up to 90 degrees and the crew counted down the seconds, I watched as our flight path showed the plane completely reversing course midair and looping up north. Of course, (and fortunately for my stomach) our actual DC-8 aircraft kept in a straight line.
OIB Deputy Project Scientist Brooke Medley shows the weird flight map path that results from flying around, then over, the South Pole. Credits: NASA/Kate RamsayerThe Continuous Airborne Mapping By Optical Translator (CAMBOT) system images the Amundsen-Scott South Pole station as NASA’s DC-8 flying laboratory ascends after completing a survey line. Credits: NASA/Matt Linkswiler
Navigating can be tricky at the end of the world. While the mapping software went out of whack crossing over the pole, the actual flight software didn’t miss a beat – IceBridge Mission Scientist John Sonntag programmed it that way, knowing the ice-monitoring flights would need to handle the situation.
And although Halloween was last week, Saturday’s flight called for another trick – fooling the plane into flying a smooth arc around the 88 south line of latitude.
“Basically, we hack the autopilot,” Sonntag said. “We make the aircraft think that it’s lining up on a runway in bad weather, and the pilots can’t see. But what we’re really doing is lining it up on a data collection line, and doing it very precisely.”
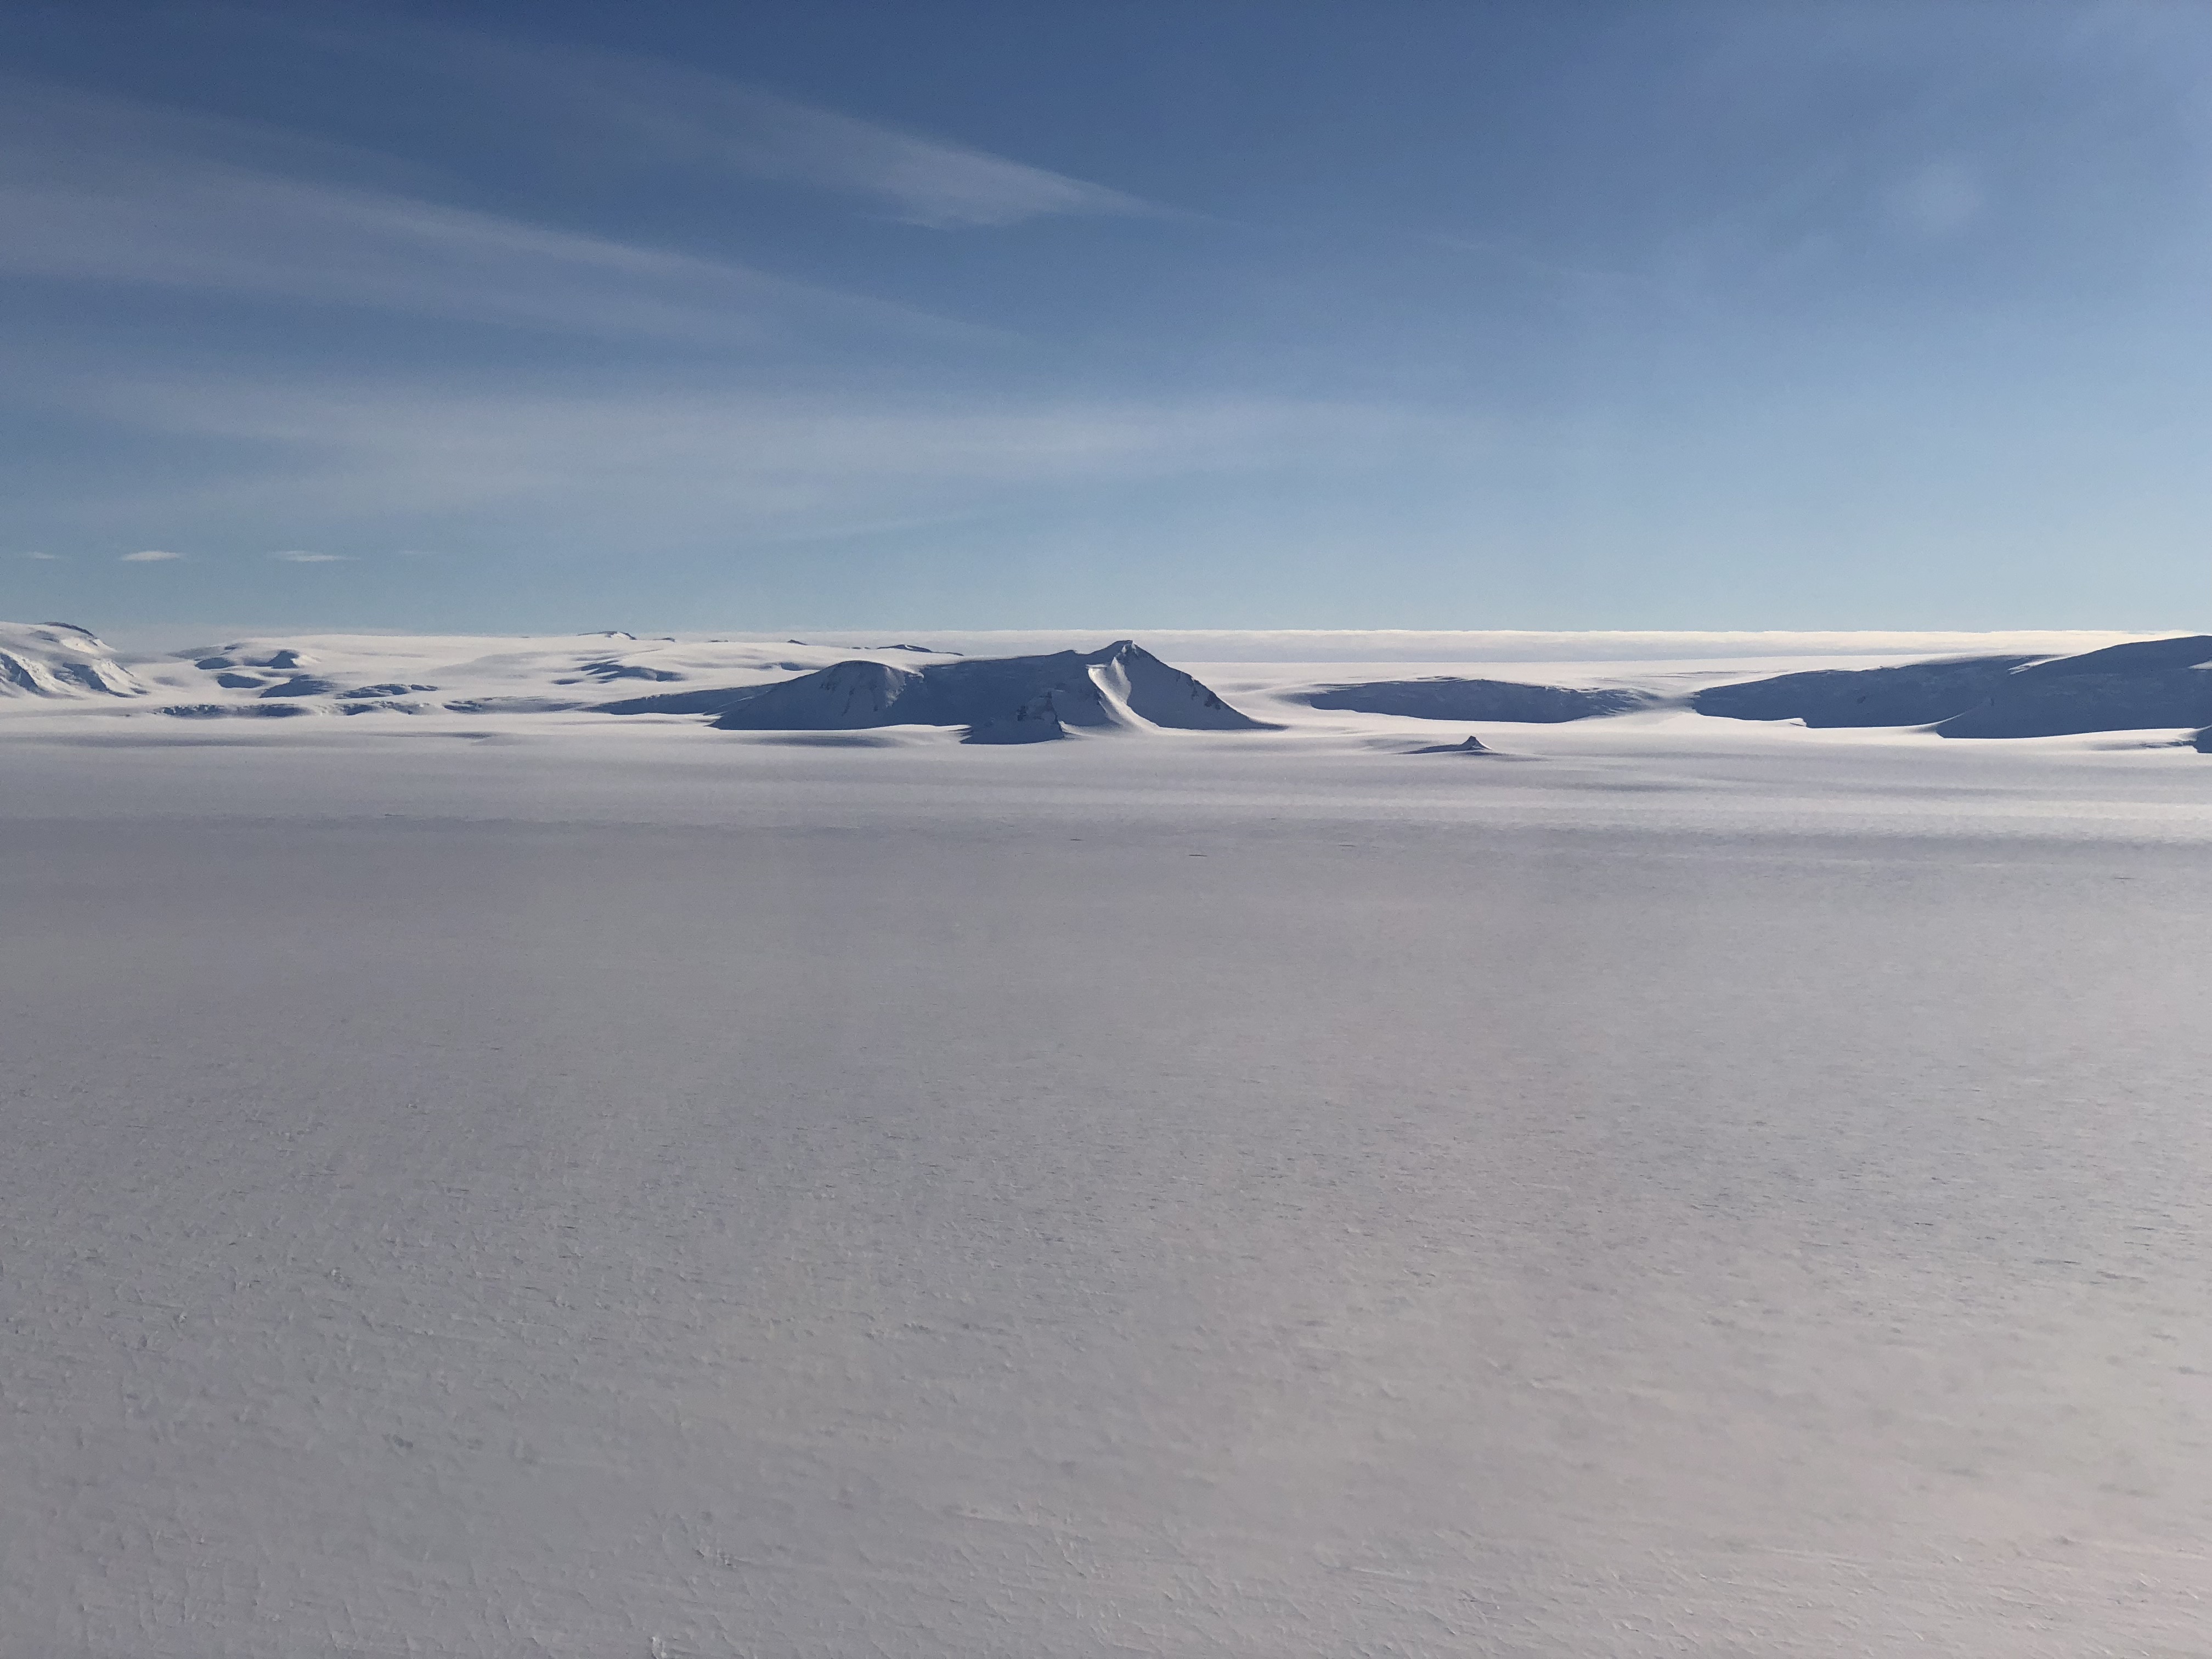
West Antarctic mountains, on the way to the South Pole. (NASA/Kate Ramsayer)
He developed this system to deal with a quirk of flying at such a high latitude. If a plane is flying at the equator and wanted to go east, it would just go straight. But to go due east along the 88 south latitude line, the plane has to actually turn to the right a bit. If we wanted to circle the pole at 89 degrees latitude, we’d have to turn right even more.
Typical navigation procedures involve flying the shortest path between two points (known as a “great circle” path), where the aircraft’s heading varies continually to keep it on the flight path. But this far south, that would create a scalloped flight path: not efficient for the plane nor optimal for the instruments onboard, and – again – not friendly to my stomach. So Sonntag designed an autopilot system that can fly a perfect, smooth arc around the pole, along a mathematical concept called a loxodrome.
“I’m half engineer and half scientist, and this flight brings out the engineer nerd in me – I love this stuff,” Sonntag said. “Then seeing this in use, flying a 350,000-pound airplane around the South Pole – I mean, it’s nerd heaven.”
Sastrugi are fragile shapes on top of snow that are formed by winds. Sastrugi near the South Pole suggest there are two dominant wind directions. Credits: NASA/Brooke Medley
It was nerd heaven for me as well, but for different reasons. This was my first flight over Antarctica, and the vast expanse of ice – just white on the ground and blue in the sky as far as the eye can see – took my breath away.
This particular survey route isn’t a favorite with the regular crew. There’s none of the dramatic mountains of the coastal glaciers, or icebergs calving into sea ice. But I loved seeing the repeating kaleidoscope patterns of the ice dunes called sastrugi (a favorite word AND a favorite ice formation, all in one!). From 1,500 feet up, it’s almost impossible to gauge how high they are, but it’s an incredible texture in this bleak, bright expanse of ice.
And this was a key flight for another reason: I’ve been writing for the ICESat-2 mission for more than five years, and in September I watched as it launched into orbit. ICESat-2 uses a laser instrument to measure the height and focuses on the polar regions. All of its orbits cross the globe at – you guessed it – 88 south latitude. So by flying this route a third of the way around the 88 south latitude circle, IceBridge is taking measurements that will help check a third of ICESat-2’s orbits.
The ATLAS lidar on ICESat-2 uses three pairs of laser beams to measure Earth’s elevation and elevation change. As a global mission, ICESat-2 collects data over the entire globe. However the ATLAS instrument is optimized to measure land ice and sea ice elevation in the polar regions, as is shown by this graphic representation of its orbital path around the South Pole. Credits: NASA
That means the satellite instrument I saw years ago when it was just an empty box in a cleanroom flew over that stretch of ice we measured 16 times, taking 60,000 height measurements each second. From 300 miles up, it measured the height of my new favorite sastrugi.
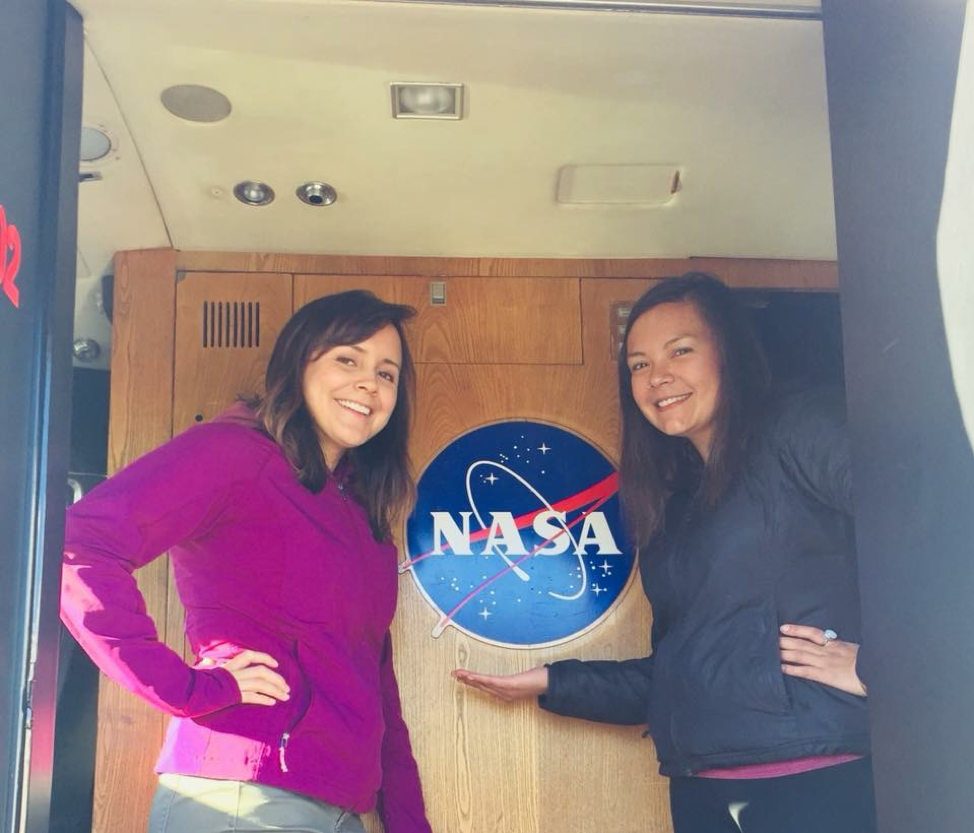
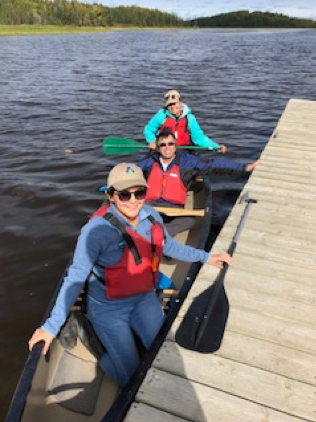
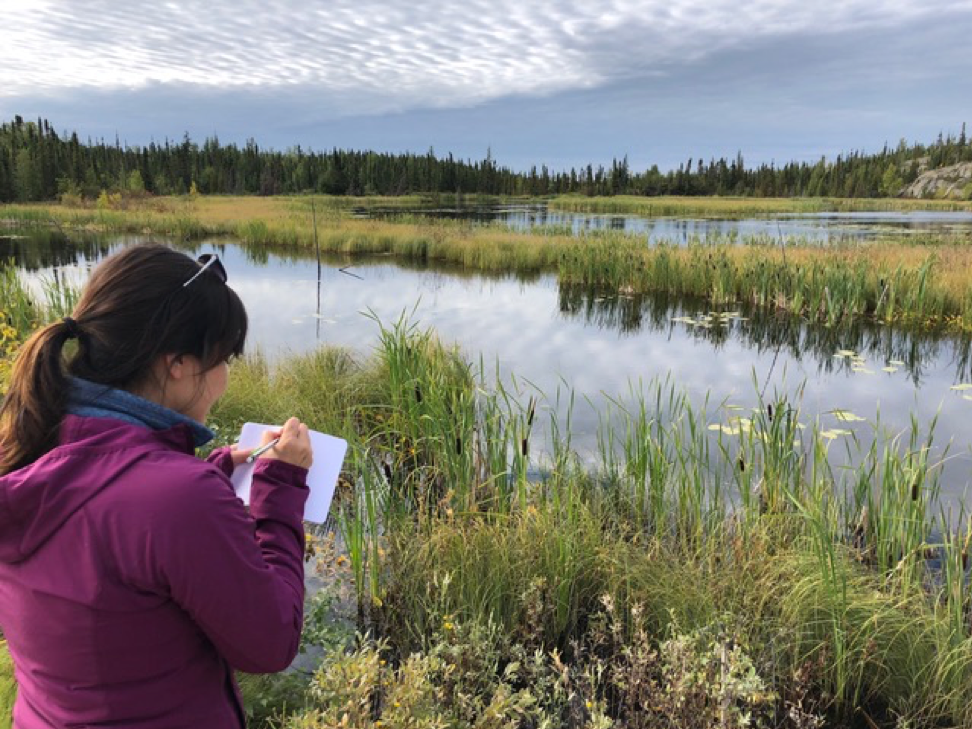
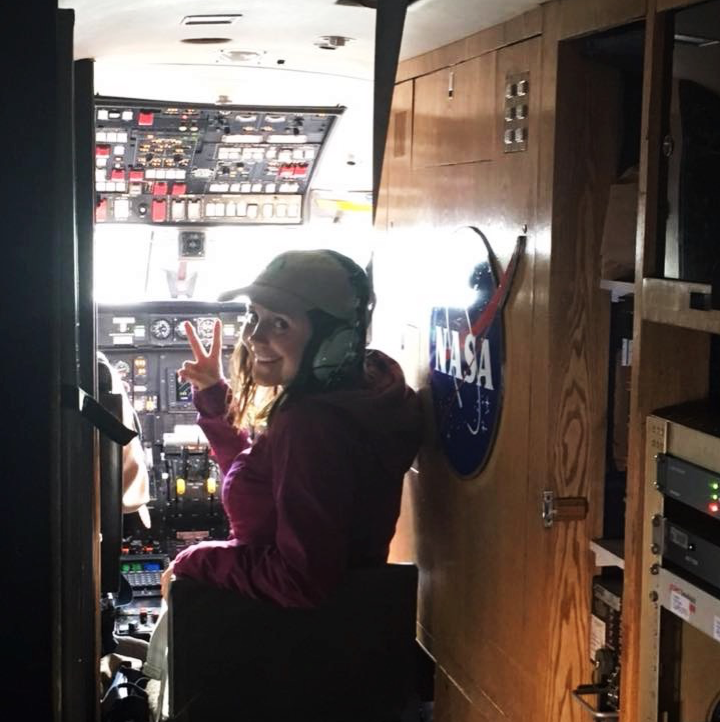
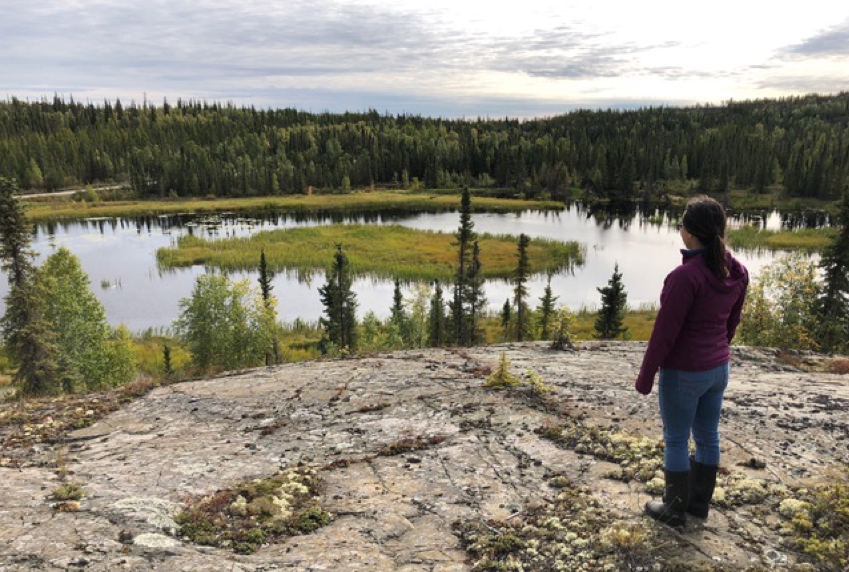
University environmental science students Joanne Spearman (left) and Mandy Bayha, from the Northwest Territories in Canada, inside NASA’s Gulfstream III jet during an ABoVE flight. Credits: NASA
My name is Mandy Bayha and I am from a small community called Délįnę [pronounced De-lee-nay] in Canada’s Northwest Territories. With a population of about 500, the community is nestled on the shores of the southwest Keith arm of the beautiful Great Bear Lake. The Sahtúotįnę (which means “people of Great Bear Lake”) have been its only inhabitants since time immemorial. The community is rich in culture and language and has a deep sense of love and connection to the land, especially the lake. I am a student in environmental science and conservation biology and also the indigenous healing coordinator (an initiative called “Sahtúotįnę Nats’eju”) for the Délįnę Got’įnę government. Under the guidance and mentorship of the elders, knowledge holders, and leadership of my community, I have been tasked to facilitate and implement a pilot project that aims to bridge the gap between traditional knowledge and western knowledge to create a seamless and holistic approach to health and wellness.
Traditional knowledge is relevant to everything we do, from healing, governance, and environmental management to early childhood development and education. Traditional knowledge encompasses virtually every human relationship and dynamic and outlines our relationships with each another, our Mother Earth, and our creator. As our elders say, “We are the land and the land is us. The land provides everything to us and is like a mother to us all and we all come from her.” It is our belief that everything is interconnected and in a constant relationship, forever and always.
On August 20 I traveled to Yellowknife to participate in the Arctic-Boreal Vulnerability Experiment, or ABoVE. Currently in its second year, this 10-year project is focused on the vulnerability and resilience of the Arctic and on understanding the effects of climate change on such a delicate ecosystem. ABoVE is important because it can provide a holistic view of climate change in the north by bringing together two knowledge systems: the traditional knowledge of my ancestors and western science. In fact, the project’s first guiding principle is to “recognize the value of traditional knowledge as a systematic way of thinking which will enhance and illuminate our understanding of the Arctic environment and promote a more complete knowledge base.”
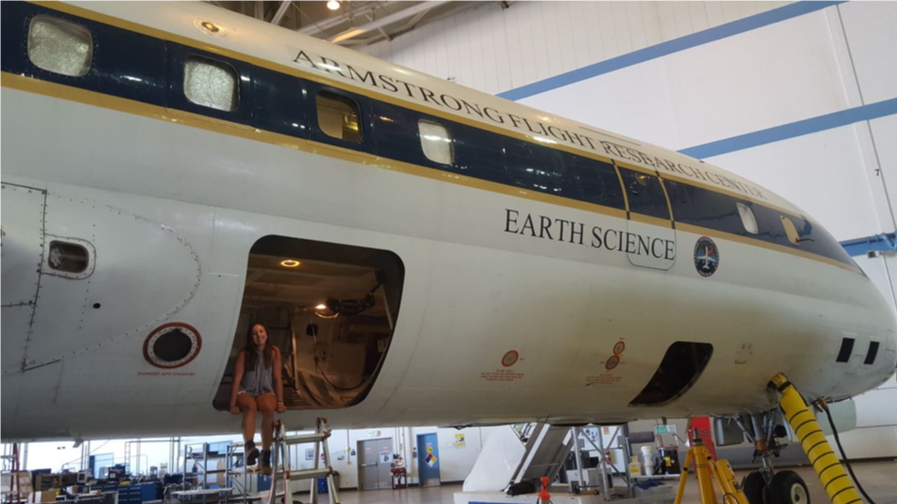
I was able to participate in this incredible opportunity with a fellow Délįnę woman named Joanne Speakman, who is also an environmental science student. Our first day started on August 22, bright and early at 8 o’clock in the morning. We met the flight team at the Adlair Aviation hanger to undergo a safety briefing and egress training. It was like walking into a scene from the movie Armageddon. The two ex-U.S. Air Force test pilots were speaking a technical language riddled in codes, and the remote sensing engineers were spouting their checks and balances. I was thrilled to be surrounded by NASA employees all adorned in patches, jumpsuits, and ball caps. Afterward, Dr. Peter Griffith, the project lead, explained everything to Joanne and me in plain language. We then took a tour of the plane and learned how to exit in the unlikely event of an emergency. We were treated so nicely, and I felt more than welcome to participate.
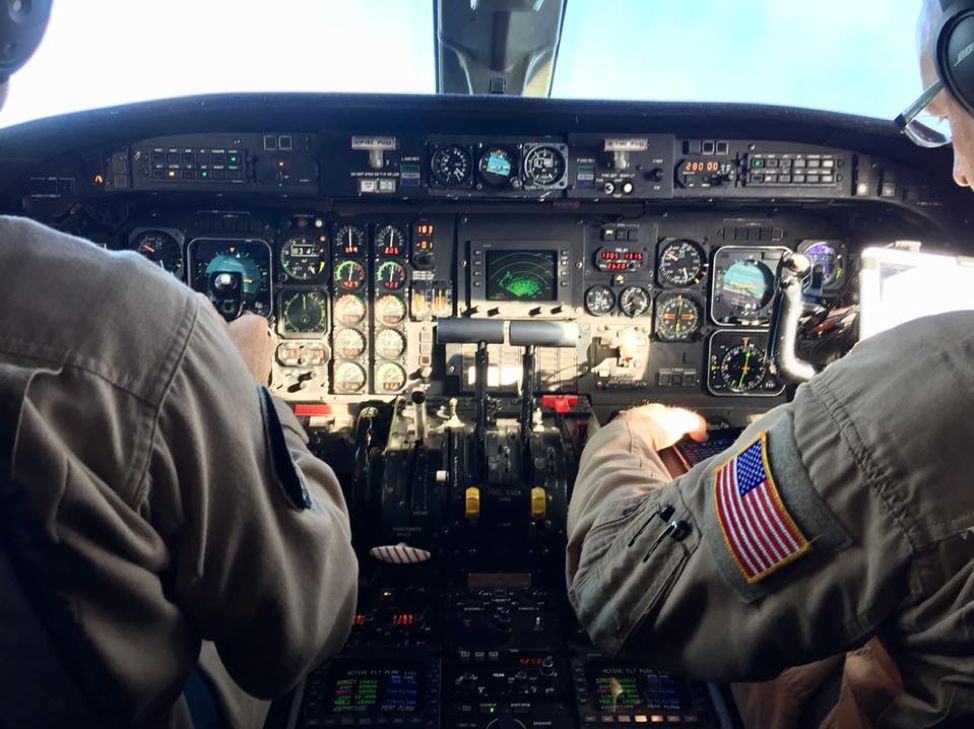
We were invited to sit in a jump seat situated right behind the pilots during take-off and landing. Joanne got take-off and I got landing. What an experience that was! During our four-hour flight, which took us from Yellowknife to Scotty Creek (a permafrost research site near Fort Simpson), Kakisa, Fort Providence, and back to Yellowknife, Dr. Griffith sat with us and explained the ABoVE project. He gave us background on how the “lines”—the strips of areas that were scanned by the radar—were chosen and filled us in on research done in those areas previously, such as major burn sites, permafrost melt, carbon cycling, and methane levels. He referred to pictures while explaining how certain equipment as well as ground data calibration and validation techniques were used.
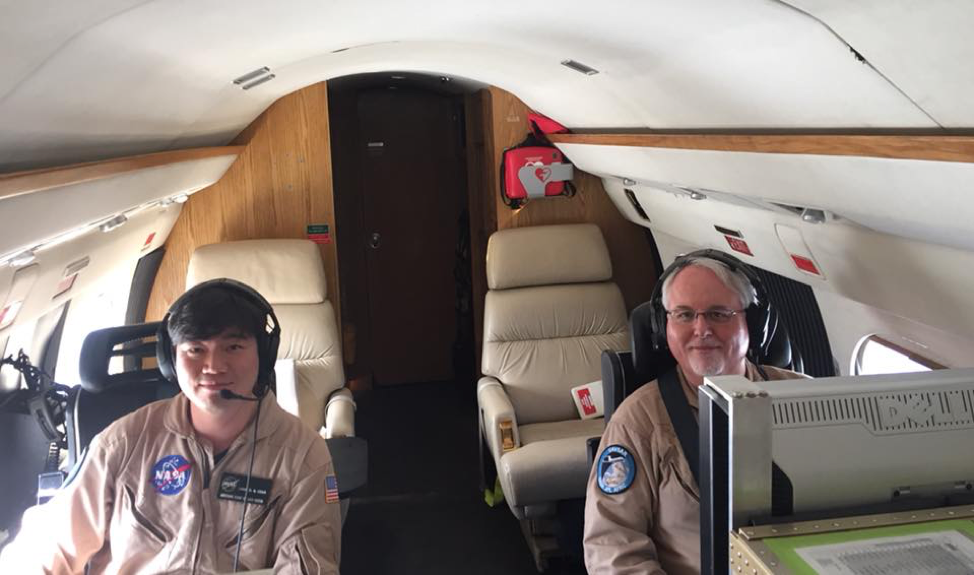
At work in the Gulfstream jet were flight engineer and navigator Sam Choi from NASA’s Armstrong Flight Research Center and radar operator Tim Miller from NASA’s Jet Propulsion Laboratory. Credits: Joanne Speakman
We also chatted with engineers from NASA’s Jet Propulsion Laboratory in Pasadena, California, who manned the remote sensing station on the flight. They explained that the remote sensing equipment, which was welded to the bottom of the Gulfstream III jet, is made of many tiny sensors that send signals to the ground that bounce back to a receiving antenna on the aircraft. The resulting data tell a story of what is happening on Earth’s surface, revealing features such as inundation (marshy areas where vegetation is saturated with water) and the rocky topography from the great Canadian shield, for example. The sensor they’re using is called an L-band synthetic aperture radar (SAR), which has a long wavelength ideal for penetrating the active layer in the soil. This is important for many reasons but mainly for indicating soil moisture.
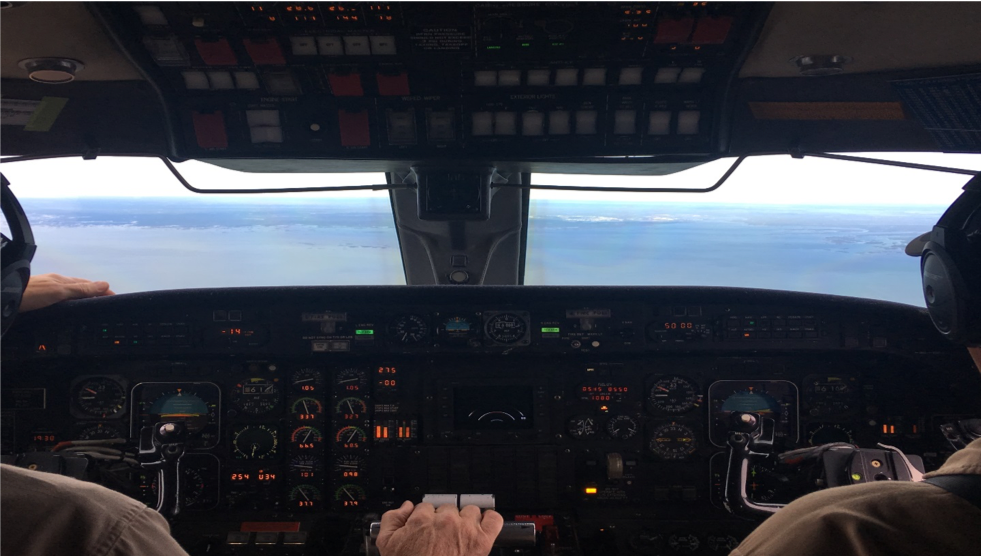
Mandy Bayha gets a pilot’s view from the jupm seat as the NASA Gulfstream III comes in for landing, the town of Yellowknife on the shores of Great Slave Lake in view. Credits: Mandy Bayha
When flying above target areas, the pilots had to position the plane precisely on the designated lines to trigger the L-band SAR on the bottom of the plane, which would put the aircraft on autopilot mode and allow the sensor to “fly” the plane for the entire length of scanning the line. Once the scan was complete, the pilots would then take control of the plane again. The precision and accuracy for all those things to work in tandem was extraordinary to witness.
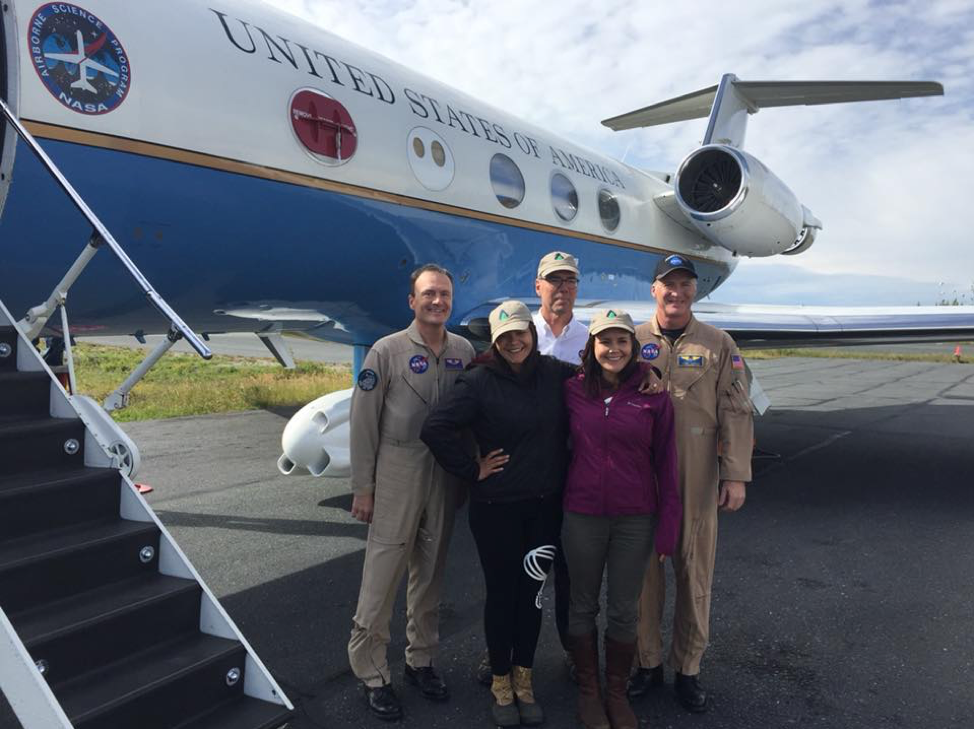
After the last scan, I hopped into the jump seat directly behind the pilots and watched them land the plane. Once on the ground, we were greeted by reporters with Cabin Radio (a local NWT radio station) who interviewed us and took our pictures with the Gulfstream III jet in the background. It was an absolute honor and a once-in-a-lifetime experience that I will never forget.
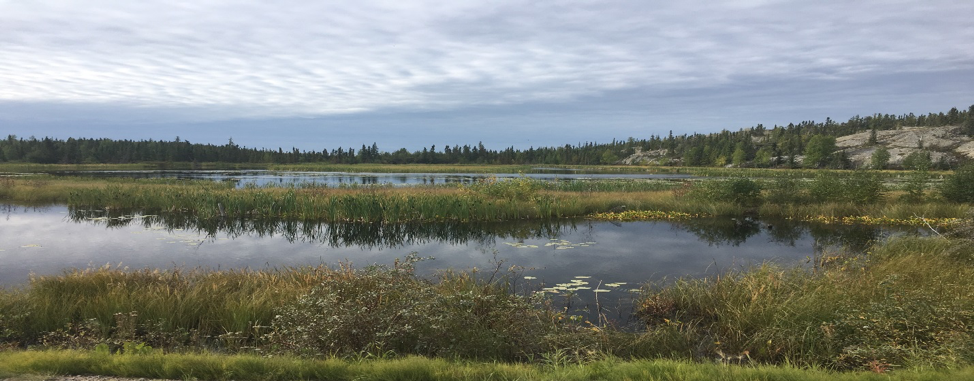
Fortunately, our incredible journey with NASA wasn’t yet complete. Joanne and I tagged along with two scientists, Paul Siqueira and Bruce Chapman, who are helping to build an Earth-orbiting satellite called the NASA-ISRO Synthetic Aperture Radar, or NISAR. We met up with Paul and Bruce early on the morning of August 24 and identified two lakes located just off the Ingraham Trail, a few kilometers outside of Yellowknife, to collect data that will help in the creation of algorithms to capture and interpret wetland and inundated sites via satellite and remote sensing. We reached the shores of the first lake and split into two groups, one scientist and one student per group. We walked in separate directions in areas of inundation between the open water and the treeline surrounding the lake and took measurements using an infrared laser for accurate distances between the treeline and open water and made estimations and diagrams to fully detail the ground view.
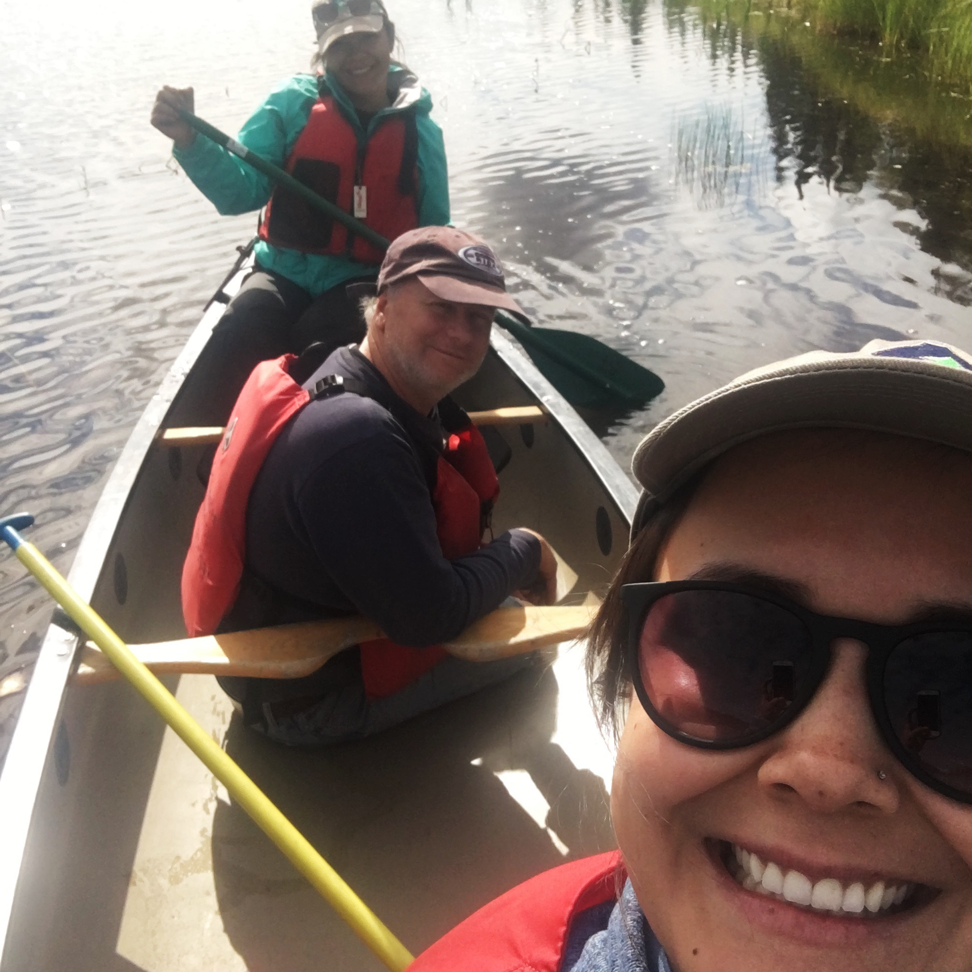
A lake located just off the Ingraham Trail, a few kilometers outside of Yellowknife in Canada’s Northwest Territories, where data was collected that will help in the creation of algorithms to capture and interpret wetland and inundated sites via satellite and remote sensing. Credits: Mandy BayhaUniversity of Massachusetts Amherst scientist Paul Siqueira enjoyed the last canoe ride of the day with Joanne Speakman and Mandy Bahya. Credits: NASA/Bruce Chapman
We tackled the second lake with a canoe and could not have asked for better weather. We enjoyed our afternoon bathed in the sun. The waterfowl and minnows shared their home with us for a time. During our canoe ride, we learned a lot more about our scientist friends. They were part of a launch that carried some of the first remote sensing technology into space. This technology was then used to study the surface of Venus and Mars. How fortunate were Joanne and I to be able to listen and learn from such a brilliant crew of scientists who have had amazing careers.
It was an enriching and humbling experience to participate in the ABoVE project. If an organization such as NASA realizes that indigenous traditional knowledge is both valid and important, then I am hopeful for our next generation of indigenous people. I believe that this is the first step in reconciliation: acknowledgment and appreciation. I would be honoured to participate again; however, I am more than grateful to know that there is this collaboration happening and that it includes the indigenous Dene of the north.
New sea ice growing in a lead at different stages of formation with the pink skies creating nice lighting on the ice. Credits: NASA/Linette Boisvert
by Linette Boisvert / PUNTA ARENAS, CHILE /
This mission, called Mid-Weddell, is probably the most complex of not only the fall 2018 Antarctic campaign but all of IceBridge.
Overnight I got to take part in a truly historic Operation IceBridge (OIB) mission and I couldn’t be more happy or excited to tell you all about it! This mission, called Mid-Weddell, was probably the most complex of not only the fall 2018 Antarctic campaign but all of IceBridge. To add to this, some unforeseen issues made this particular mission difficult. Upon landing after our previous mission, we were informed that there was a local fuel trucker strike. This meant NO FUEL for all of Punta Arenas, Chile. So we had no fuel for our plane, which meant we couldn’t fly the next day and had no clue when this strike would be resolved.
The strike was resolved after a few days, but the Mid-Weddell mission was again delayed when we found out that there were cracks in the NASA DC-8 pilot’s window. A new one had to be sent from Palmdale, California, and installed before we could fly again.
Local Chilean fuel truckers burning tires along the side of the road in protest. Credits: NASA/Jeremy Harbeck
NASA’s DC-8 Crew replacing the pilot’s window. Credits: Kyle Krabill
After all of these added stressors, we began to worry that we wouldn’t even be able to pull off this mission because it was an overnight flight and had to be timed perfectly with an ICESat-2 satellite overpass. These two mandatory factors are not so easy to achieve based on: 1) The weather in the Weddell Sea has to be clear, as in no low or high clouds, so that ICESat-2 can see the sea ice that we are flying over; 2) there has to be a crossover of ICESat-2 in the middle of the night and in the middle of the Weddell Sea.
Map of the Mid-Weddell sea ice mission. Credits: NASA/John Sonntag
In order to make things easier on ourselves (please note my sarcasm here), we were also “chasing the sea ice” during this flight. Why do we need to chase the sea ice, one might ask? Because sea ice, frozen floating sea water, is constantly in motion, being forced around by winds and ocean currents. This makes it rather difficult to fly over the same sea ice as ICESat-2 because the satellite can fly over our entire science flight line in about 9 seconds, where as it takes us multiple hours to do so by plane. Thus, in order to fly over the same sea ice, the sea ice must be chased during flight.
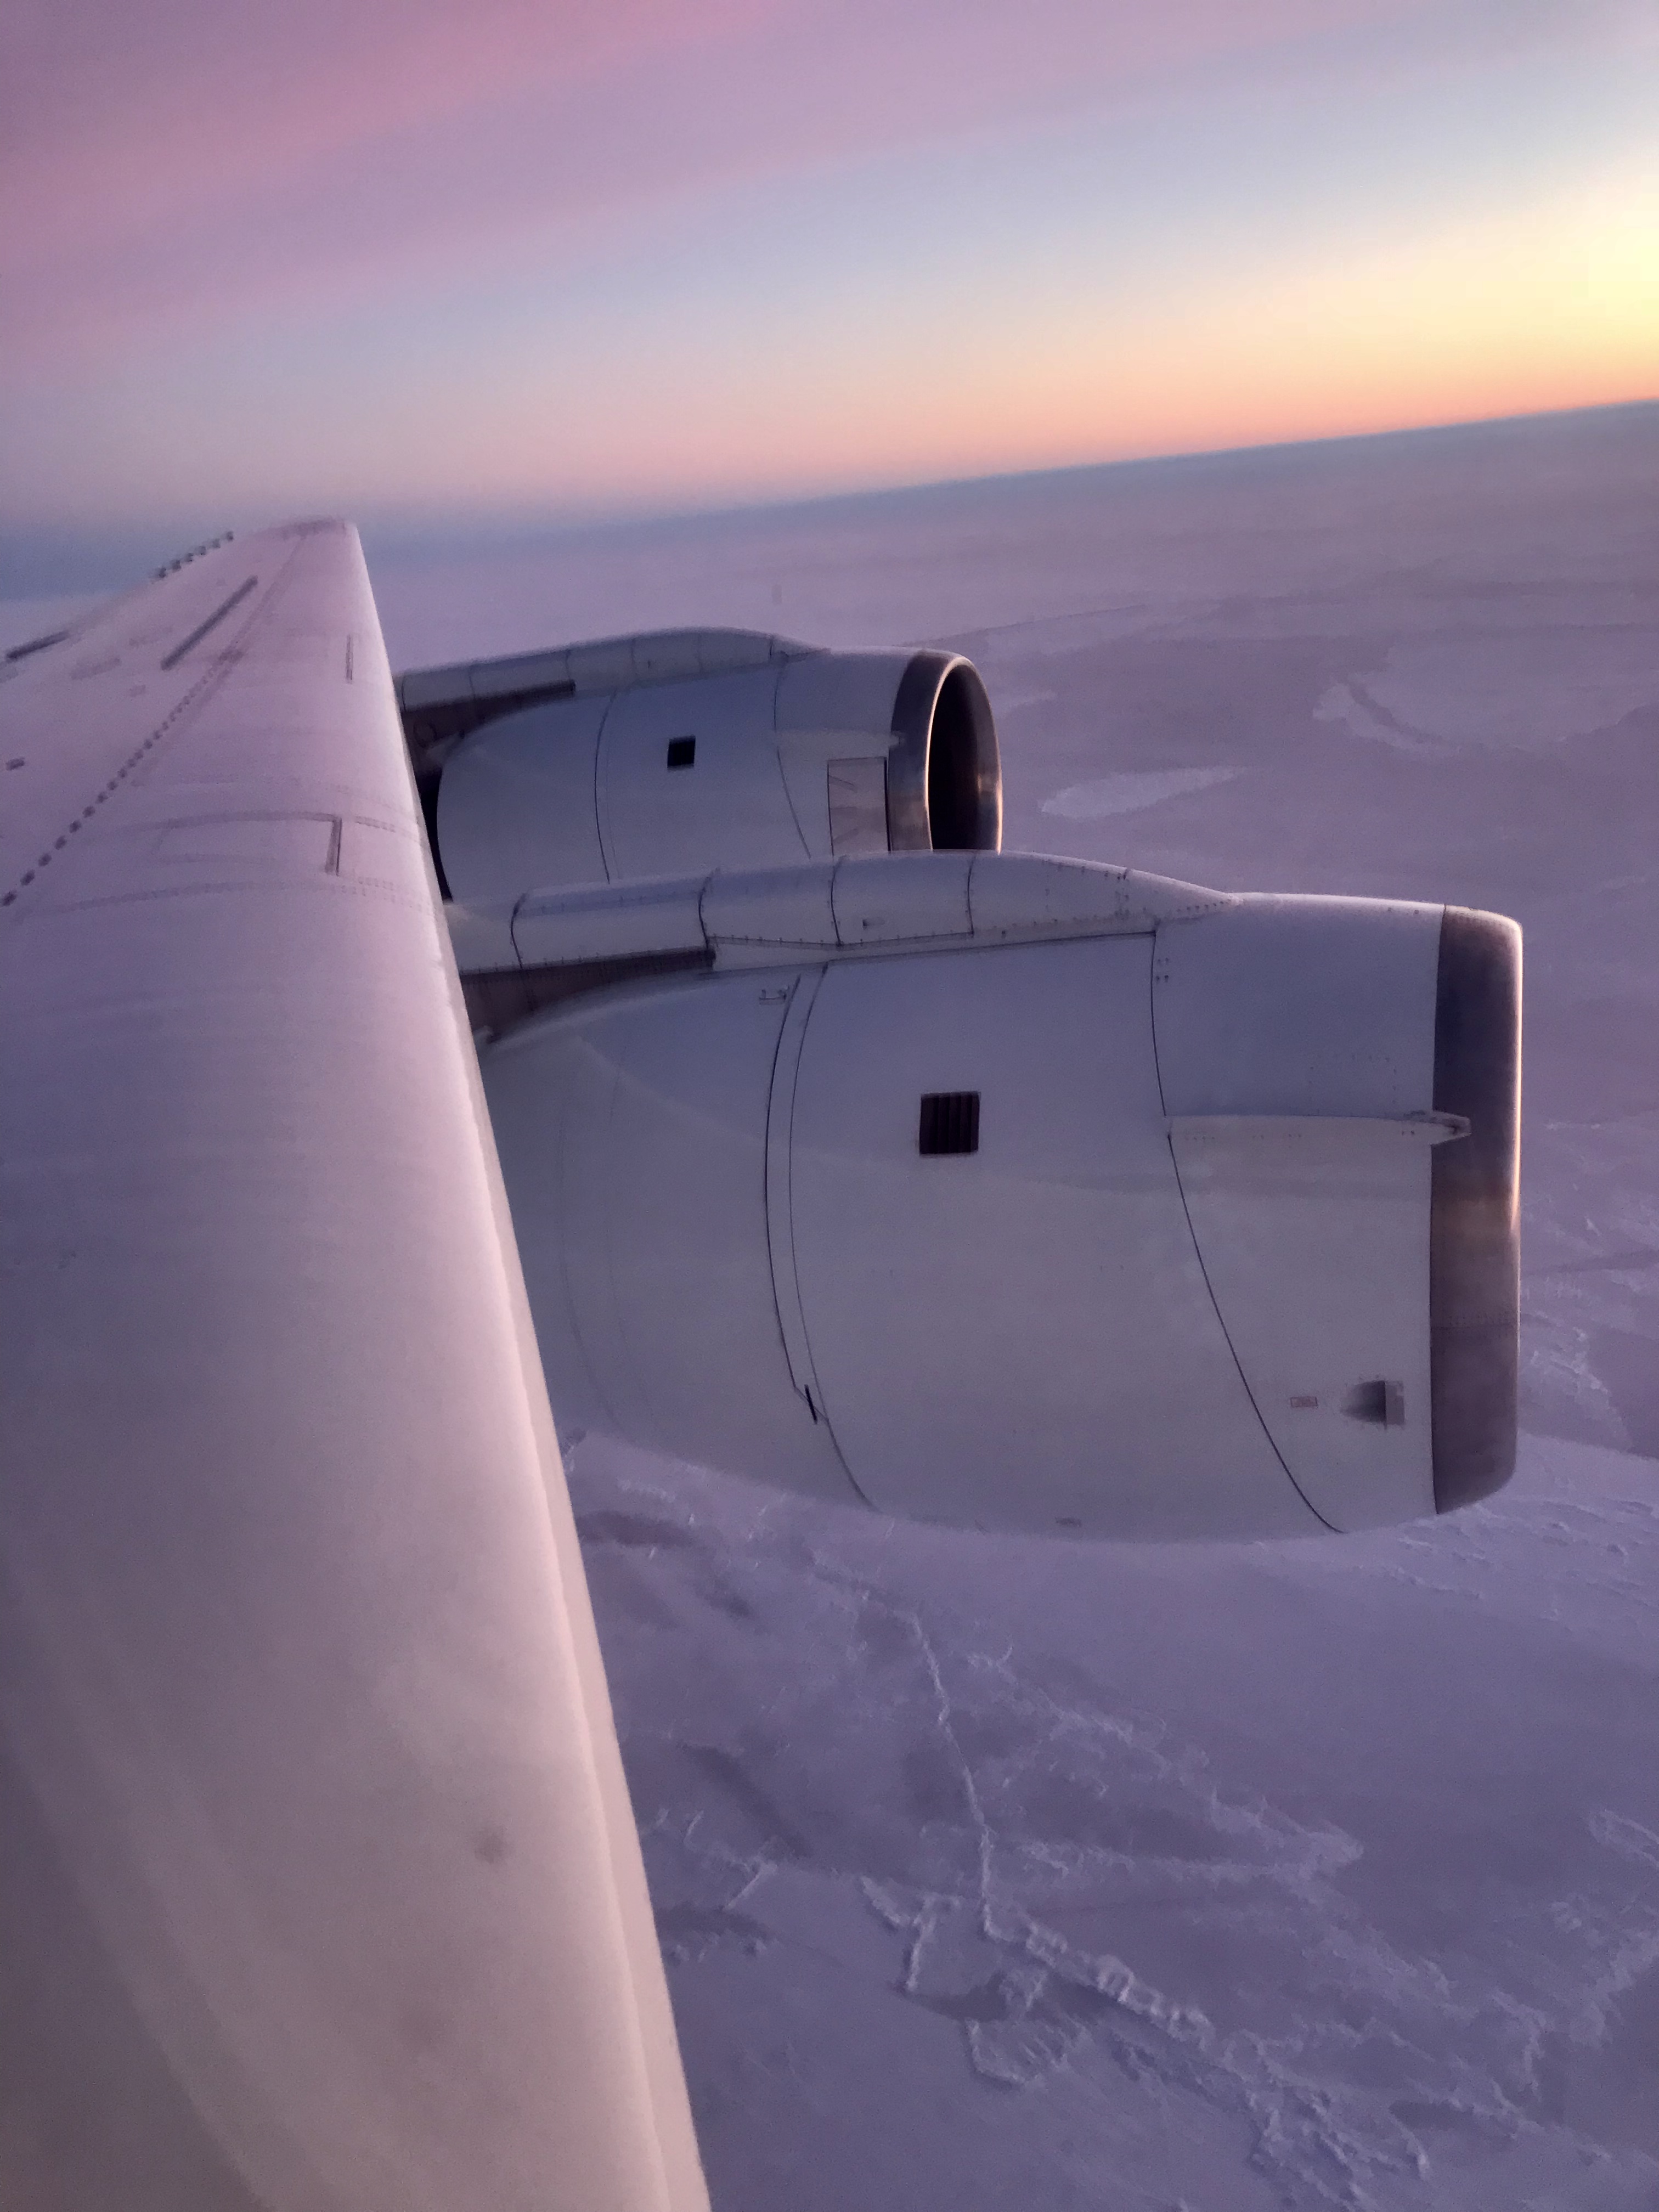
A view of NASA’s DC-8 engines and wing as we were chasing the sea ice below. Credits: NASA/Linette Boisvert
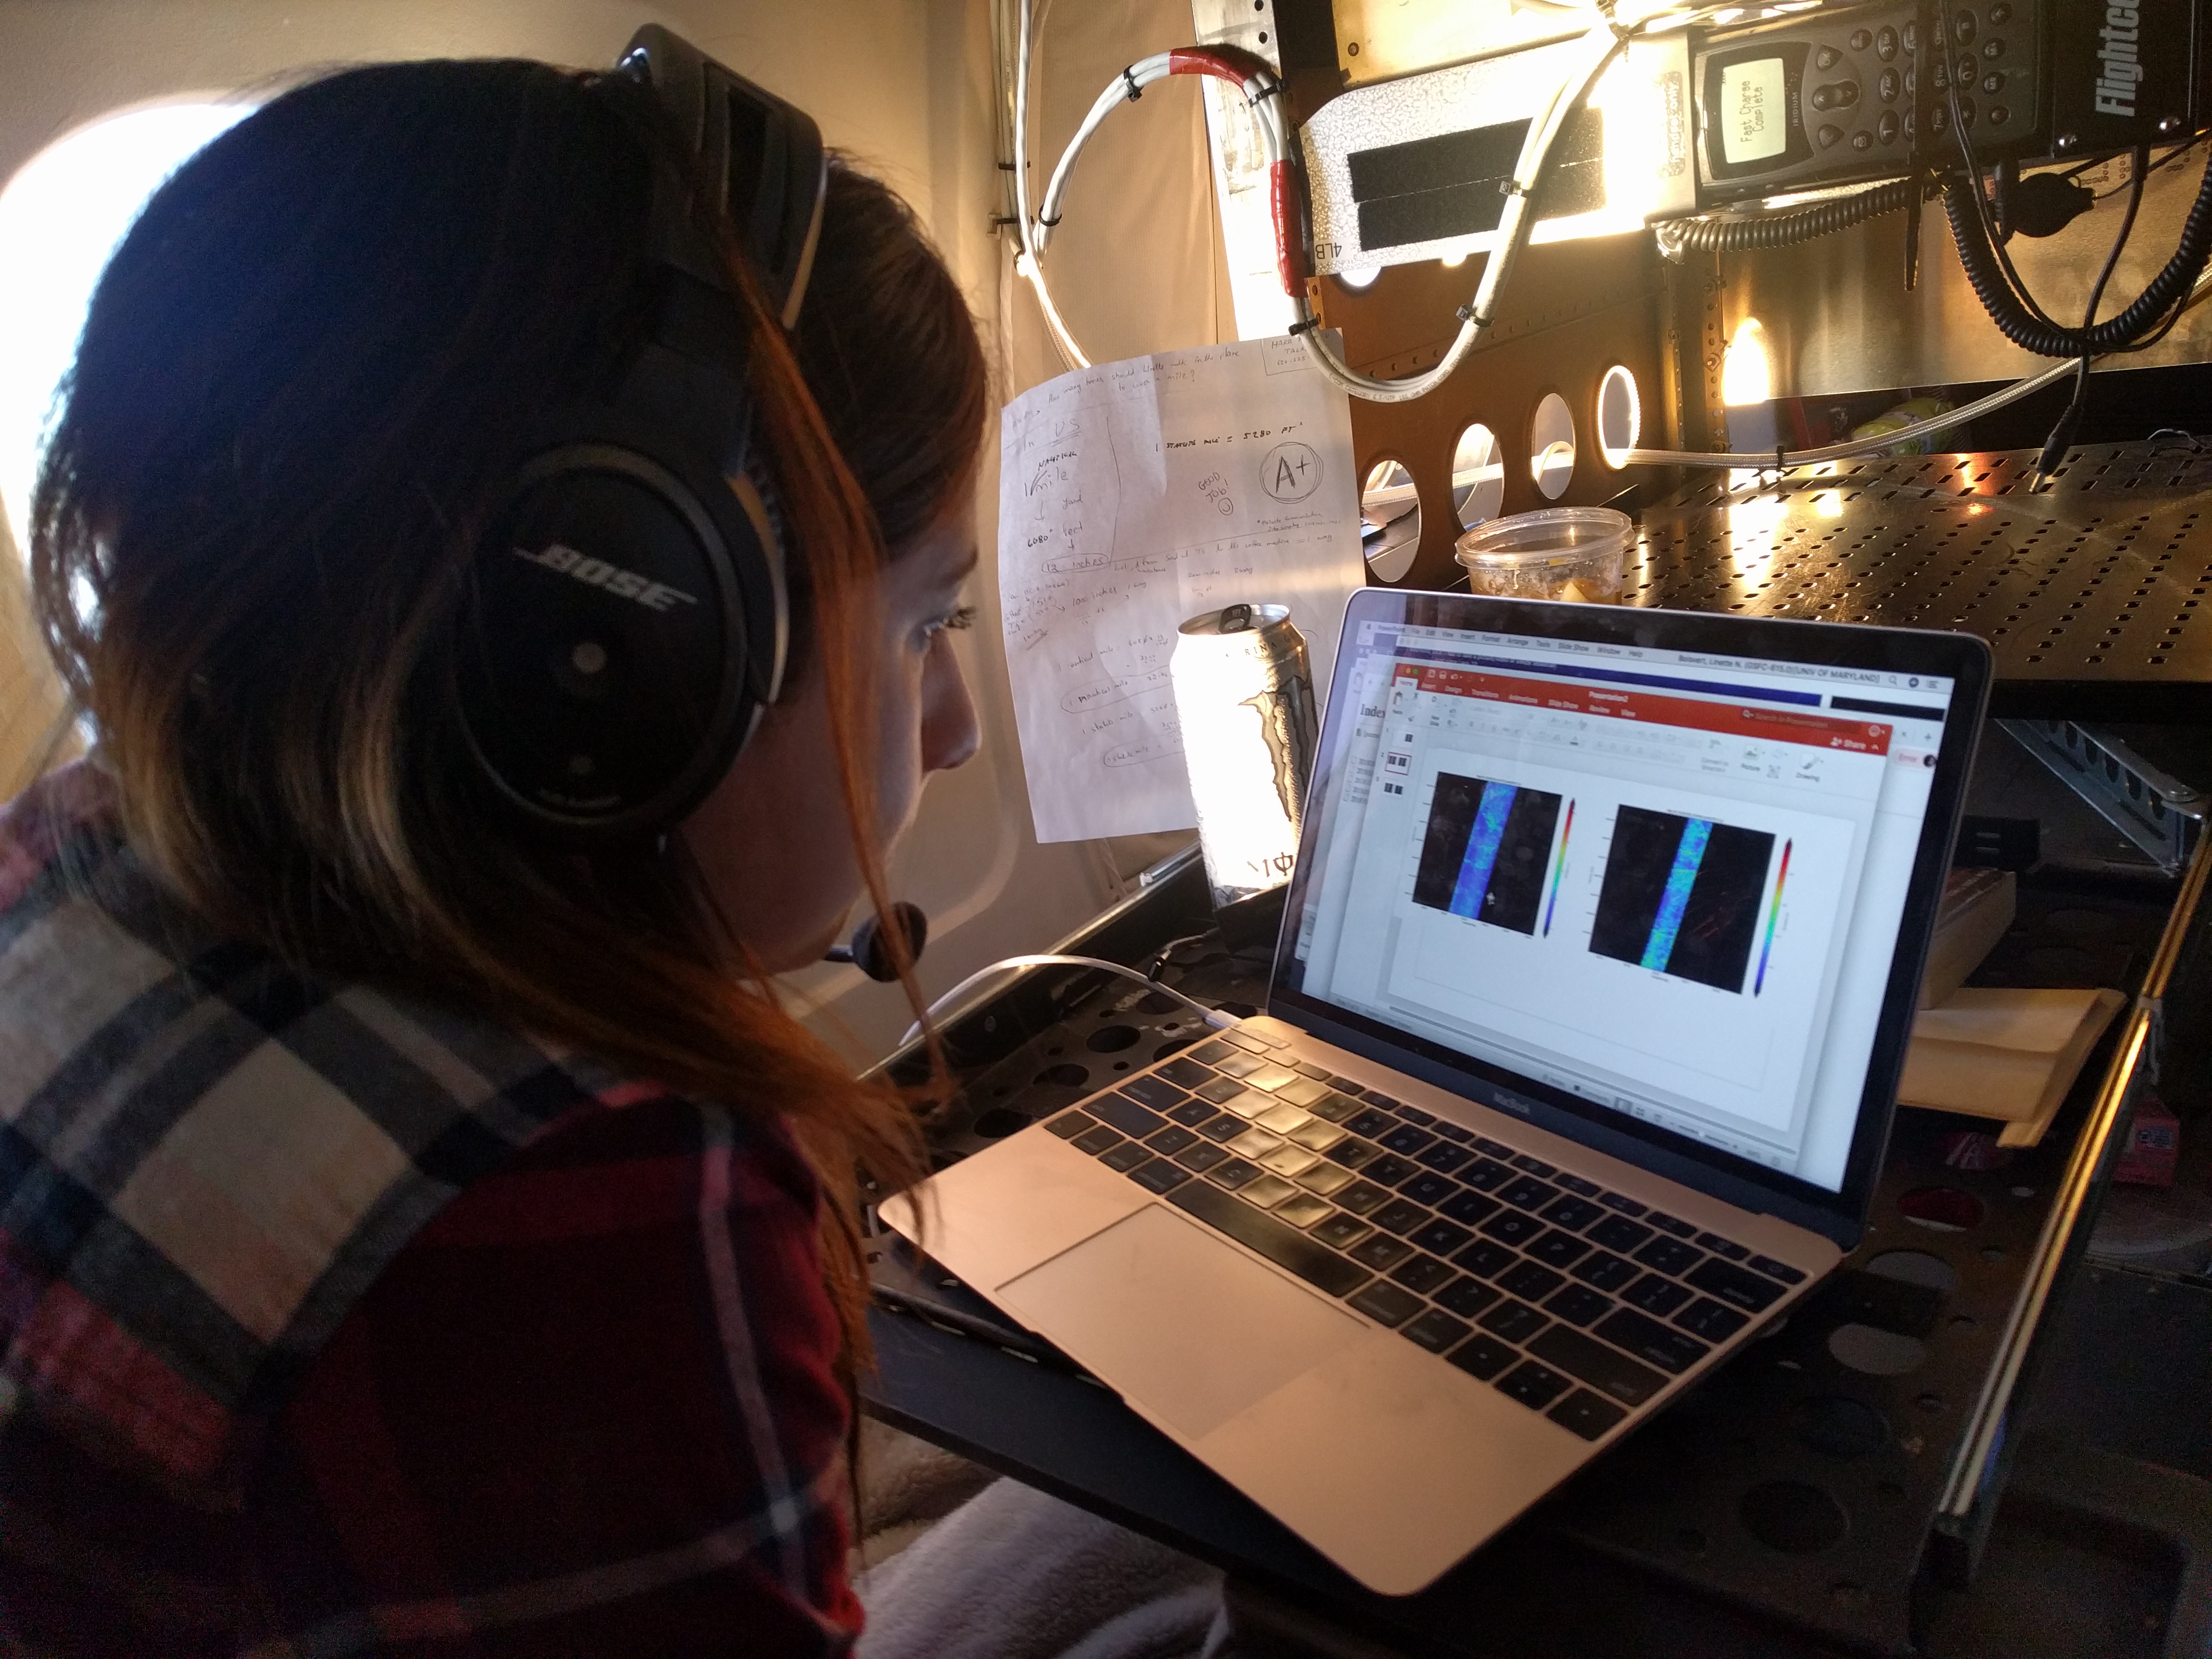
Chasing the sea ice is essentially my OIB baby project, and before this campaign I diligently worked on writing code that would take in our latitudes and longitudes along our flight path, and, depending on the wind speed, wind direction, and our altitude from the plane, determine where the sea ice that ICESat-2 flew over would have drifted by the time our plane got there. This way we could essentially fly over the same sea ice that the satellite flew over. To do this we asked the pilots to take the plane down to 500 feet (yes, 500 FEET!!) above the surface and stay there for roughly a minute in order to take wind measurements. I then plugged these values into my code program and changed our flight path so that we could fly over the same sea ice. We monitored the winds during flight, and if they changed significantly we would do this maneuver again. Now how cool is that? I was in charge of changing our flight path as we flew! Can’t say I’d ever “flown” a plane before.
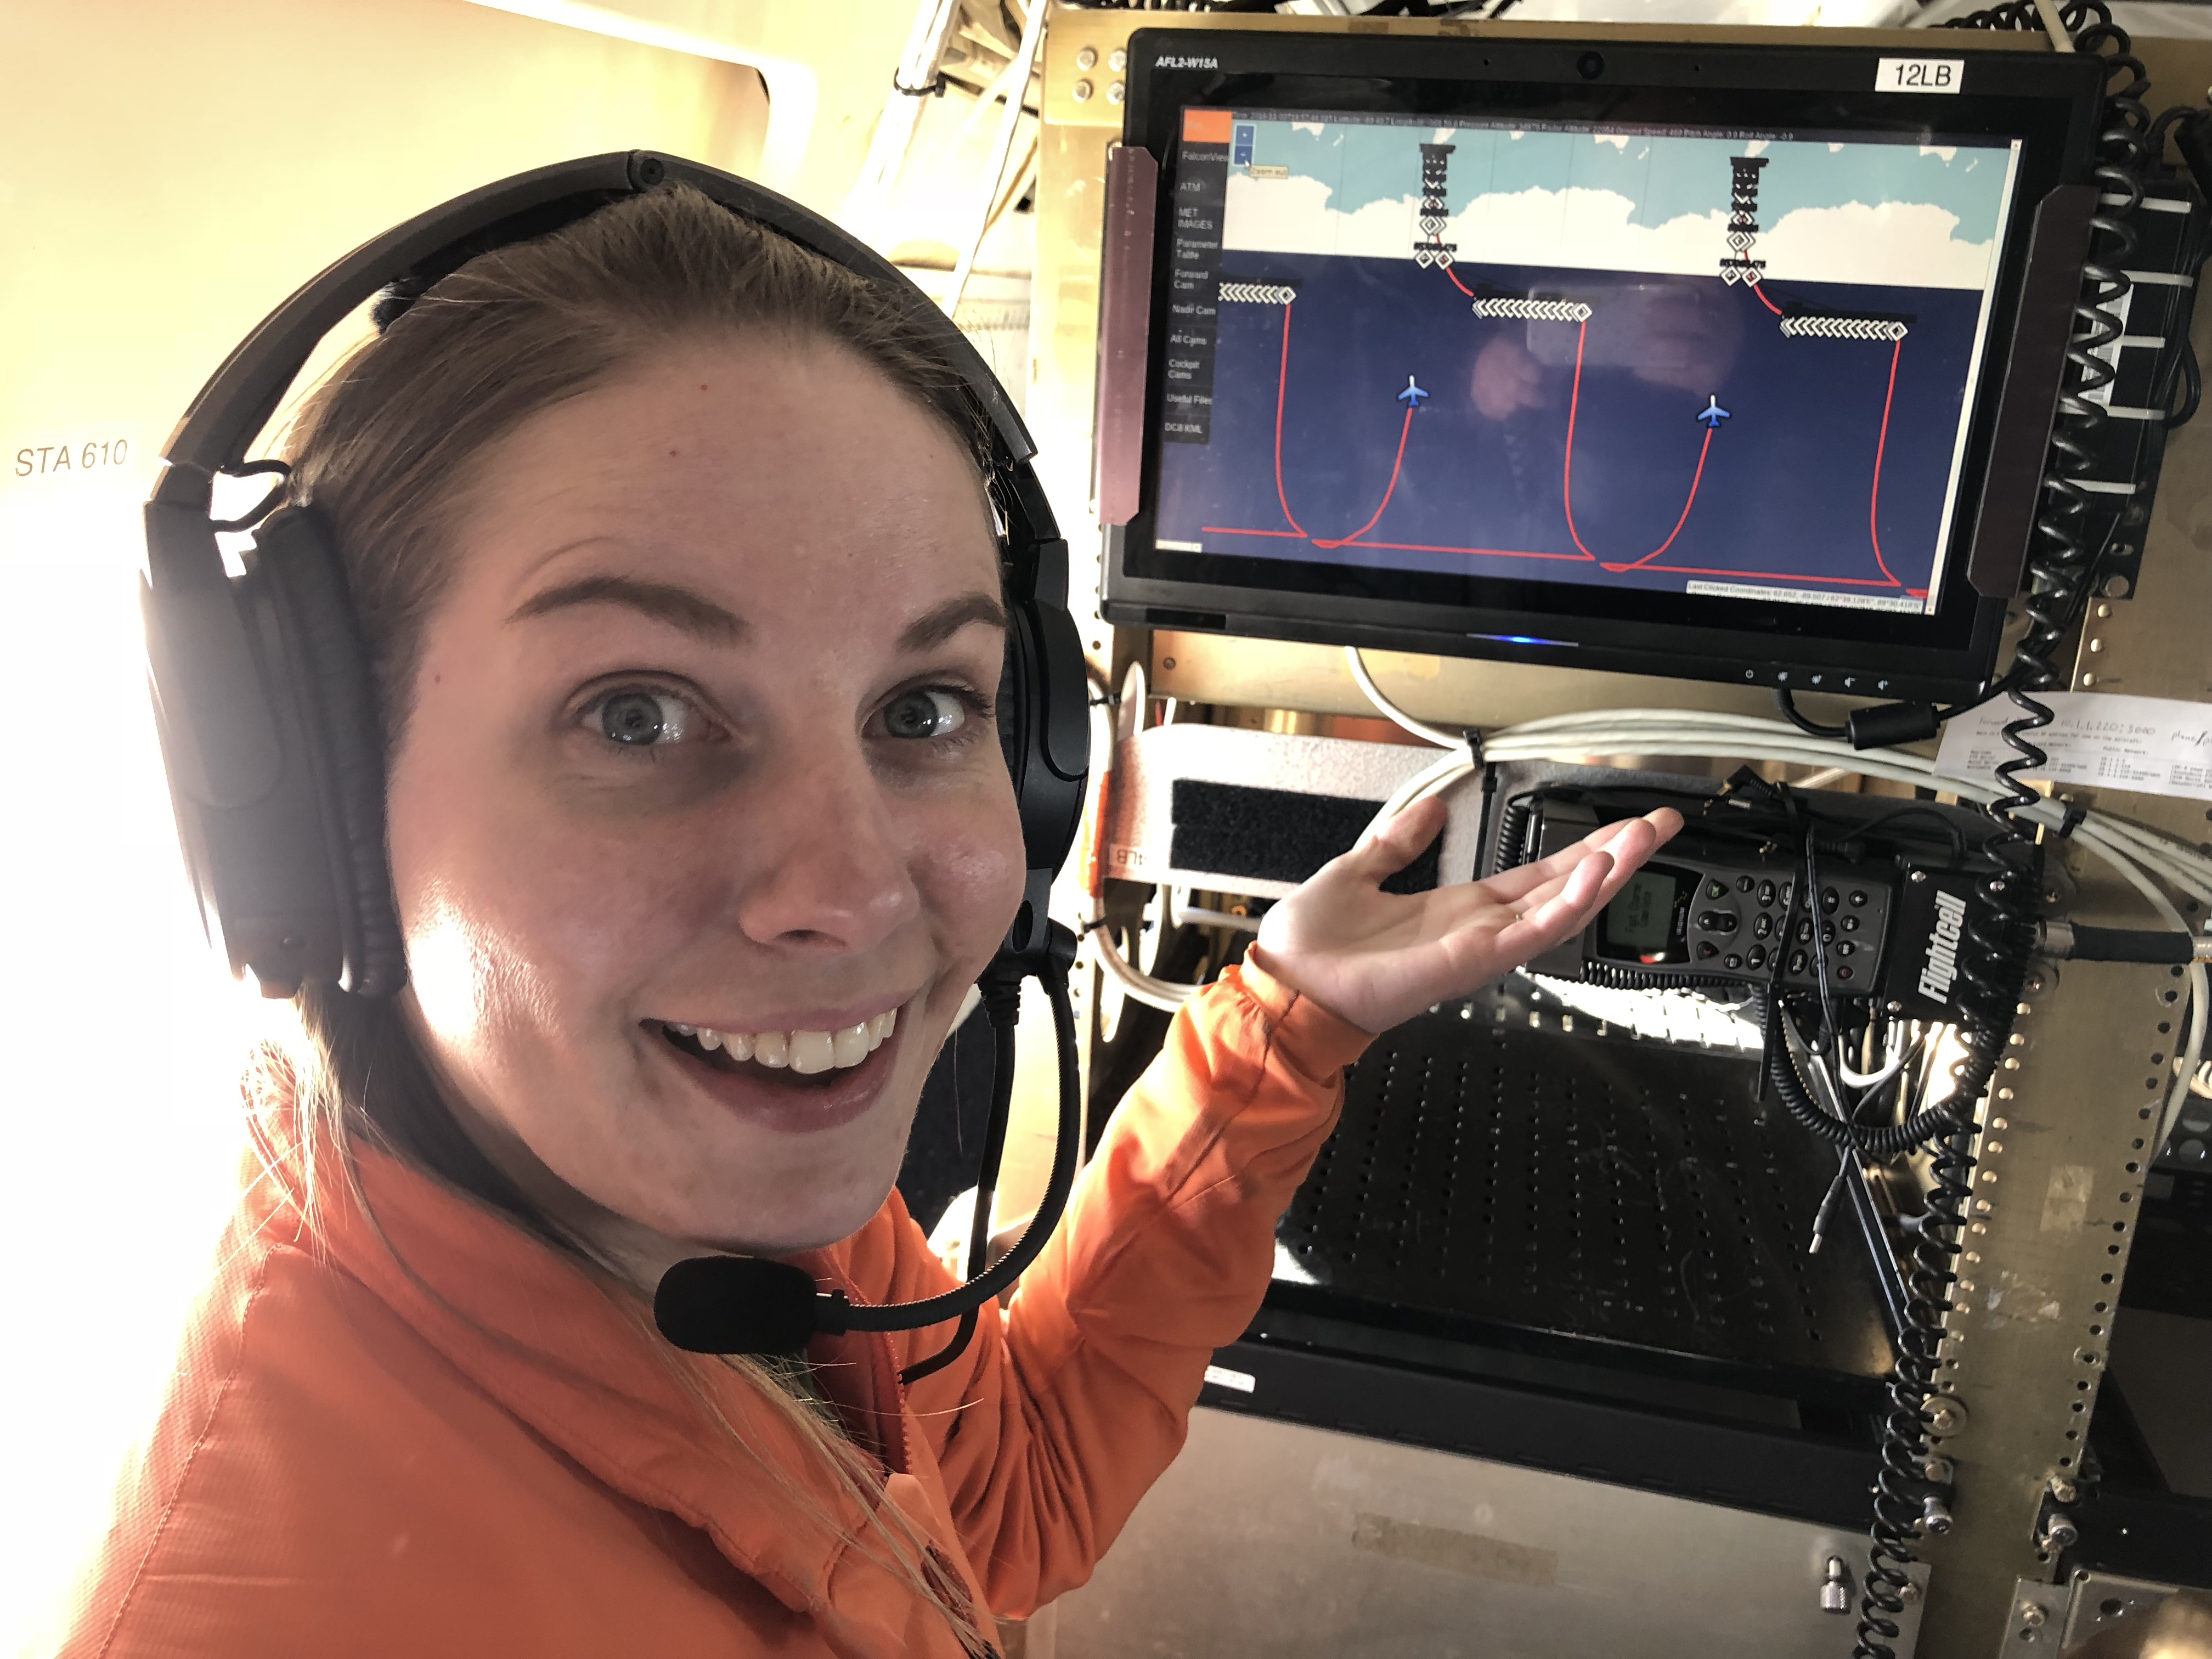
Lynette Boisvert, Operation IceBridge’s deputy project scientist, is “chasing the sea ice” during the science mission. Credits: NASA/Hara Talasila
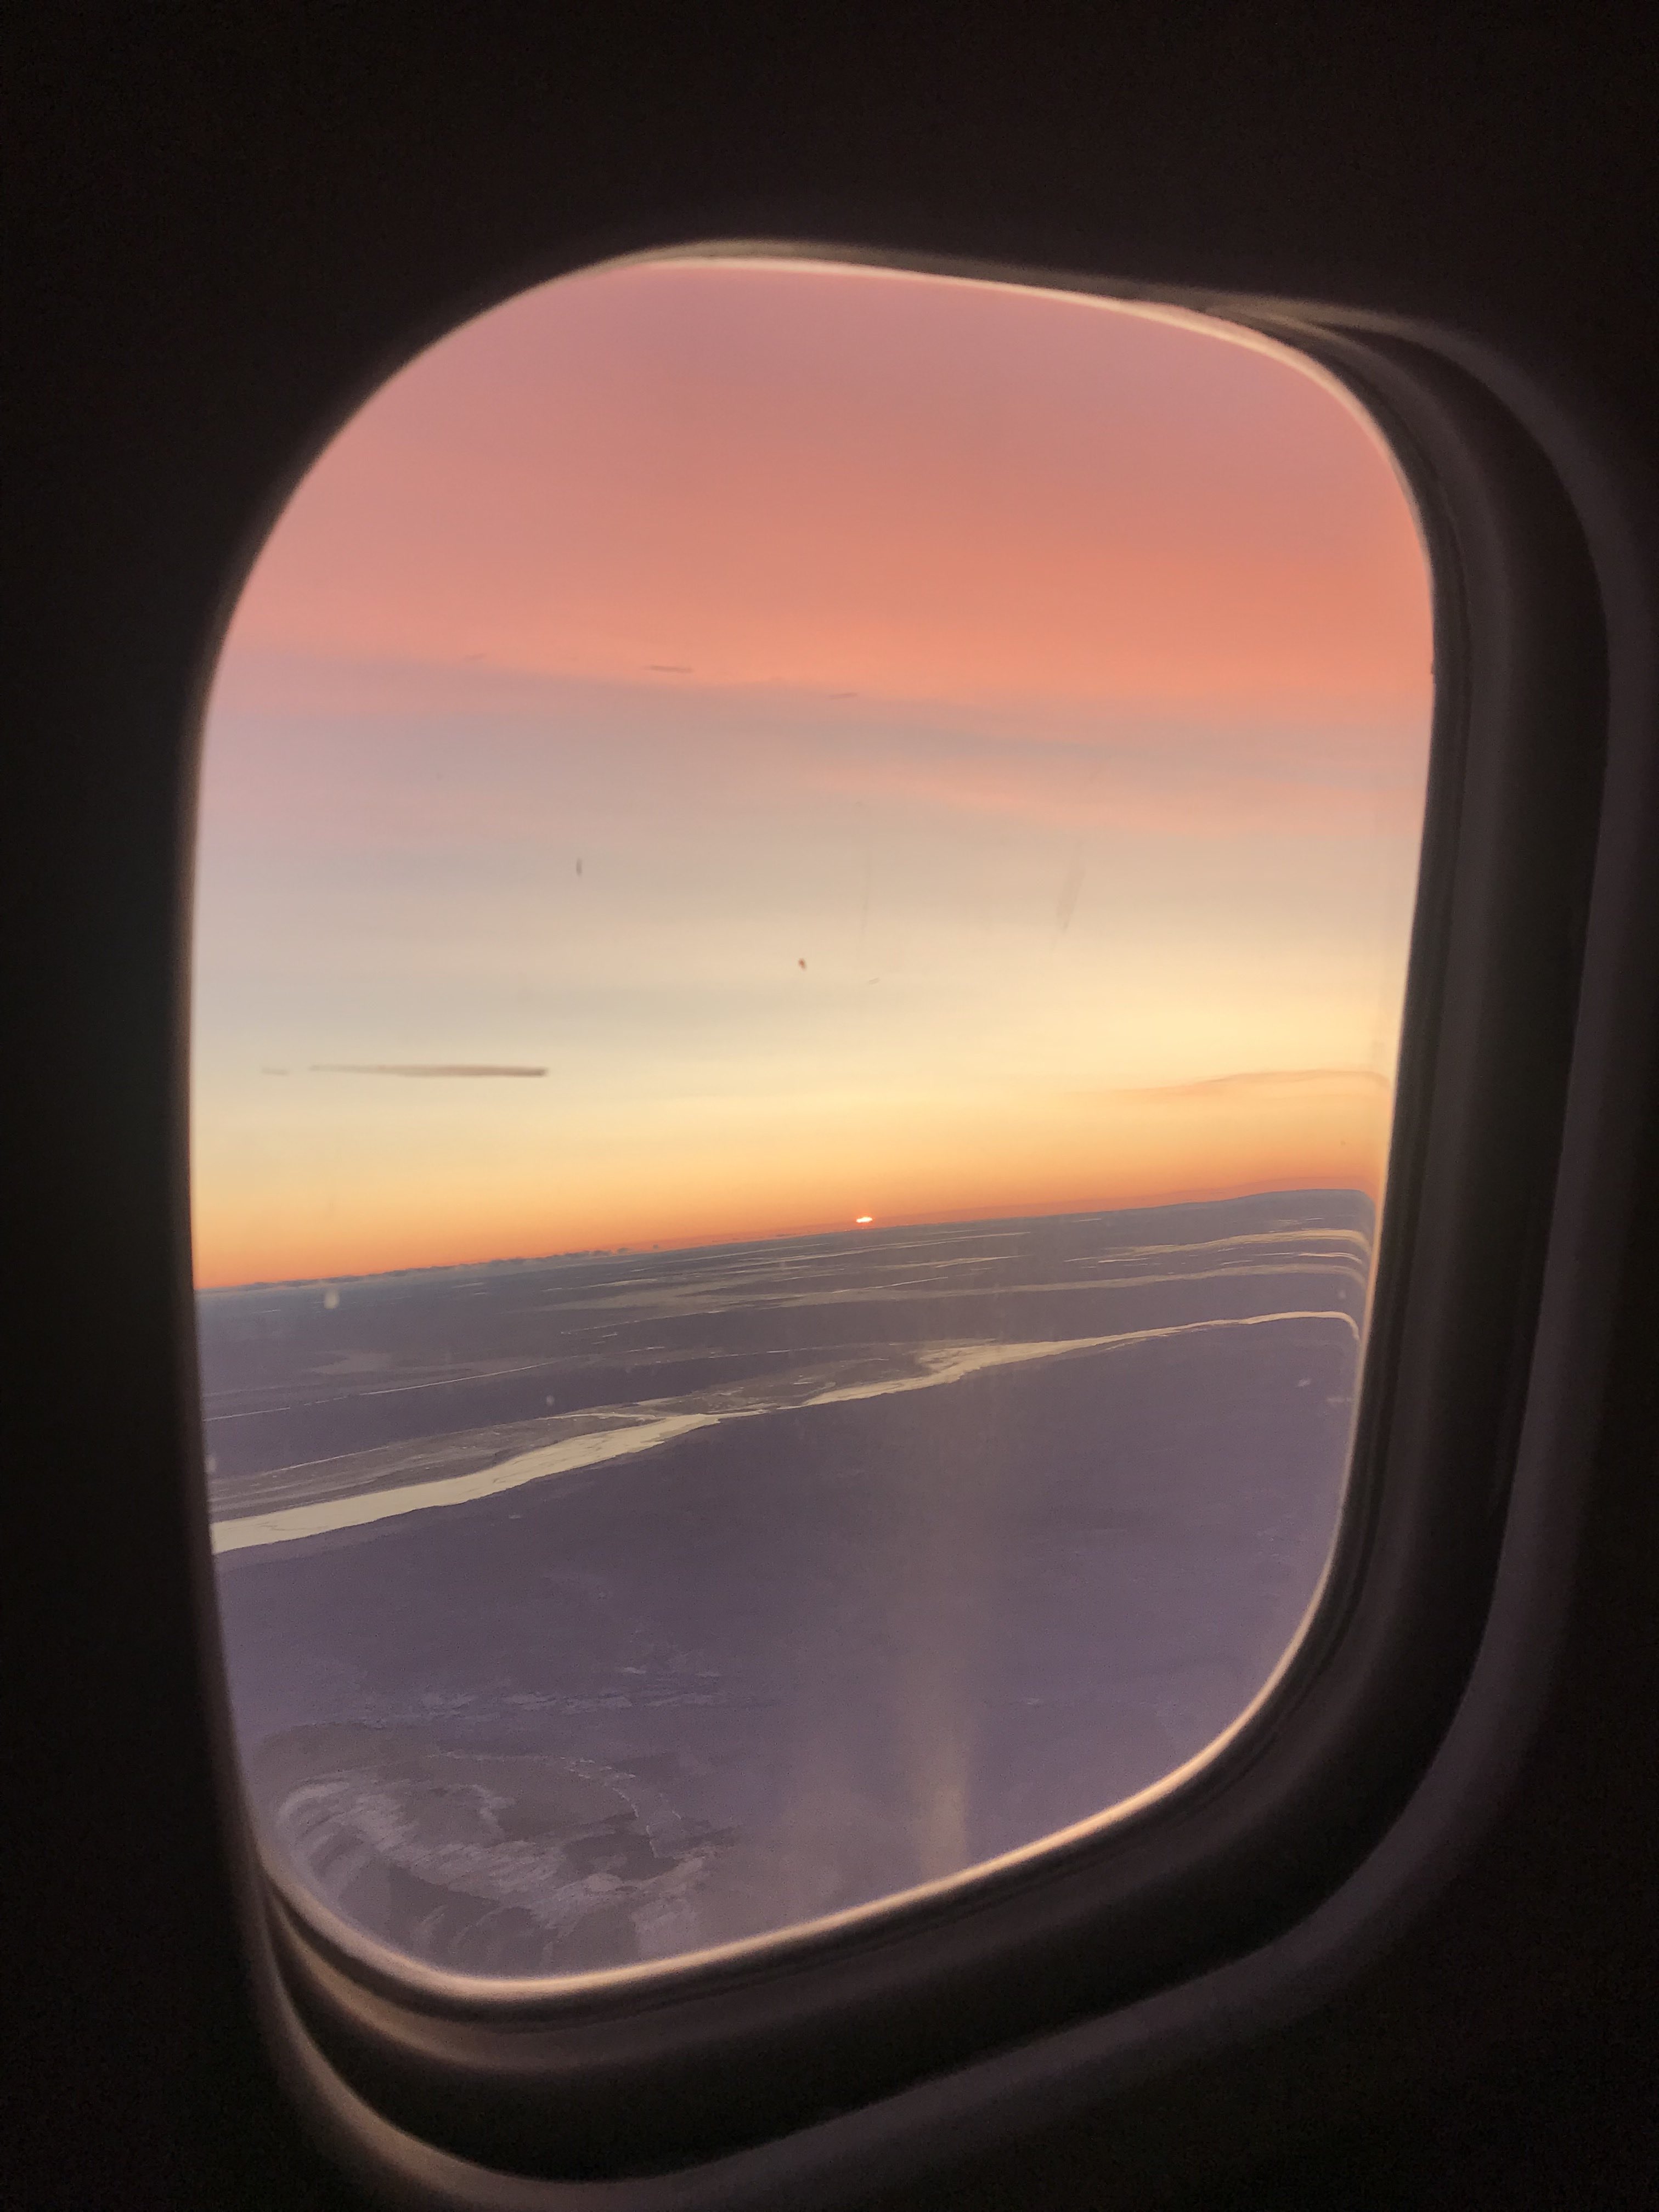
During our flight and because of our flight path we were able to see multiple sunsets and sunrises as the sun bobbed up and down across the horizon.
Since our flight was a low-light flight it had to be conducted at night, so we took off from Punta Arenas at 7pm for an 11-hour flight, heading south to the Weddell Sea. During our flight and because of our flight path we were able to see multiple sunsets and sunrises as the sun bobbed up and down across the horizon. Because of the low lighting, the sky changed from oranges to pinks to blues, making for quite the show from the DC-8’s windows. Even the land ice lovers enjoyed it.
Sunrise over the Weddell Sea and sea ice below from the window of the DC-8 Credits: NASA/Linette Boisvert
Right before 1:35am local time, John Sonntag began a 10-second countdown, and when zero was reached, ICESat-2 crossed directly above our plane, thus “playing tag with the satellite” and making history, as it was the first time this was done since the satellite’s launch a little over a month ago. We all began chatting on our headsets about how awesome it was to be part of this mission and to be able to witness this moment. This is what OIB had been working toward since its beginning in 2009. The data gap was now successfully bridged between ICESat and ICESat-2.
An ICESat-2 flyover as seen from Punta Arenas, Chile, in the middle of the night. Credits: NASA/Jeremy Harbeck
Later, during the flight, I began to think about how everyone on the team really stepped up and how easily we were all able to work together to make this mission happen. I mean, we literally chased sea ice and played tag with a satellite during this flight! It took the pilots’ maneuvering, the aircraft crew’s hard work, the instrument teams’ and scientists’ steady collecting of data—everyone working together all night long—for this mission to run smoothly. I am truly grateful for everyone’s hard work and dedication and was so happy to be there that night. As we on OIB say, “Team work makes the dream work.”
IceBridge Deputy Project Scientist Linette Boisvert is interviewed, explaining how the crew chases sea ice in flight. Credits: NASA/Hara Talasila)
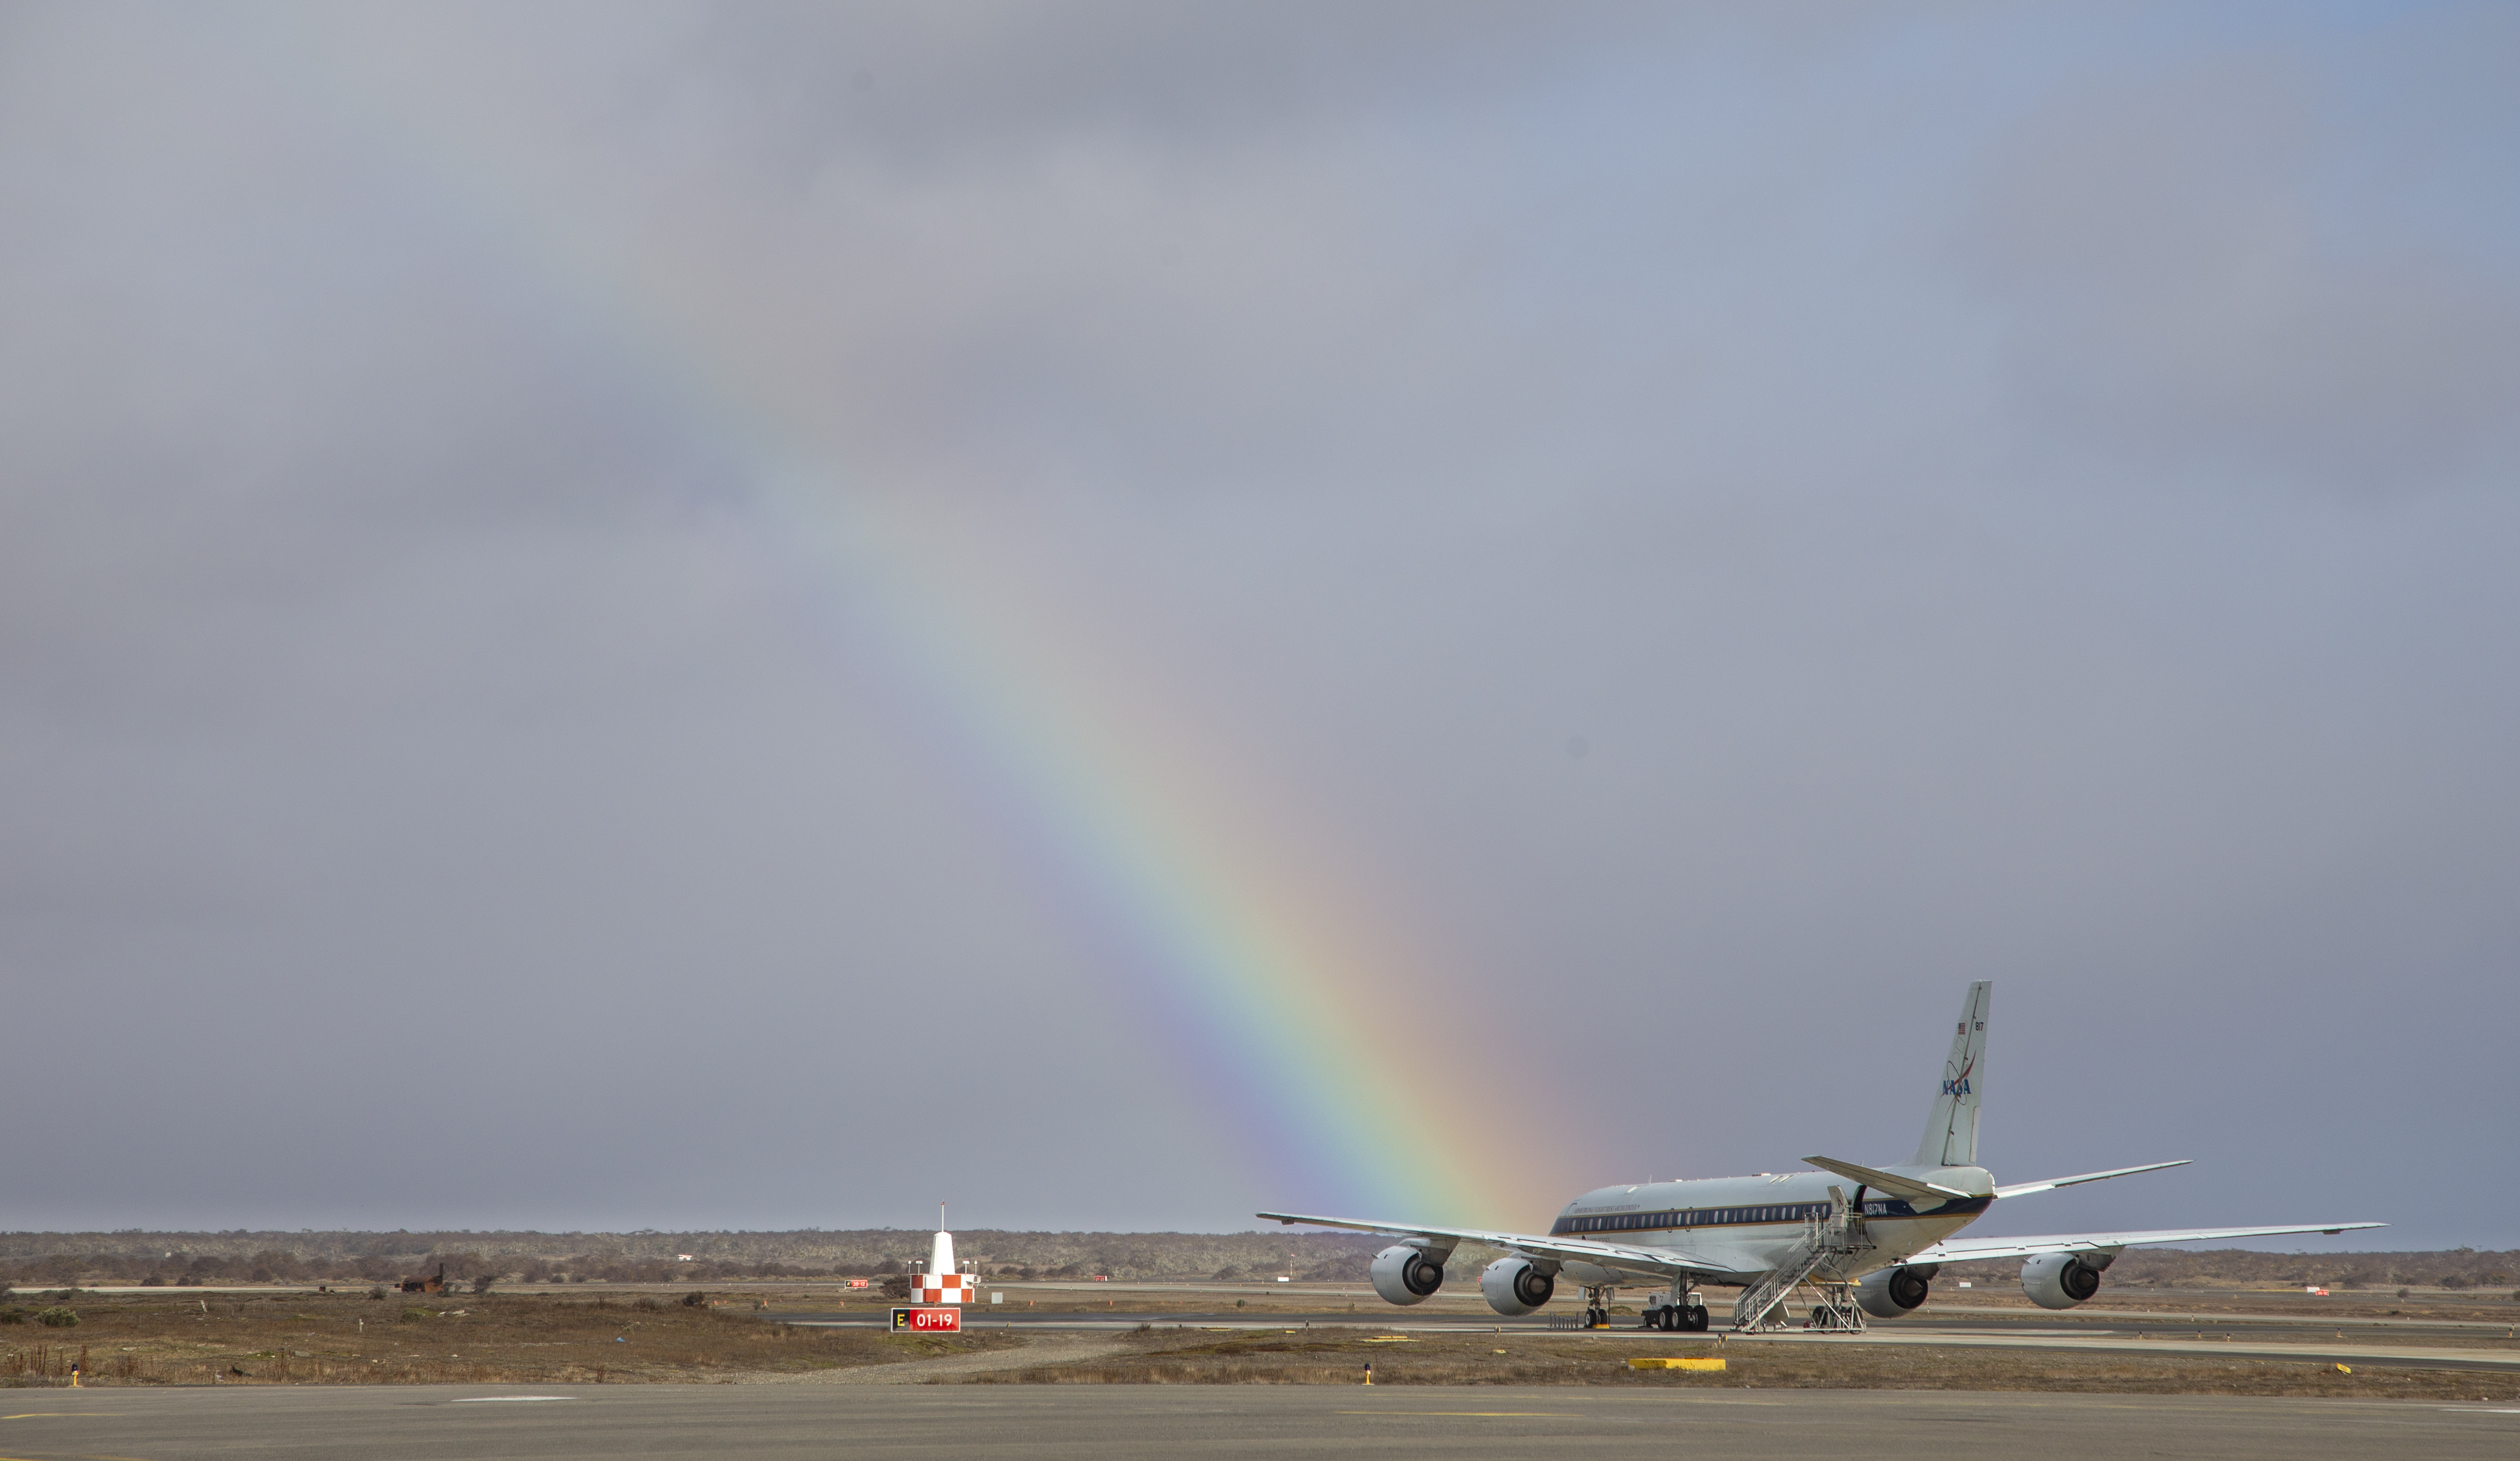
A rainbow appears in the backdrop of NASA’s DC-8 at the Punta Arenas Airport in Chile before takeoff. Credits: NASA/Jeremy Harbeck
by Linette Boisvert / SKIES ABOVE ANTARCTICA /
NASA’s Operation IceBridge (OIB) fall campaign in the Antarctic has been a much different experience for me compared to past campaigns. This is in part because of my new role and responsibilities as deputy project scientist for OIB, but also because I am currently in the southern hemisphere for the first time and seeing Antarctic sea ice and land ice for the first time in person! If that wasn’t enough new stuff, I am now spending 12 hours a day flying over Antarctica, almost nearing the South Pole. (That is the topic of a future blog…so stay tuned!)
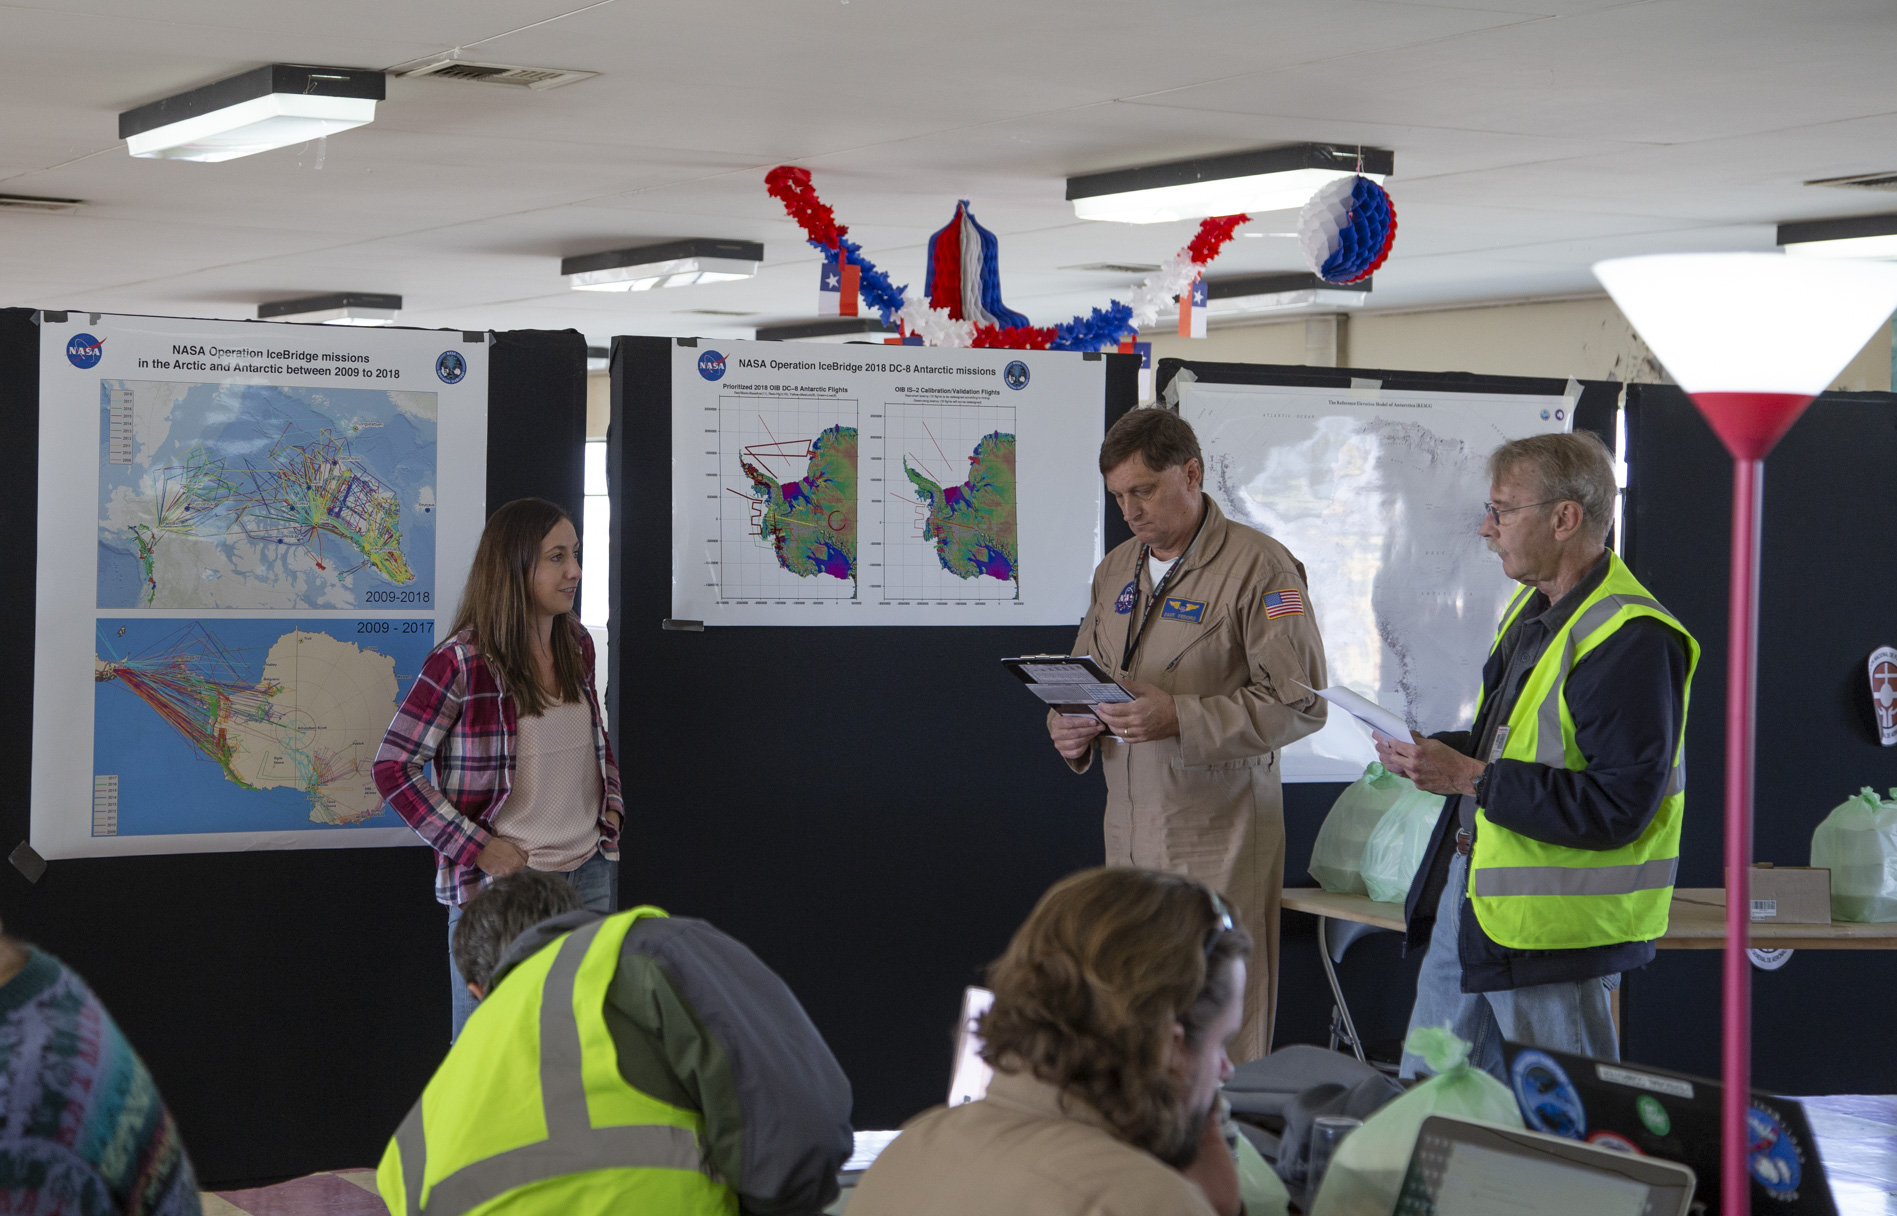
Lynette Boisvert (left) doing an OIB pre-mission briefing on the science objectives with the pilots and instrument team members. Credits: NASA/Jeremy Harbeck
These flights are long (I mean really long) and the days are also long. We have to get to the airport two hours before the flight, and it takes about 25 minutes to get to the airport in Punta Arenas, Chile. Once there, John Sonntag, Eugenia DeMarco, and I go over the satellite imagery available to us as well as some weather forecast models of Antarctica so we can decide which missions are the most viable for maximum data collection during flight.
This is nerve-wracking in two ways: 1) We have limited satellite imagery so the model forecasts don’t always get the weather correct. This is because there are relatively few observations for the models to ingest in Antarctica and the Southern Ocean to include in their forecasts. Basically, the more observations available the better the chance that the models will get the weather forecasts correct. 2) If we make the wrong call and pick a mission where the weather turns out to be different from the forecasts and we are unable to collect good data, we are wasting the project’s valuable flight hour time and money. Let’s just say flying a big plane like the DC-8 is not cheap. So that’s a lot of pressure.
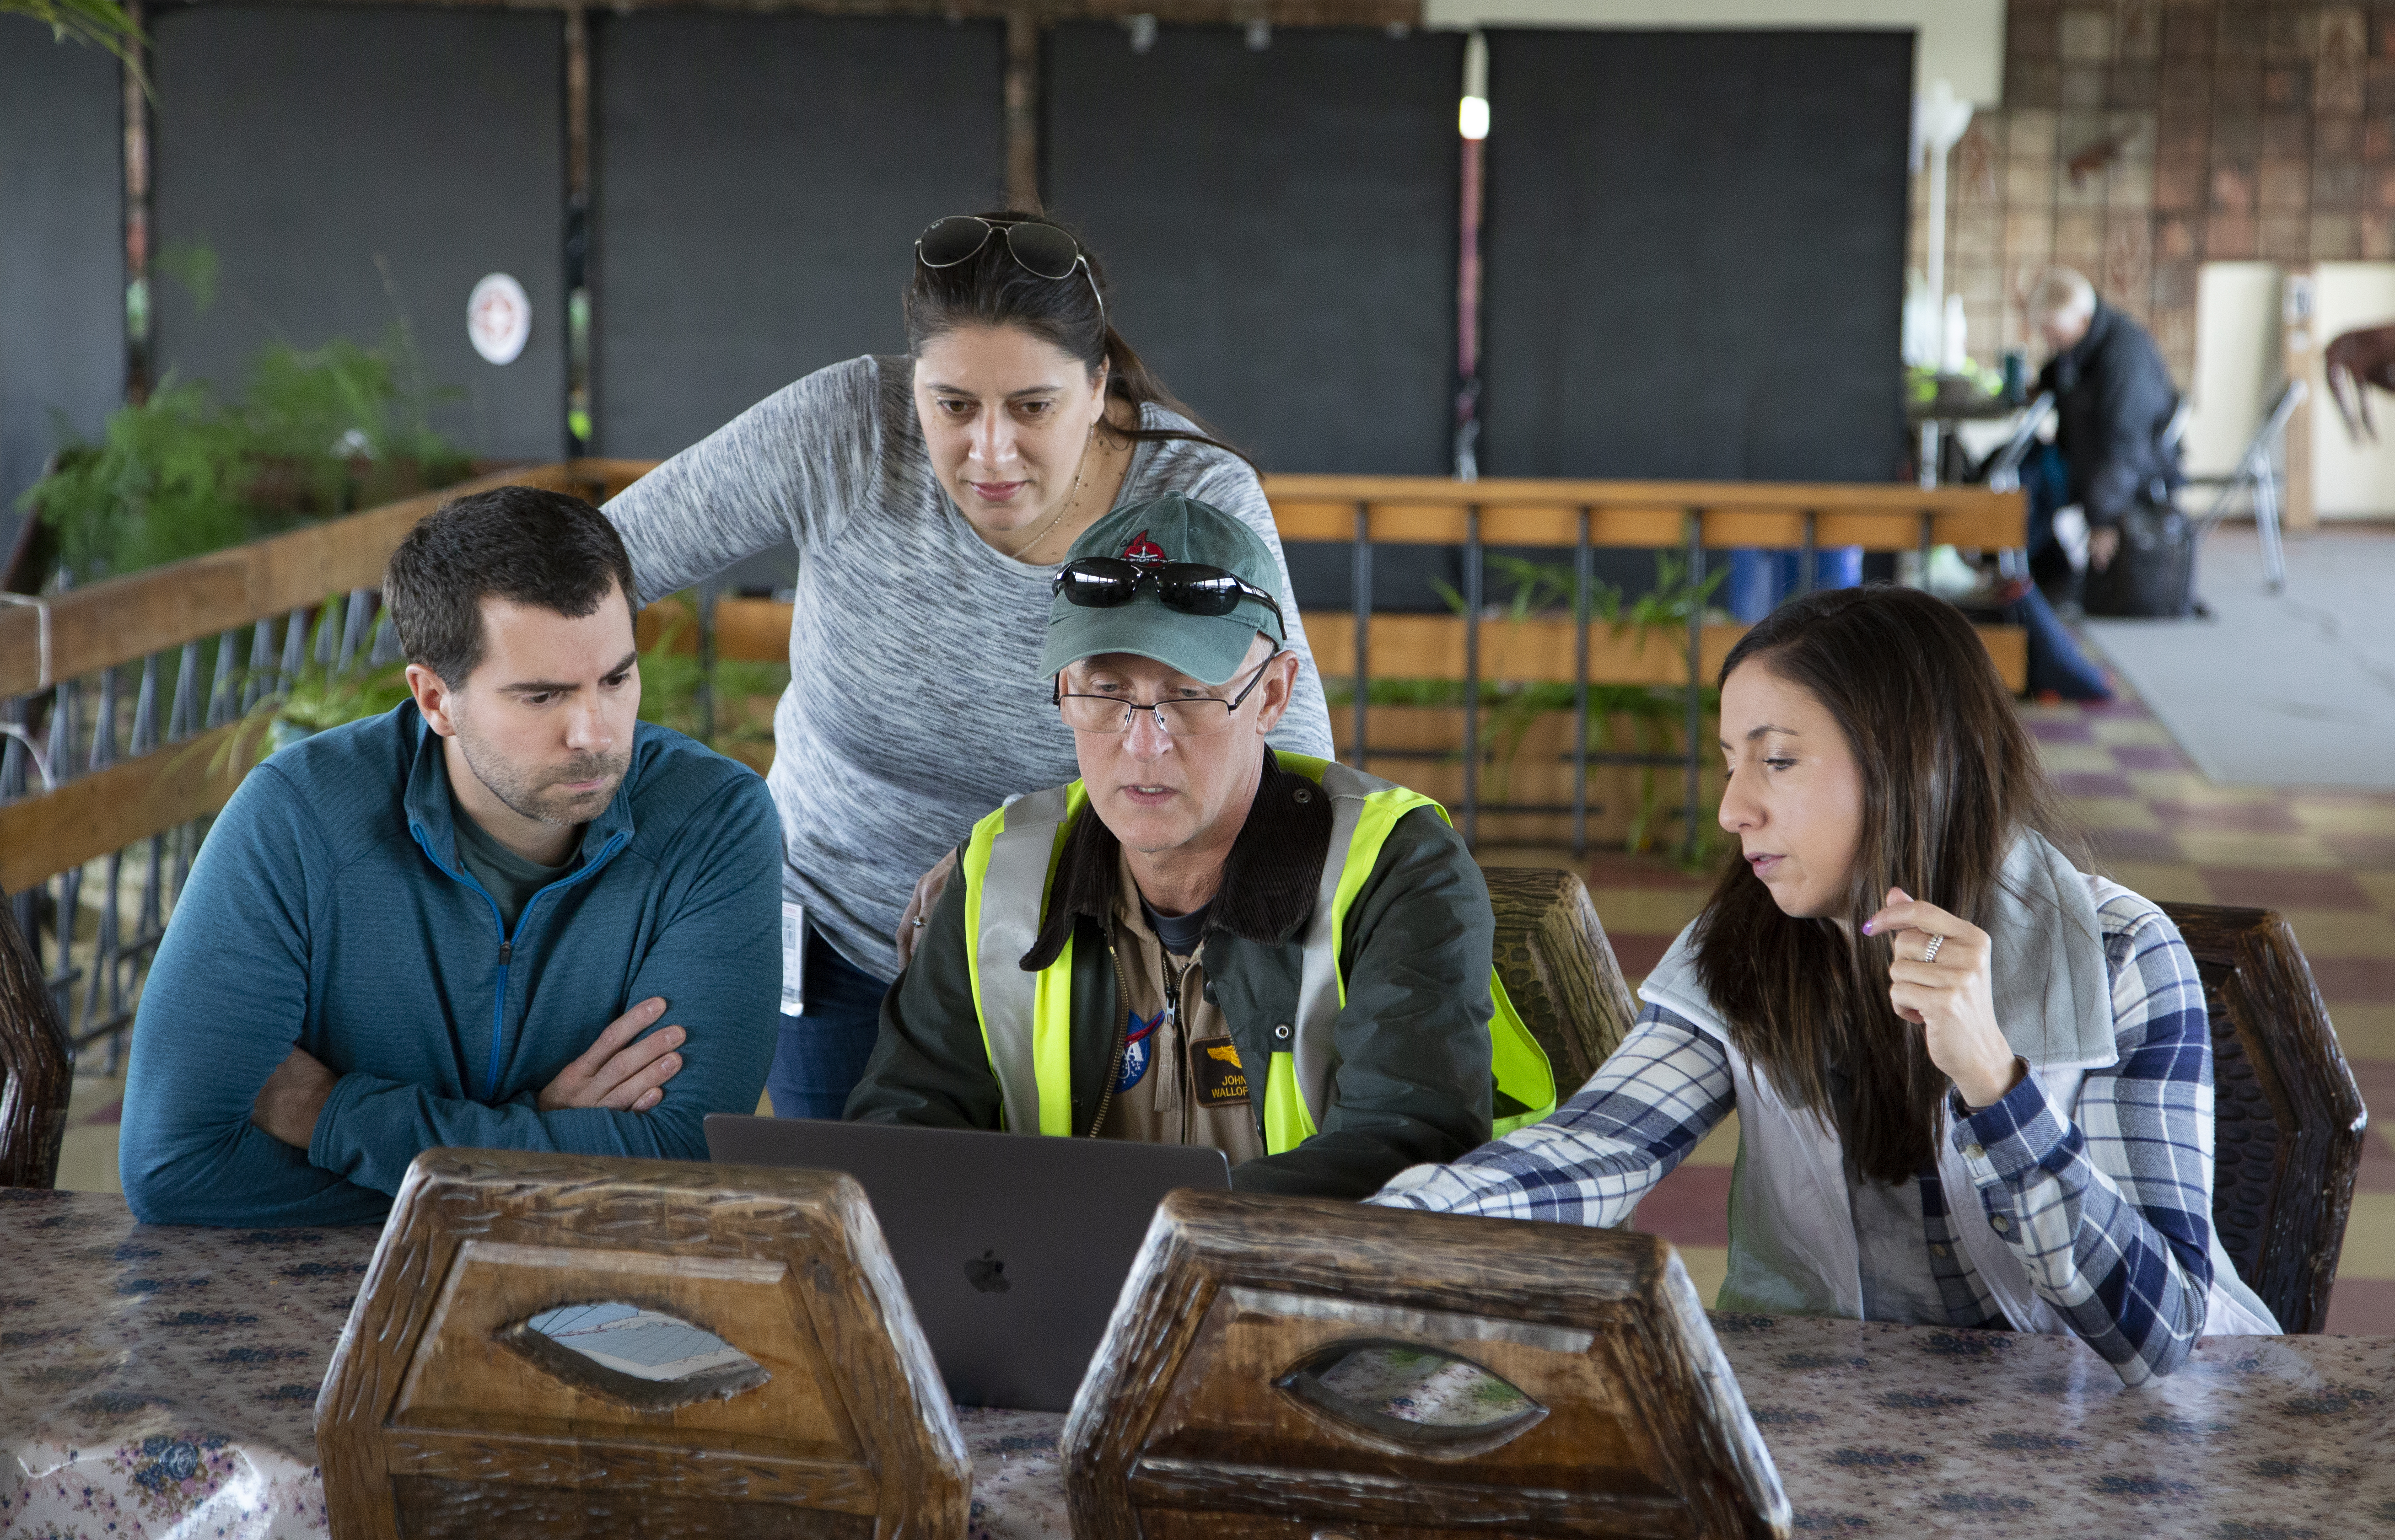
Assessing the forecasts and deciding on a science mission first thing in the morning at Punta Arenas airport from right to left: Joe McGregor, Eugenia DeMarco, John Sonntag and Linette Boisvert. Credits: NASA/Jeremy Harbeck
The reason why our flights are much longer in the Antarctic compared to the Arctic is that the time it takes to get to Antarctica from where we are based, Punta Arenas, is two to hours hours long, meaning that’s how long it takes before we can begin our mission and collect data. About half of our flight time is high-altitude transit. One would think there would be a lot of down time; however, for me this is not the case. I am very big on outreach and giving back by sharing with students of all ages what I do in my job, how I got interested in science, and the science that I do. One of the great things about OIB and NASA airborne science in general is that we have the ability to connect and chat with students in classrooms all over the world during our flights.
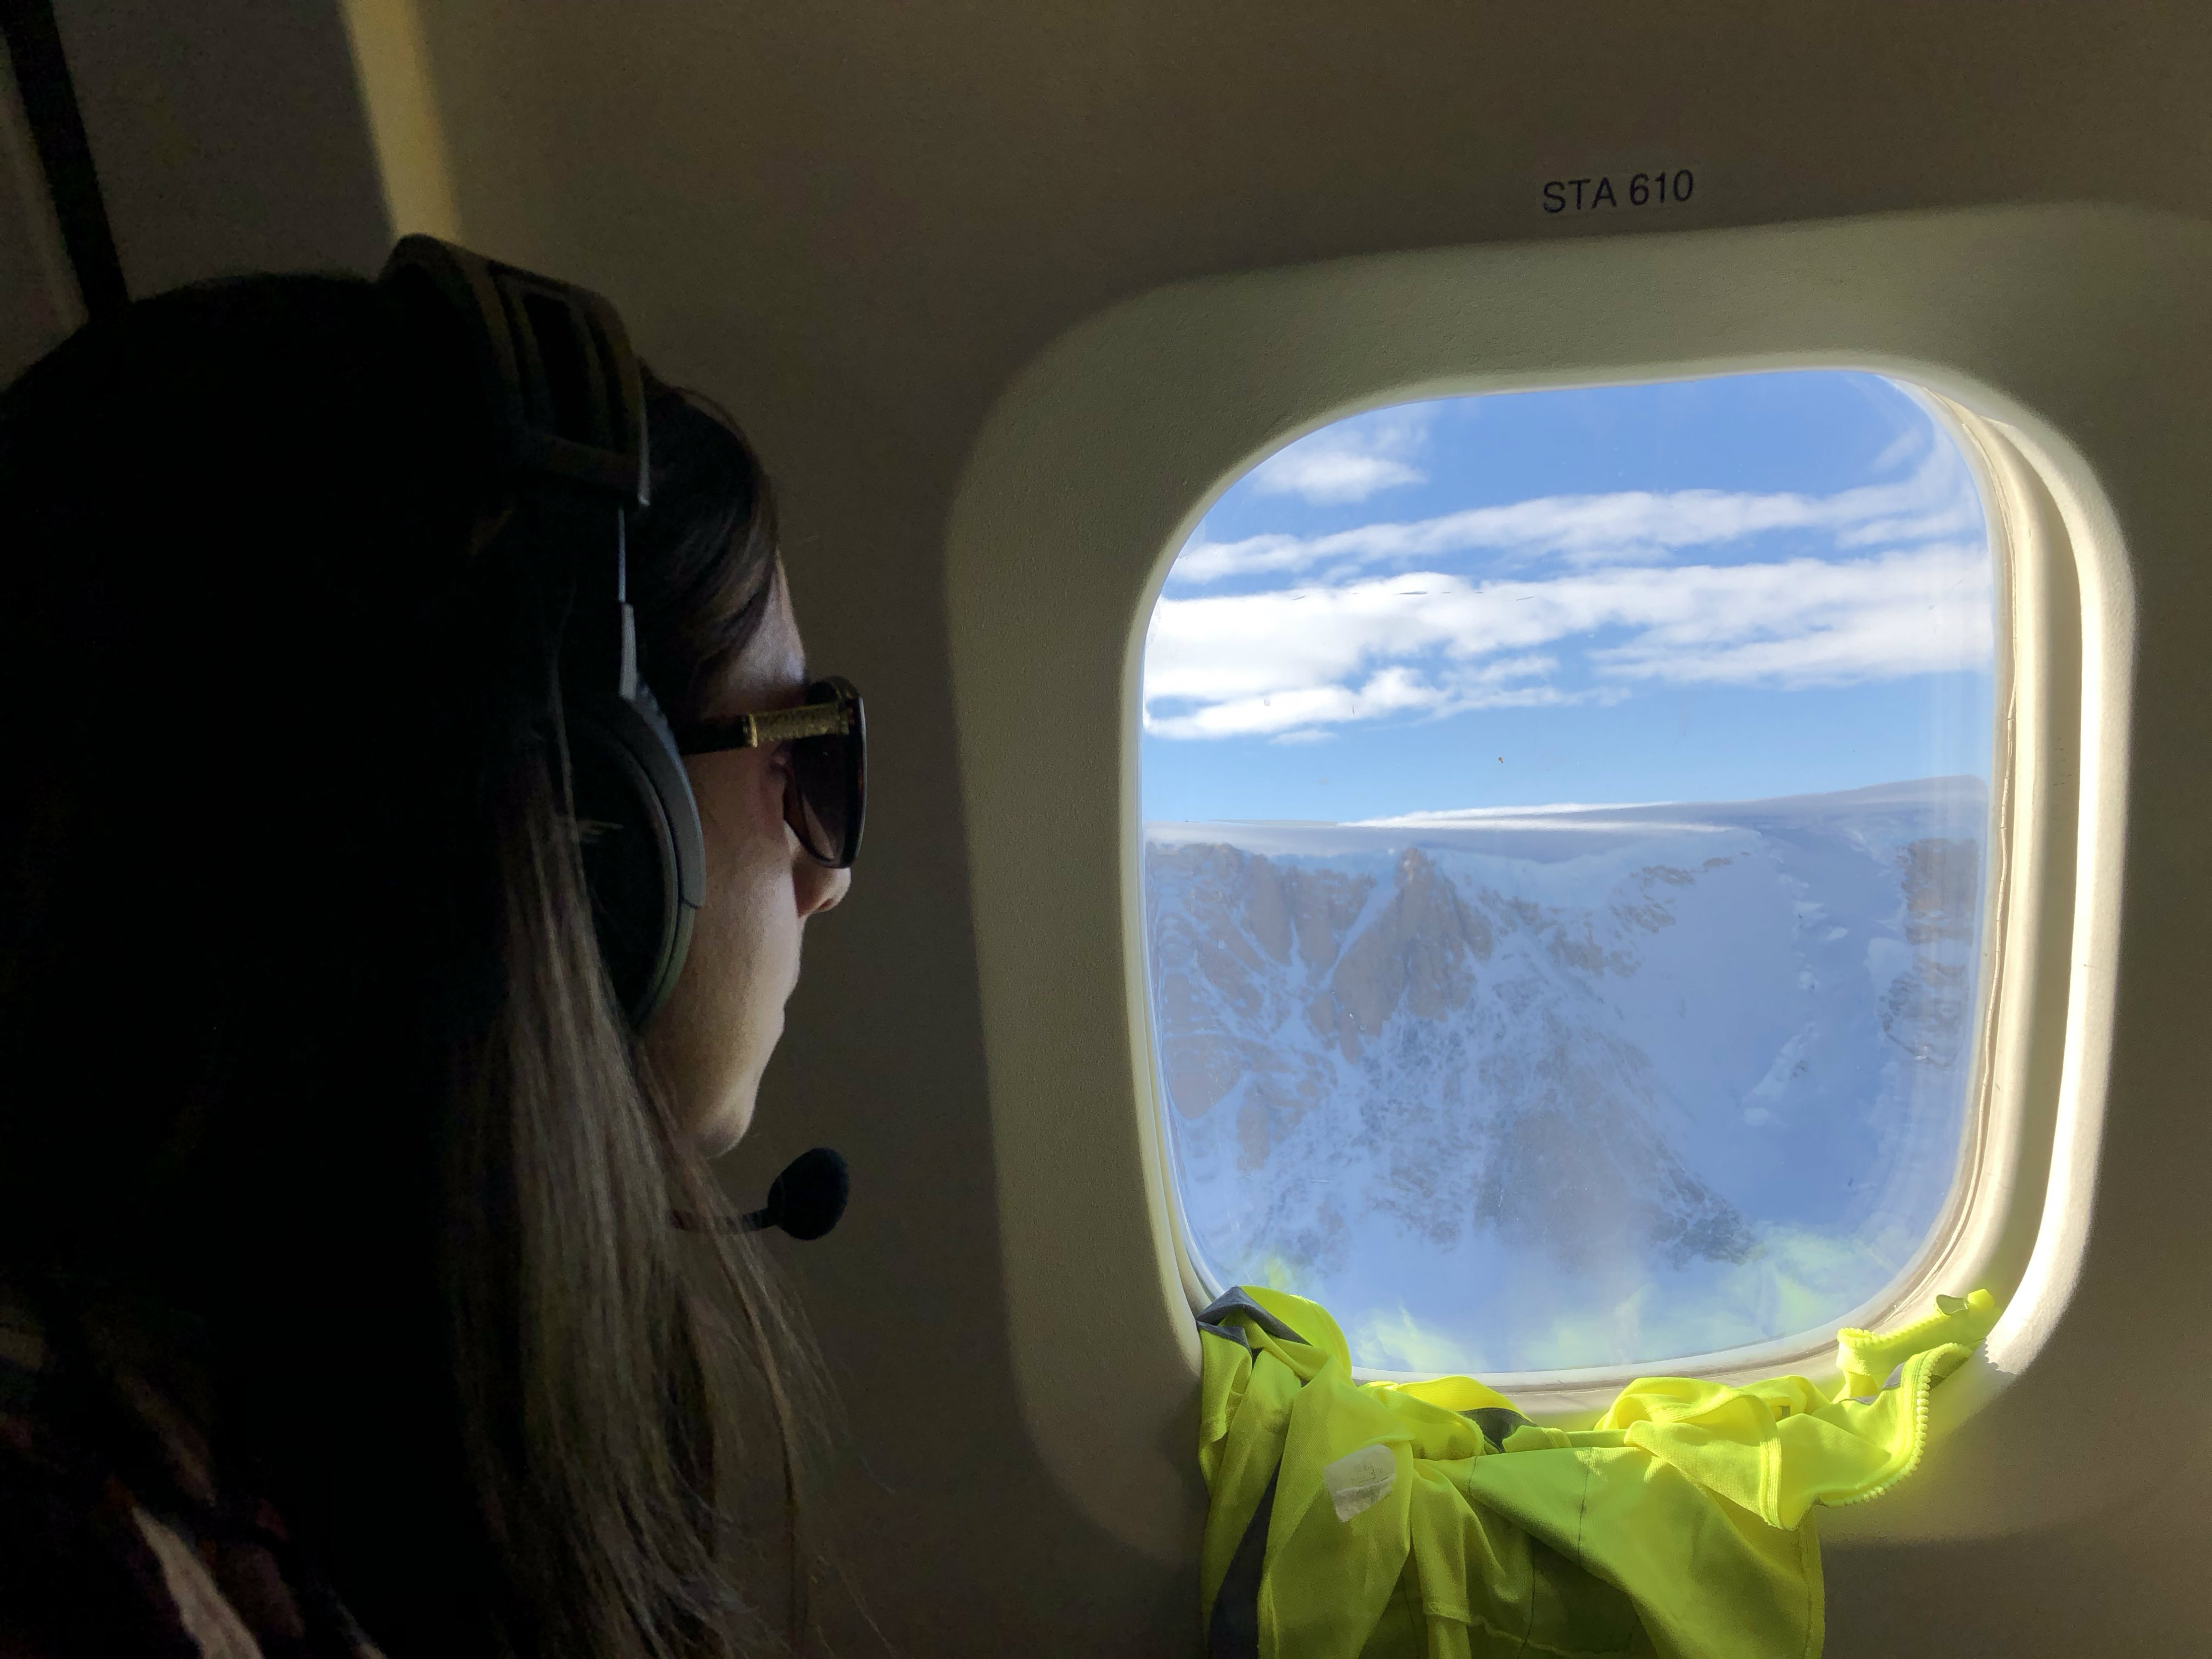
Linette Boisvert looking out of the DC-8 window at mountains of the North Antarctic Peninsula during an IceBridge science mission. Credits: Eugenia DeMarco
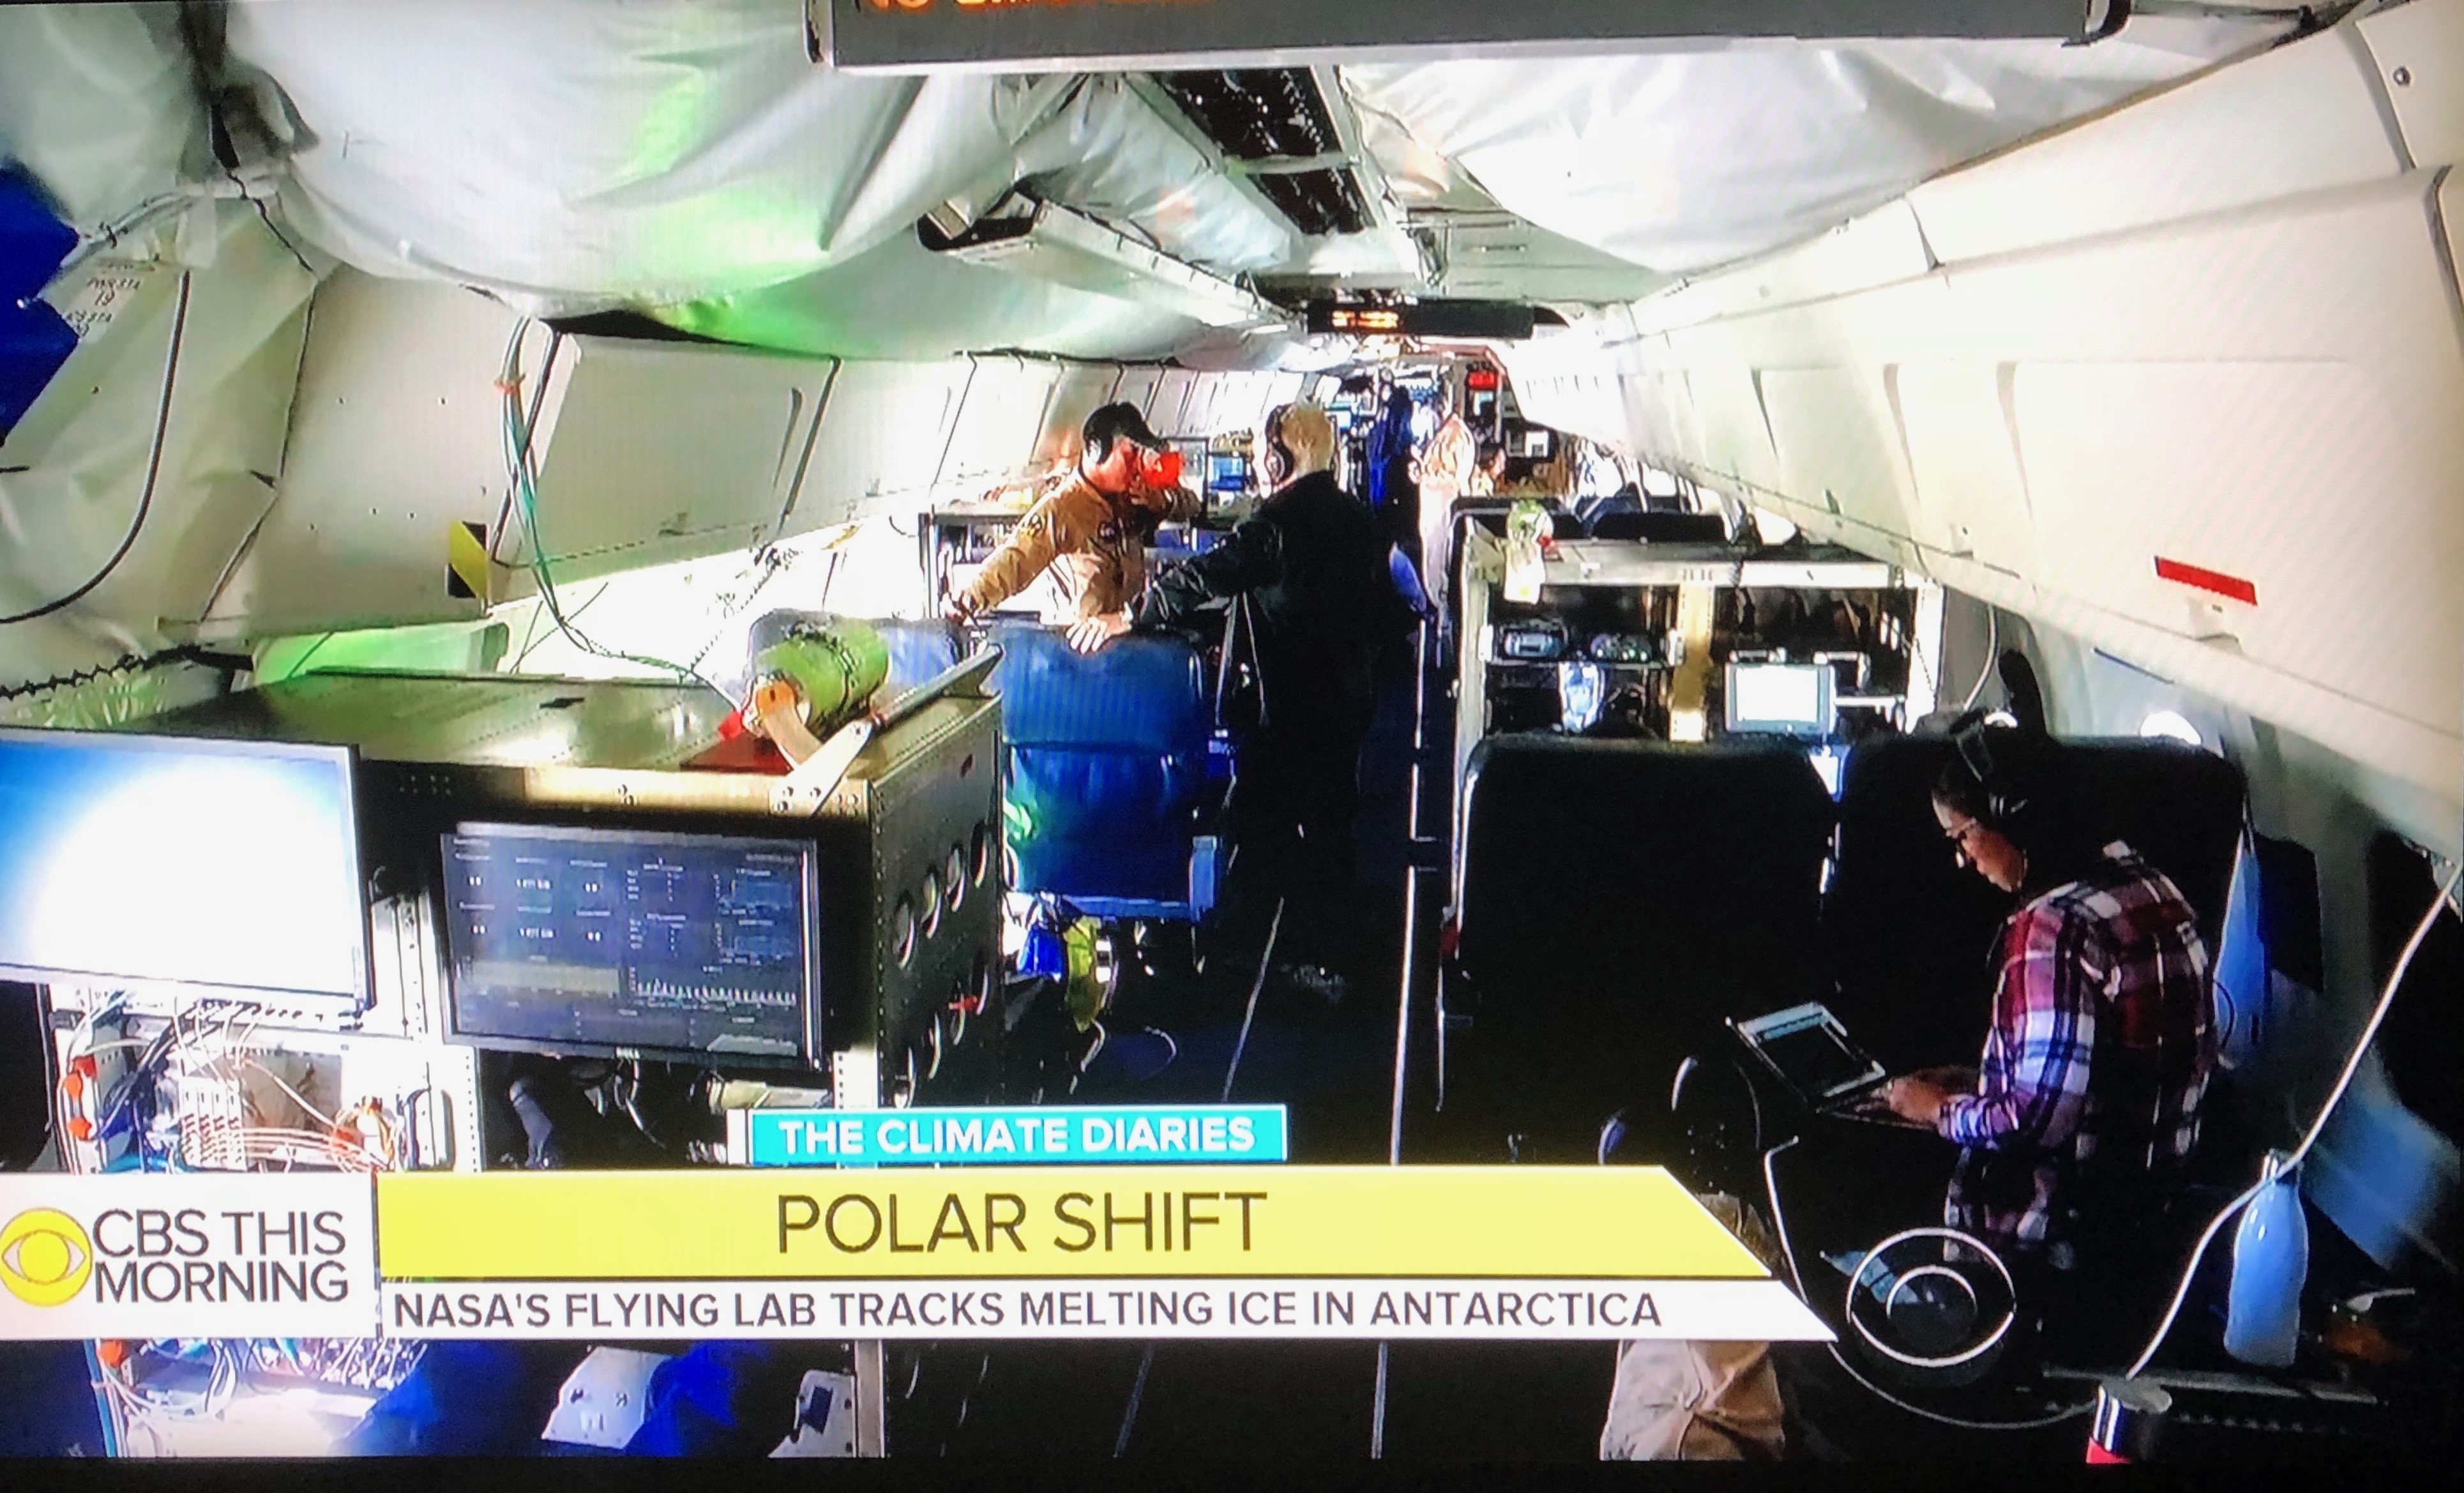
So this is how I choose to spend my down time on science flights. Teachers can connect their classrooms with us and ask all types of questions, from climate change to what OIB does, what we studied in school, and what we eat on the plane. I have been partaking in this for a few campaigns now, and the majority of the teachers come back campaign after campaign, connecting with us multiple times.
Linette Boisvert (foreground) taking part in a classroom chat during a science mission. This image was taken from a clip that was shown on CBS Evening News. Credits: NASA/Linette Boisvert
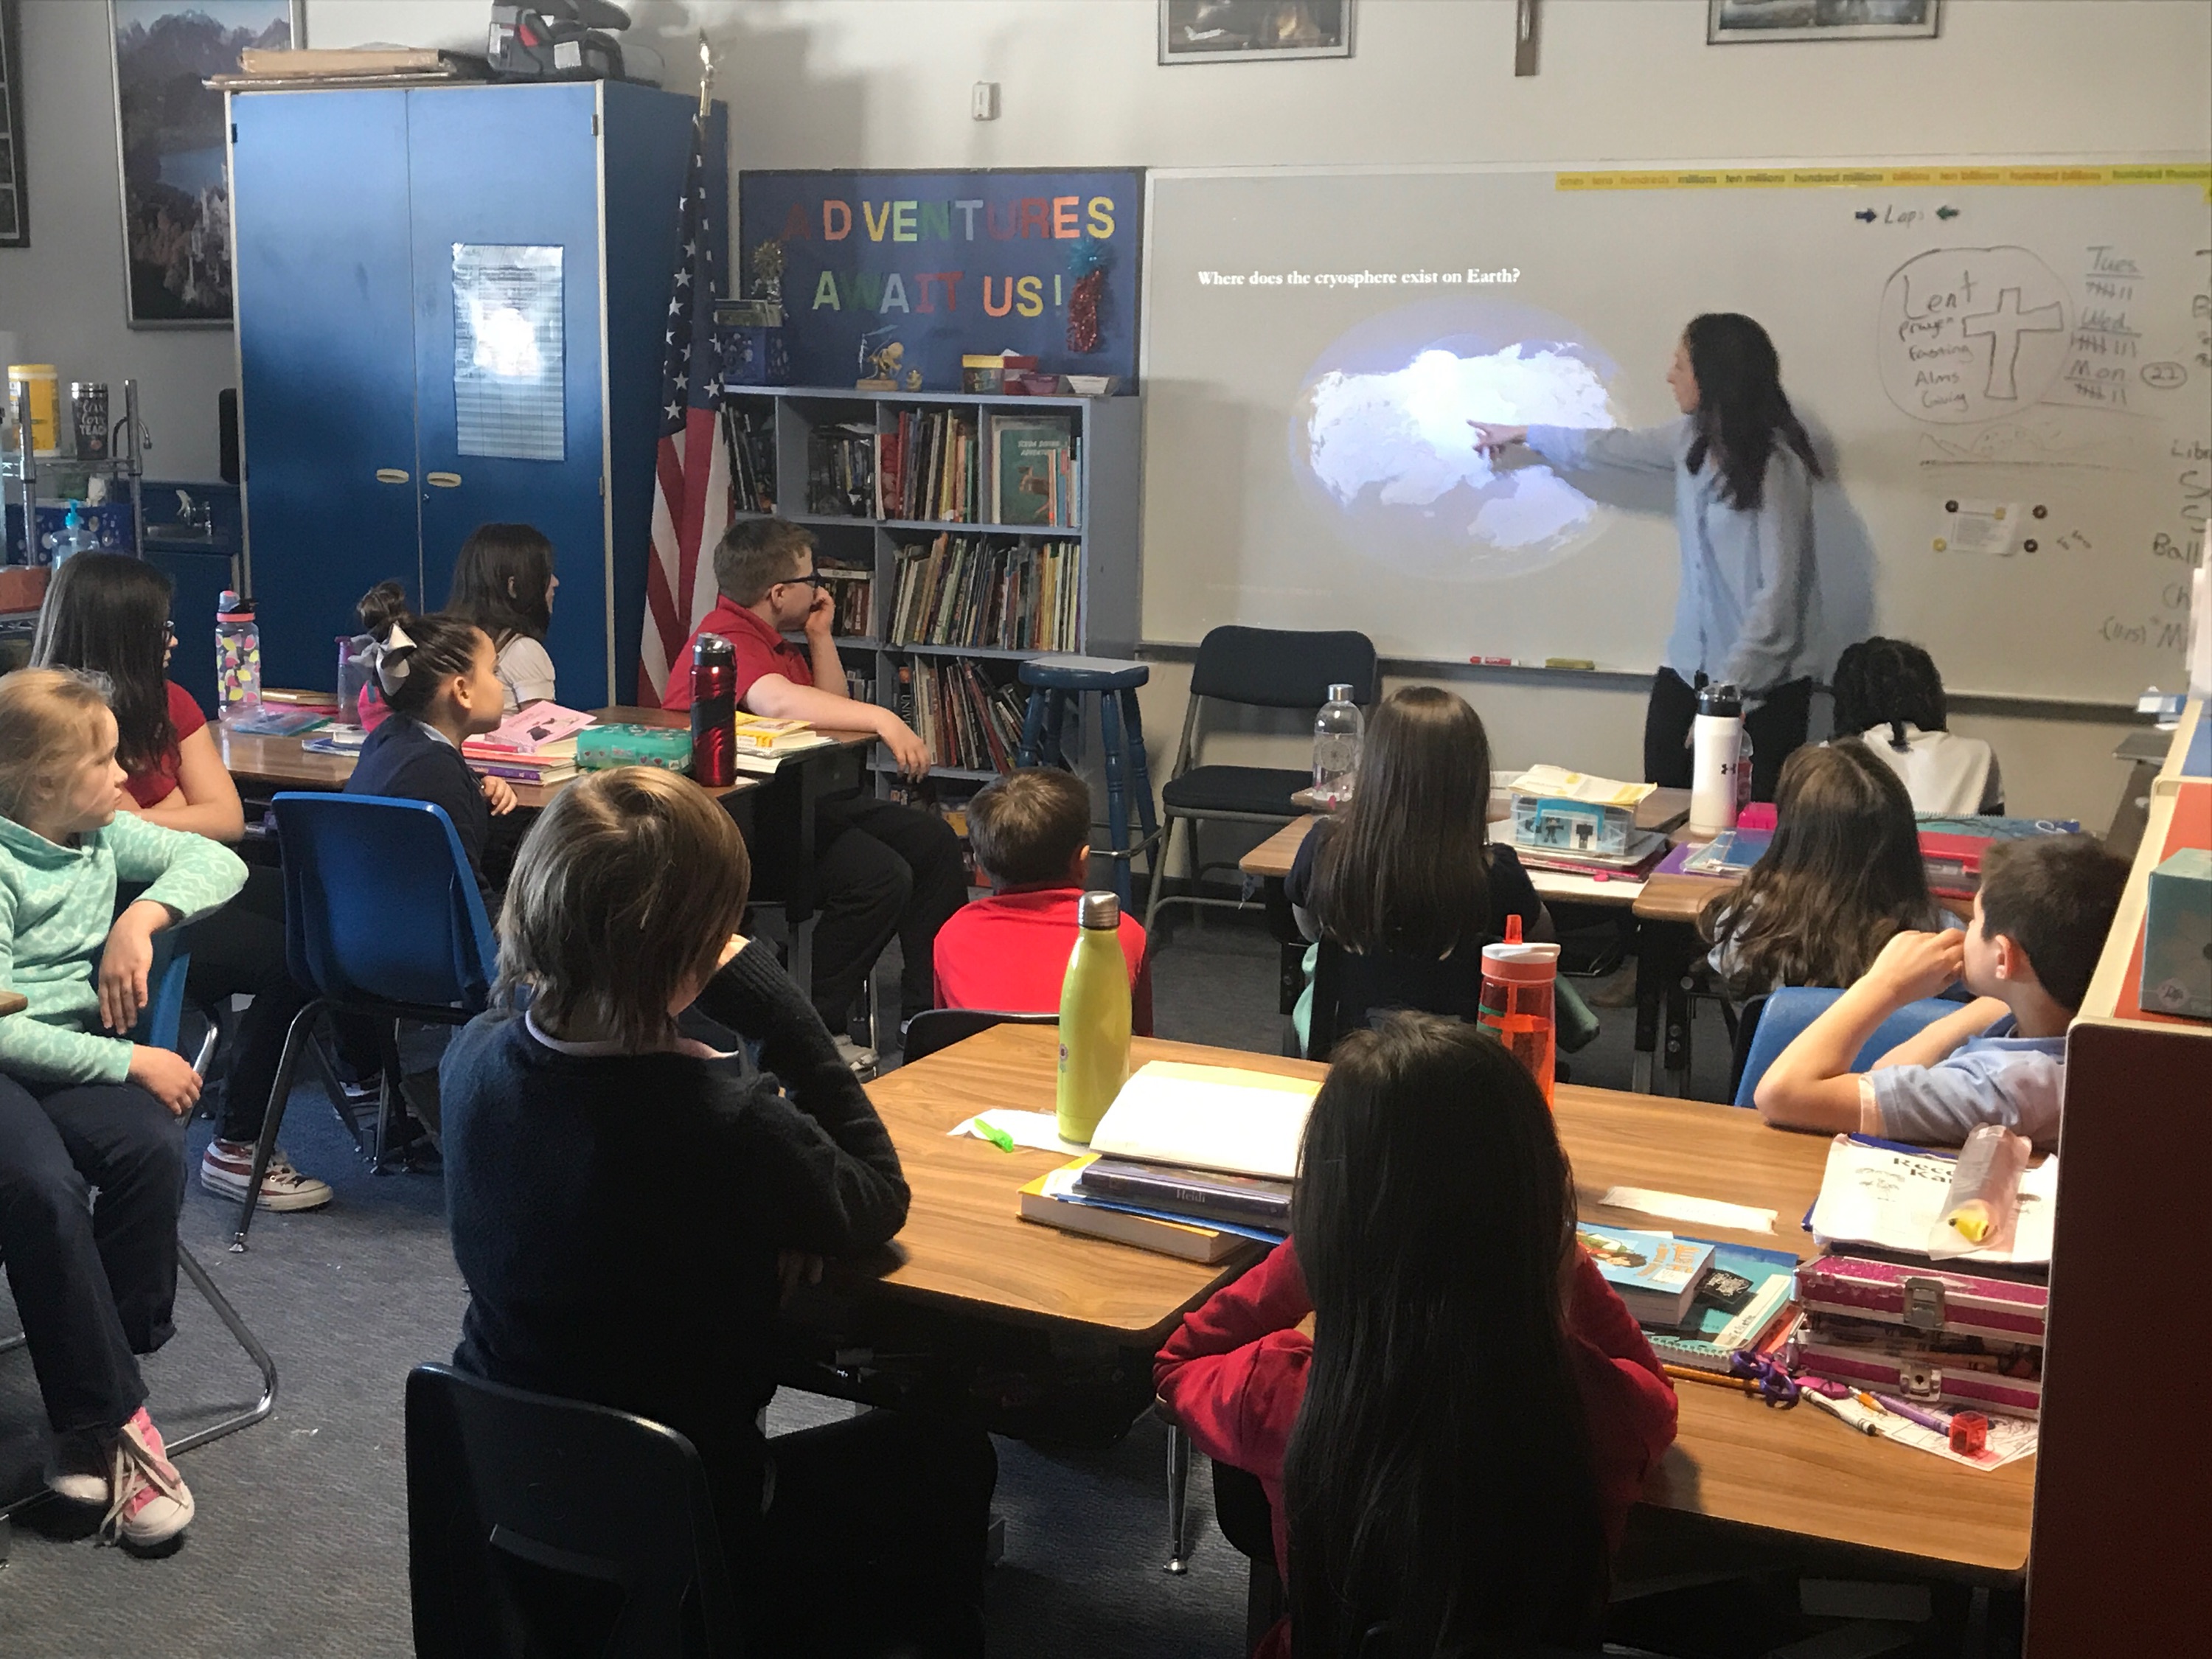
One of these teachers is Marci Ward, who teaches third grade in Fairbanks, Alaska, and is fascinated with airborne science and is dedicated and enthusiastic about exposing her students to all types of science. Last spring, when we were stationed in Fairbanks for our Beaufort sea ice flights, I had the opportunity to go to her classroom and talk to her students in person about OIB on one of our down days. Shortly thereafter, I was able to connect with her students again on the plane chat the following week. They were so excited to meet me in person and to chat with me on the plane, it really made me feel good about what I was doing and that I was making a difference (aka giving me the warm and fuzzies inside).
Linette Boisvert talking to Marci Ward’s third grade class in Fairbanks, Alaska, about sea ice and IceBridge in March 2018 during the Arctic spring campaign. Credits: NASA/Emily Schaller
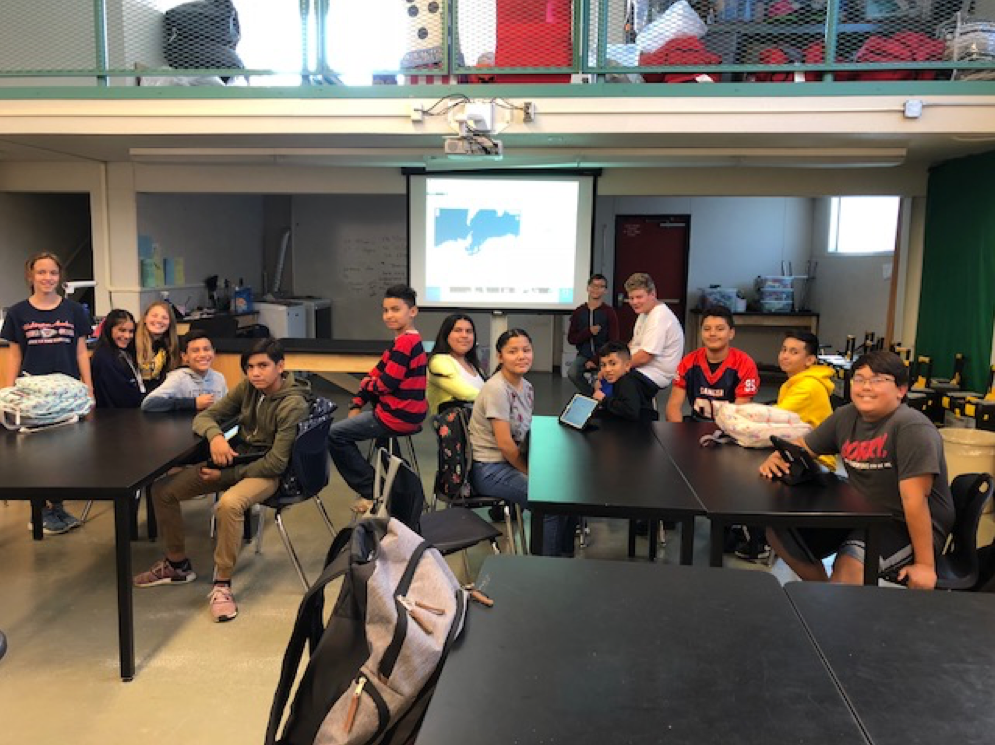
It is very humbling to know that you can have such an impact on students and hopefully inspire and motivate them to pursue a career in science, math, or whatever subject they are passionate about. And it is even better when we receive feedback from the students and teachers, such as Janell Miller, a middle school teacher located in a high-poverty area of central California. “Believe me, your outreach matters to students,” she said. “It brings in a whole world they would not have been able to access first hand. The IceBridge project—speaking with scientists and engineers—this has a lasting impact. I’ve had former students who participated in this chat years ago, when I taught elementary school, write that this was one of their best school memories in their senior papers.”
Seventh and eighth graders at Washington Academic Middle School in Sanger, California, connected live to the NASA IceBridge team aboard the DC-8. Credits: NASA/Emily Schaller
After 12 hours in the air today, we arrive back in Punta Arenas and make it back to our hotel anywhere from one to two hours after we land. The days can be exhausting, and we know that we will be doing this all again tomorrow. But I also know that along with collecting all of this extremely valuable data of Antarctic ice, I and other scientists and engineers aboard also make an impact on students all over the world. Personally, I find it even more important for me to be continually proactive in the student chats because I hope to encourage and inspire young female students to be interested and pursue careers in math and science, areas where we are currently underrepresented and crucially needed.
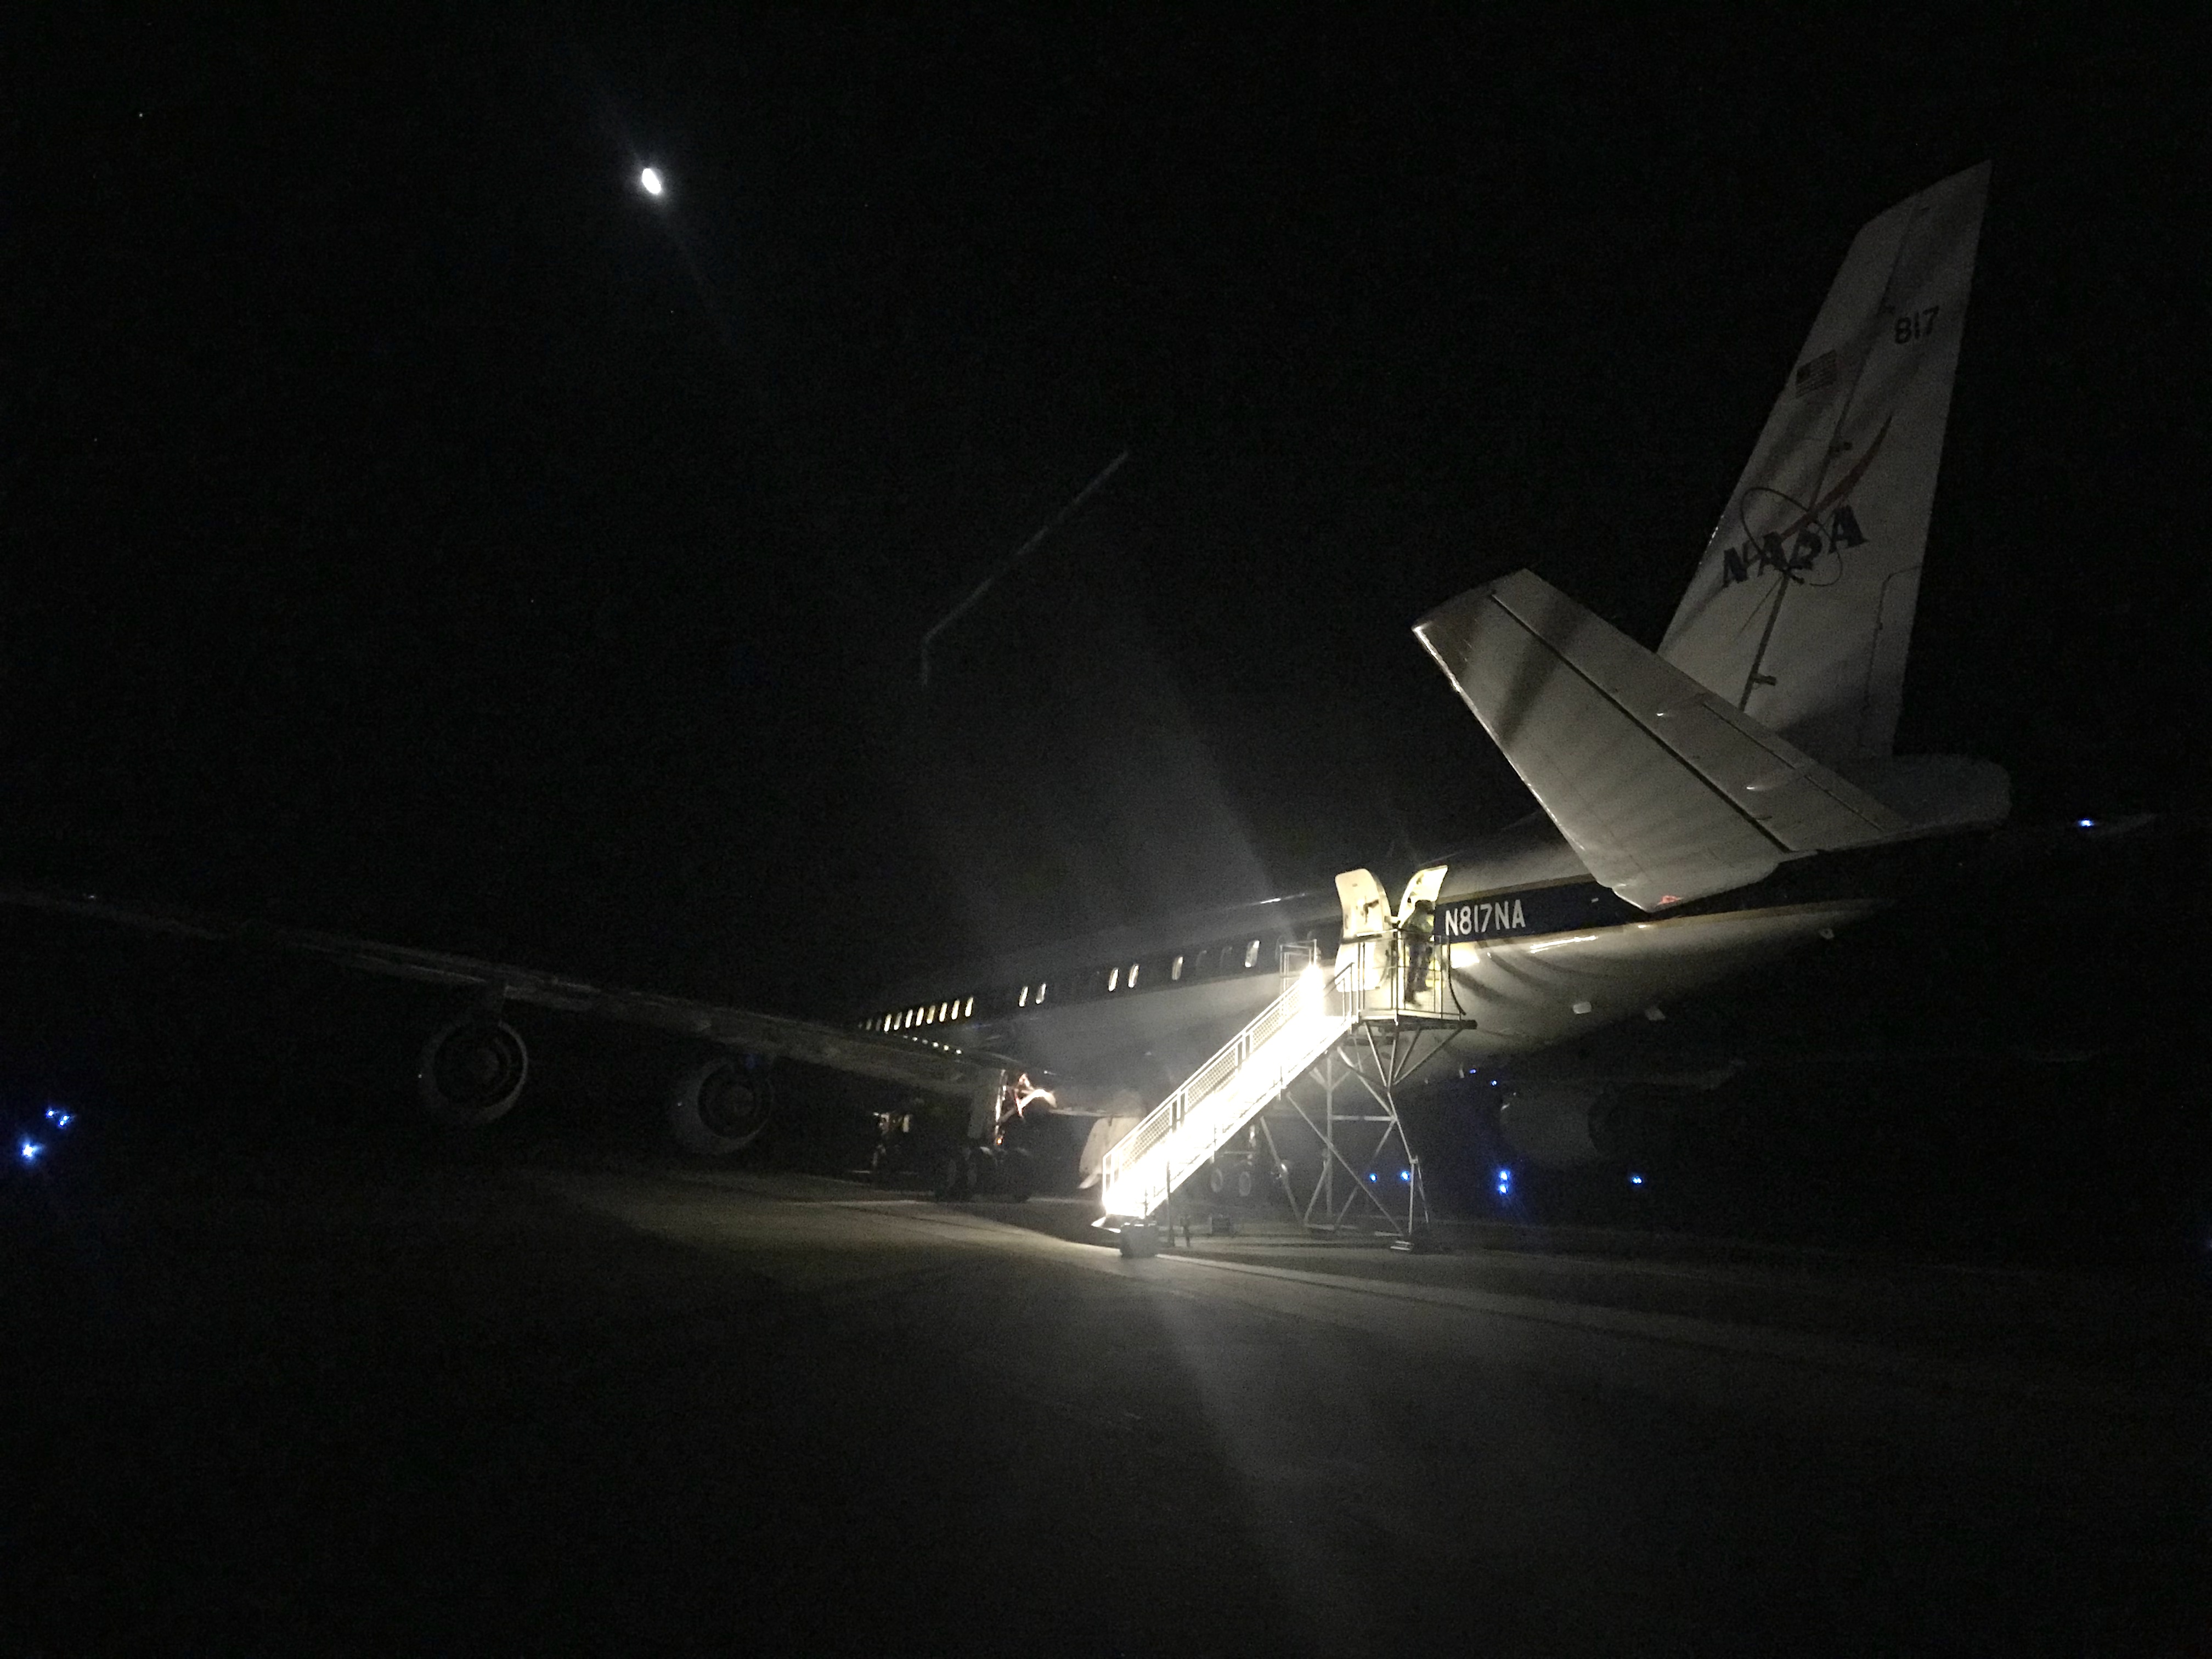
The NASA DC-8 plane arriving back at the Punta Arenas airport after a 12-hour science mission. Credits: NASA/Linette Boisvert
Joanne Speakman helps scientists map wetlands near the city of Yellowknife in the Northwest Territories, Canada. Credits: Paul Siqueira
by Joanne Speakman / NORTHWEST TERRITORIES, CANADA /
My name is Joanne Speakman and I’m from the Northwest Territories (NT) in Canada. I’m indigenous to the Sahtu Region and grew up in Délįne, a beautiful town of about 500 on Great Bear Lake. Now I live in Yellowknife, NT, and study environmental sciences at the University of Alberta. I was a summer student this year with the Sahtu Secretariat Incorporated (SSI), an awesome organization in the NT that acts as a bridge between land corporations in the Sahtu. My supervisor, Cindy Gilday, helped organize a once-in-a-lifetime opportunity for me and a fellow student from Délįne, Mandy Bayha, to fly with NASA. It was a dream come true.
One of NASA’s projects is called the Arctic-Boreal Vulnerability Experiment (ABoVE), which is studying climate change in the northern parts of the world. People from the circumpolar regions have seen firsthand how drastically the environment has changed in such a short period of time, especially those of us who still spend time out on the land. Weather has become more unpredictable and ice has been melting sooner, making it more difficult to fish in the spring. Climate change has also contributed to the decline in caribou, crucial to Dene people in the north, both spiritually and for sustenance.
Studies like ABoVE can help explain why and how these changes are happening. Along with traditional knowledge gained from northern communities, information collected by ABoVE can go a long way in helping to protect the environment for our people and future generations.
Wednesday, August 22, 2018:
Joanne Speakman sits behind the pilots during takeoff. Credits: Mandy Bayha
It was exciting to meet the ABoVE project manager, Peter Griffith, and the flight crew because it’s amazing what they do, and to fly with them was an incredible opportunity to learn from one another. Although we were from different parts of the world, at the end of the day we are all people who care about taking care of the environment. We flew on a Gulfstream III jet to survey the land using remote sensing technology. We flew from Yellowknife to Kakisa, Fort Providence, Fort Simpson and then back to Yellowknife.
During the flight, crew ran the remote sensing system and they explained to us how it works. It got complicated pretty quickly, but from what I understood, a remote sensor is attached to the bottom of the plane and sends radio waves to the ground and bounce back, providing information about the land below and how it is changing from year to year.
The pilots, Terry Luallen (left) and Troy Asher, make flying look easy. It was remarkable to see them work and to listen to them over the headset, says Speakman. Credits:At work in the Gulfstream III jet are flight engineer and navigator Sam Choi from NASA’s Armstrong Flight Research Center and radar operator Tim Miller from NASA’s Jet Propulsion Laboratory. Credits: Joanne SpeakmanFrom left: NASA pilot Terry Luallen, Mandy Bayha, NASA ABoVE Chief Support Scientist Peter Griffith, Joanne Speakman, NASA pilot Troy Asher.
August 24, 2018
NASA’s also working on building a satellite called the NASA-ISRO Synthetic Aperture Radar, or NISAR, which will help study the effects of thawing permafrost. Two of the lead scientists working on NISAR are Paul Siqueira and Bruce Chapman. While they were in Yellowknife, Mandy and I got invited to join them for a day to help collect field data.
Rock climbing isn’t the easiest in rubber boots, but Joanne Speakman and Paul Siqueira make it safe and sound. Credits: Mandy Bayha
We met with Paul and Bruce early in the morning and then drove out on the Ingraham Trail until we reached a small, marshy lake. We got out and walked along the lake’s edge, making measurements of the amount of marshy vegetation from the shore
Joanne Speakman admires a stunning view after the climb. The Northwest Territories has so many hidden gems, she says. Credits: Paul Siqueira
to the open water, an area that I learned is called inundation. We used our own estimations and also a cool device that uses a laser to tell you exactly how far away an object is. Paul and Bruce will use the information we collected that day to figure out the best way to map wetlands, which will help the ABoVE project study permafrost thaw and help with development of the NISAR satellite by comparing our results to satellite images of the area.
Mandy Bayha and Joanne Speakman use their canoeing skills. With them is NASA scientist and engineer Bruce Chapman, who Joanne is excited to learn has spent time studying the surface of Venus. Credits: Joanne SpeakmanUniversity of Massachusetts Amherst scientist Paul Siqueira enjoys the last canoe ride of the day with Joanne Speakman and Mandy Bayha. Credits: NASA/Bruce Chapman
In the afternoon, we surveyed a second lake, this time using a canoe. The sun came out and we saw ducks, a juvenile eagle, and many minnows swimming around. Nothing’s perfect, but this day was close to it and we learned a lot along the way.
Meeting and spending time with the NASA team, especially Bruce, Paul, and Peter, was the highlight of the two days. They’re incredibly kind and thoughtful and took the time to share their knowledge with us. ABoVE is a 10-year program and I hope there will be many more opportunities for northern youth to participate in such an exciting, inspiring project. There is so much potential out there. Thanks again for an amazingly fun learning experience!
Linette Boisvert, deputy project scientist for Operation IceBridge, “hanging out” in the belly of NASA’s DC-8 flying laboratory. Credits: Linette Boisvert
Hi all, you may remember me, Linette Boisvert, from previous blogs such as “Team Sea Ice or Team Land Ice?” and “Sick Sacks for Science,” where I gave a visiting scientist’s perspective on test flights for NASA’s Operation IceBridge Arctic Spring campaign. Well now I am back, but this time as the deputy project scientist for IceBridge. Yes, a lot has changed since my last blog.
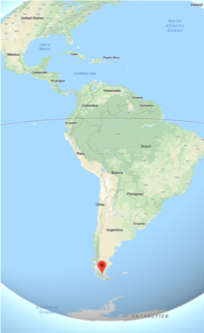
The location of Punta Arenas, Chile. Credits: Google Maps
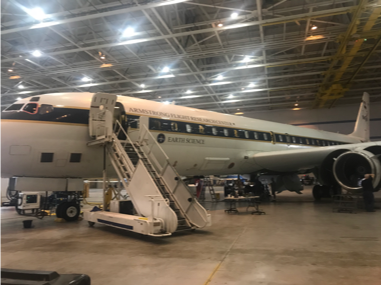
Beginning the second week of October, I will be flying down to Punta Arenas, Chile, (basically the other end of the Earth!) on NASA’s DC-8 flying laboratory to help lead IceBridge’s Antarctic Fall campaign. As I have never been to Chile, seen Antarctic sea ice in person (this is kind of a big deal), or flown on the DC-8 or met the crew, I took a short trip to NASA’s Armstrong Flight Research Center located in the California desert town of Palmdale, where the DC-8 is based.
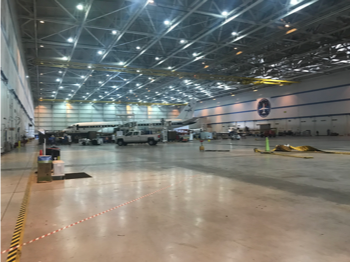
Once on center, I entered the massive hangar that houses multiple planes. This hangar was originally used to make B-52 bombers before it was acquired by NASA, and it is so massive that scenes from Pirates of the Caribbean were even filmed inside. (They had to bring in a very large pool.) But there it was, dwarfed by the large hangar: the DC-8. It will be my mobile “office” for the month of October, when we’ll do 12-hour flights from Punta Arenas, flying over the Antarctic sea ice and land ice and back again, taking measurements with lasers and radars. We do this every fall to monitor changes in the ice thickness.
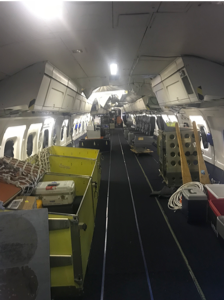
The hangar at NASA’s Armstrong Flight Research Center, with the DC-8 in the background. Credits: Linette BoisvertNASA’s DC-8 flying laboratory. Credits: Linette BoisvertA mostly empty DC-8 interior. Credits: Linette Boisvert
Now, this plane is a whole different beast than the NASA P-3 that I am accustomed to. It can seat up to 44 people with instruments aboard, compared to the 20 people that the P-3 can carry. The DC-8 has first class seats that recline and also has THREE bathrooms, and they’re like commercial airline bathrooms and not like composting toilets—what luxury! But when I first stepped onto the plane, it was basically empty. Seats were scattered around, there were containers about. I thought: “Are we really going to be able to fly this in a few weeks?” You see, I had arrived at the beginning of what we can “install,” and clearly there was a lot of work to be done. So naturally I was ready to lend a hand in any way that I could.
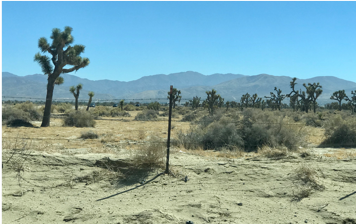
The desert around Palmdale and some Joshua trees. Credits: Linette Boisvert
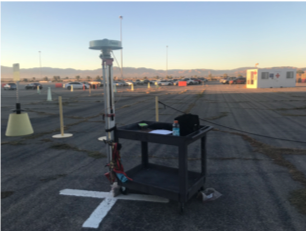
My first task was to help Mission Scientist John Sonntag, “The man, the myth, the legend” (as he is often called), with a ground Global Positioning System (GPS) survey. This basically means we would spend hours outside in the desert heat and sun, looking a little silly, pushing a cart around with a GPS antennae attached. We would be doing this at multiple specific locations around the parking lot and the runway. Now you might be wondering why we are torturing ourselves. For science and the mission of course! We need highly accurate GPS locations of easy-to-spot points from digital imagery so that we can geolocate our digital imagery and calibrate our camera during the test flights. Our instruments need to be calibrated so we can know the exact locations of our data when we fly and take measurements.
Our GPS ground survey antennae and cart just after sunrise. Credits: Linette Boisvert
So now that is cleared up you might be wondering, okay, why do you have this antennae jerry rigged to this cart? I learned that GPS antennas are finicky, and the antennae need to be pointed unobstructed to the sky to receive signals from the multiple satellites orbiting overhead. Thus, it cannot be blocked by anything from above, such as your head, lampposts, or trees because if any contact with the satellites is lost during the survey, it would have to be done all over again. The other option would be to carry this around with the antennae above your head the whole time, so having the choice, I think I will take the cart.
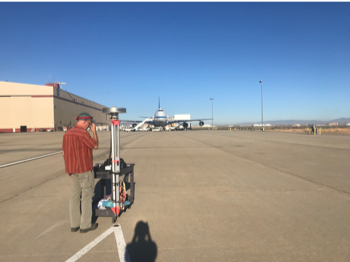
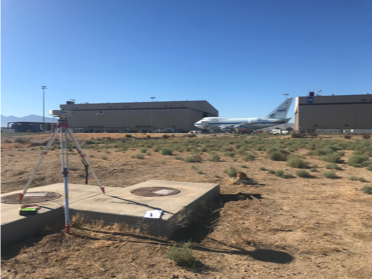
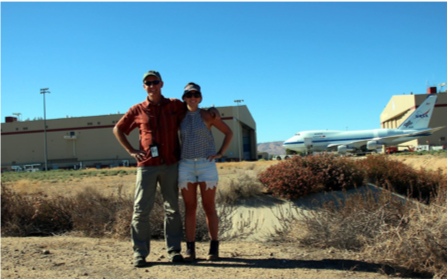
GPS ground survey on the runway with John Sonntag. NASA’s SOFIA plane is in the background. Credits: Linette BoisvertGPS ground survey in the dessert brush. NASA SOFIA plane in the background. Credits: Linette BoisvertGPS ground survey team John Sonntag and Linette Boisvert. Credits: John Sonntag
Well, it turns out we had to eventually abandon the cart, because some of our survey points were located in the desert brush, and our little cart was not made for off-roading. We tried. As we were trudging through the desert carrying the antennae above our heads, John told me all about rattlesnakes and what I should be on the lookout for. Great, with my luck we would come upon one. But alas, we didn’t run into any of our reptilian friends and were able to complete our surveys, albeit a bit parched, sunburnt, and sweaty.
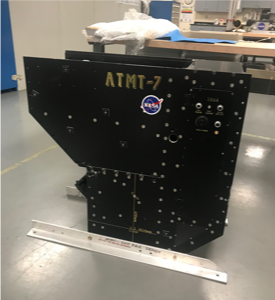
Now while we were surveying in the desert, the Airborne Topographic Mapper (ATM) team, the “Dream Team,” as I call them, were hard at work in the hangar installing their GPS ground station ATM T-6 and T-7 lasers
The ATM T-7 laser. Credits: Linette Boisvert
onto the belly of the DC-8, as well as their racks, which hold all of their computers and servers on the interior. They worked diligently for four long days, and at the end of the fourth day, they were finally ready to install ATM T-7. This baby weighs about 200 lbs and to me looked to be too big to fit into the door in the belly of the plane, so I knew I had to witness this!
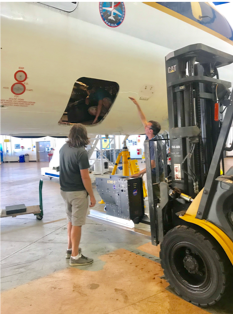
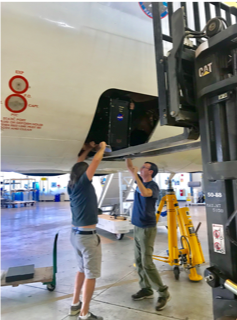
The laser was wheeled out to the plane, where it was then put onto a forklift, lifted up, and gingerly slid into the belly of the plane. It was a tight fit, and I was nervous to say the least, but it all worked out in the end. Phew! Next week the radar instrument teams will begin their install.
The ATM T-7 installation into the belly of the DC-8. Credits: Linette Boisvert
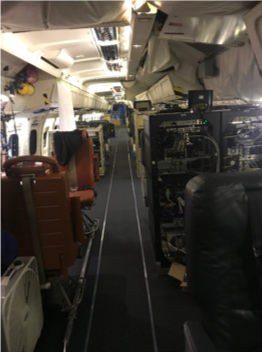
Before I left on my last day, I took a few quiet moments in the DC-8. Compared to when I arrived, the plane looked almost put together. I was in shock with how quickly and seamlessly the crew and the ATM team worked together. The seats were nearly all set up, and the ATM and navigation racks were installed. I felt a sigh of relief knowing that I would be working with a group of scientists and engineers who worked hard, and that no matter what unexpected issues or problems arose on this upcoming campaign, we would all be able to work together to fix the problem and continue to collect valuable science data of the Antarctic ice. Lets just say I couldn’t be more proud and honored to be a part of this IceBridge team.
A nearly completely installed DC-8 plane. Credits: Linette Boisvert
I also want to note that I am also very content to not be partaking in the DC-8 test flights next week over the desert, where they can be very turbulent, because I am not looking forward to having to test out any more “sick sacks.”
Golden hour looks good on the CTD, too! Credits: Alex Niebergall
Alex Niebergall is a PhD student in Earth and Ocean Sciences at Duke University and worked aboard the R/V Sally Ride in the North Pacific in August and September.
Before I joined the science crew aboard the R/V Sally Ride and set sail for the middle of the Pacific Ocean for my first ever research cruise, I can honestly say I did not know what to expect. Would it be an adventure? I hoped so. Would it be long hours in the lab? Undoubtedly. Would it be like stepping into National Talk-Like-A-Pirate-Day for an entire month? Maybe not. What I did know is that the research cruise meant 34 days on the open ocean doing what I love, and that was the only enticement I needed to sign up!
Scientists and crew aboard the Sally Ride watches the sunset as the ship leaves port in Seattle. Credits: Alex Niebergall
For me, it has always been about the ocean. Don’t get me wrong, I love science. I know this because my time as a researcher has taken me to far more windowless labs in the basements of old science buildings than remote, dream-like field locations, and I have enjoyed every second of this work too! But even this windowless basement science ties back to Earth, the environment, and most importantly (in my eyes) the ocean. Throughout elementary and high school, I was drawn to science and math because they gave me new ways to look at the world around me. Suddenly, every baseball game was a math problem—the velocity of the pitch, the angle of impact, the parabolic motion of the ball as it headed into the outfield (why no… I’ve never been very good at sports, how did you guess?).
As an avid outdoorswoman, science unlocked even more secrets. Physics and geology courses taught me about wave motion and erosion. Biology, ecology, genetics, and evolution classes allowed me to go to tide pooling and appreciate the radial symmetry of an ochre sea star while understanding its predatory role in the intertidal ecosystem. A firm grasp of chemistry allowed me to look at the ocean on a much smaller scale—a system of salinity gradients, dissolved nutrients, and pH balance. (Not to mention that chemistry makes cooking more interesting!) These subjects were interesting because I saw them every day around me, connected and continuously in flux, influencing each other in every way and giving me a new appreciation for all the activities and places I already loved.
Oh the places we’ll go…
In truth, science has taken me to some of the coolest places I could possibly imagine. As an undergrad, I went to field sites in the depths of the Northern California wilderness that look so wild and untouched they could be the set for the next Jurassic Park movie. I’ve been to redwood forests studying ecosystem dynamics. Science training took me to the underwater kelp jungles of Monterey Bay, California, and offshore Oregon where I learned, among other things, that measuring baby sea stars (sometimes the size of my thumb nail) becomes infinitely more challenging in a surge that forces you 8 feet in either direction. I also learned that sea creatures (specifically sea otters and trigger fish) have the ability and the instinct to irreparably damage science equipment, but THAT is a story for another time! Research took me to the underwater paradise that is the coral reefs of Indonesia, where night diving with bioluminescent dinoflagellates meant that the water around me perfectly mirrored the stars that sparkled out of the darkness overhead.
Alex Niebergall helps with Winkler titrations by mixing reagents with water samples to fix the dissolved oxygen. Credits: Collin RoeslerAlex Niebergall samples water from the morning optics cast. Credits: Abigale Wyatt
Now as a brand new graduate student in Earth and ocean science, I found myself living on a floating laboratory in the middle of the Pacific Ocean, with a view of the waves as far as the eye can see in a blue hue that is unlike anything I ever saw in my life. My group’s project aboard the ship was focused on quantifying how the plankton communities in the ocean influence carbon export by estimating the net community production at the ocean’s surface. We did this by measuring biological oxygen concentrations in the surface water and pairing these data with genetic analyses of the microbial community. These measurements allowed us to infer how much carbon was being taken up by biological processes and thus, taken out of the atmosphere.
With this project, those same subjects I learned to love in the tenth grade—chemistry, ecology, genetics, math—tied together (with the help and expertise of many, many other dedicated scientists) to give us a comprehensive view of what is happening in the ocean and how it affects our planet’s climate.
Yuanheng Xiong watches the sunrise from the back deck of the R/V Sally Ride. Credits: Alex Niebergall
To some, the idea of being a floating speck in the middle of the ocean may seem isolating (or at the very least, nausea-inducing). To me, it is the coolest place I’ve ever been. The view reminds me that I am a small part of something big, not just as a junior scientist in the immense scientific undertaking that is the EXPORTS project, but also as one small human in the middle of an enormous planet that we have the privilege to explore, admire, question, and hopefully understand. Today, I am a happy, and very lucky, scientist because I was on this wild adventure, working alongside some of the most inspirational and dedicated scientists I have ever met.
But tomorrow? Tomorrow I am eagerly waiting to see where science will take me next.