Rocking and Rolling Over Summer Sea Ice

An airplane view of sea ice in mottled white and blue with cracks.
The thickness of melting Arctic sea ice, seen here north of Greenland on July 11, 2022, is tricky to measure from space, but a NASA campaign is designed to improve height measurements from the ICESat-2 satellite. (Credit: NASA/Kate Ramsayer)

By Kate Ramsayer / PITUFFIK, GREENLAND/

I can’t quite find the right words to describe summer sea ice from the air – which is unfortunate, since I’m writing this post about NASA’s ICESat-2 summer sea ice airborne campaign.

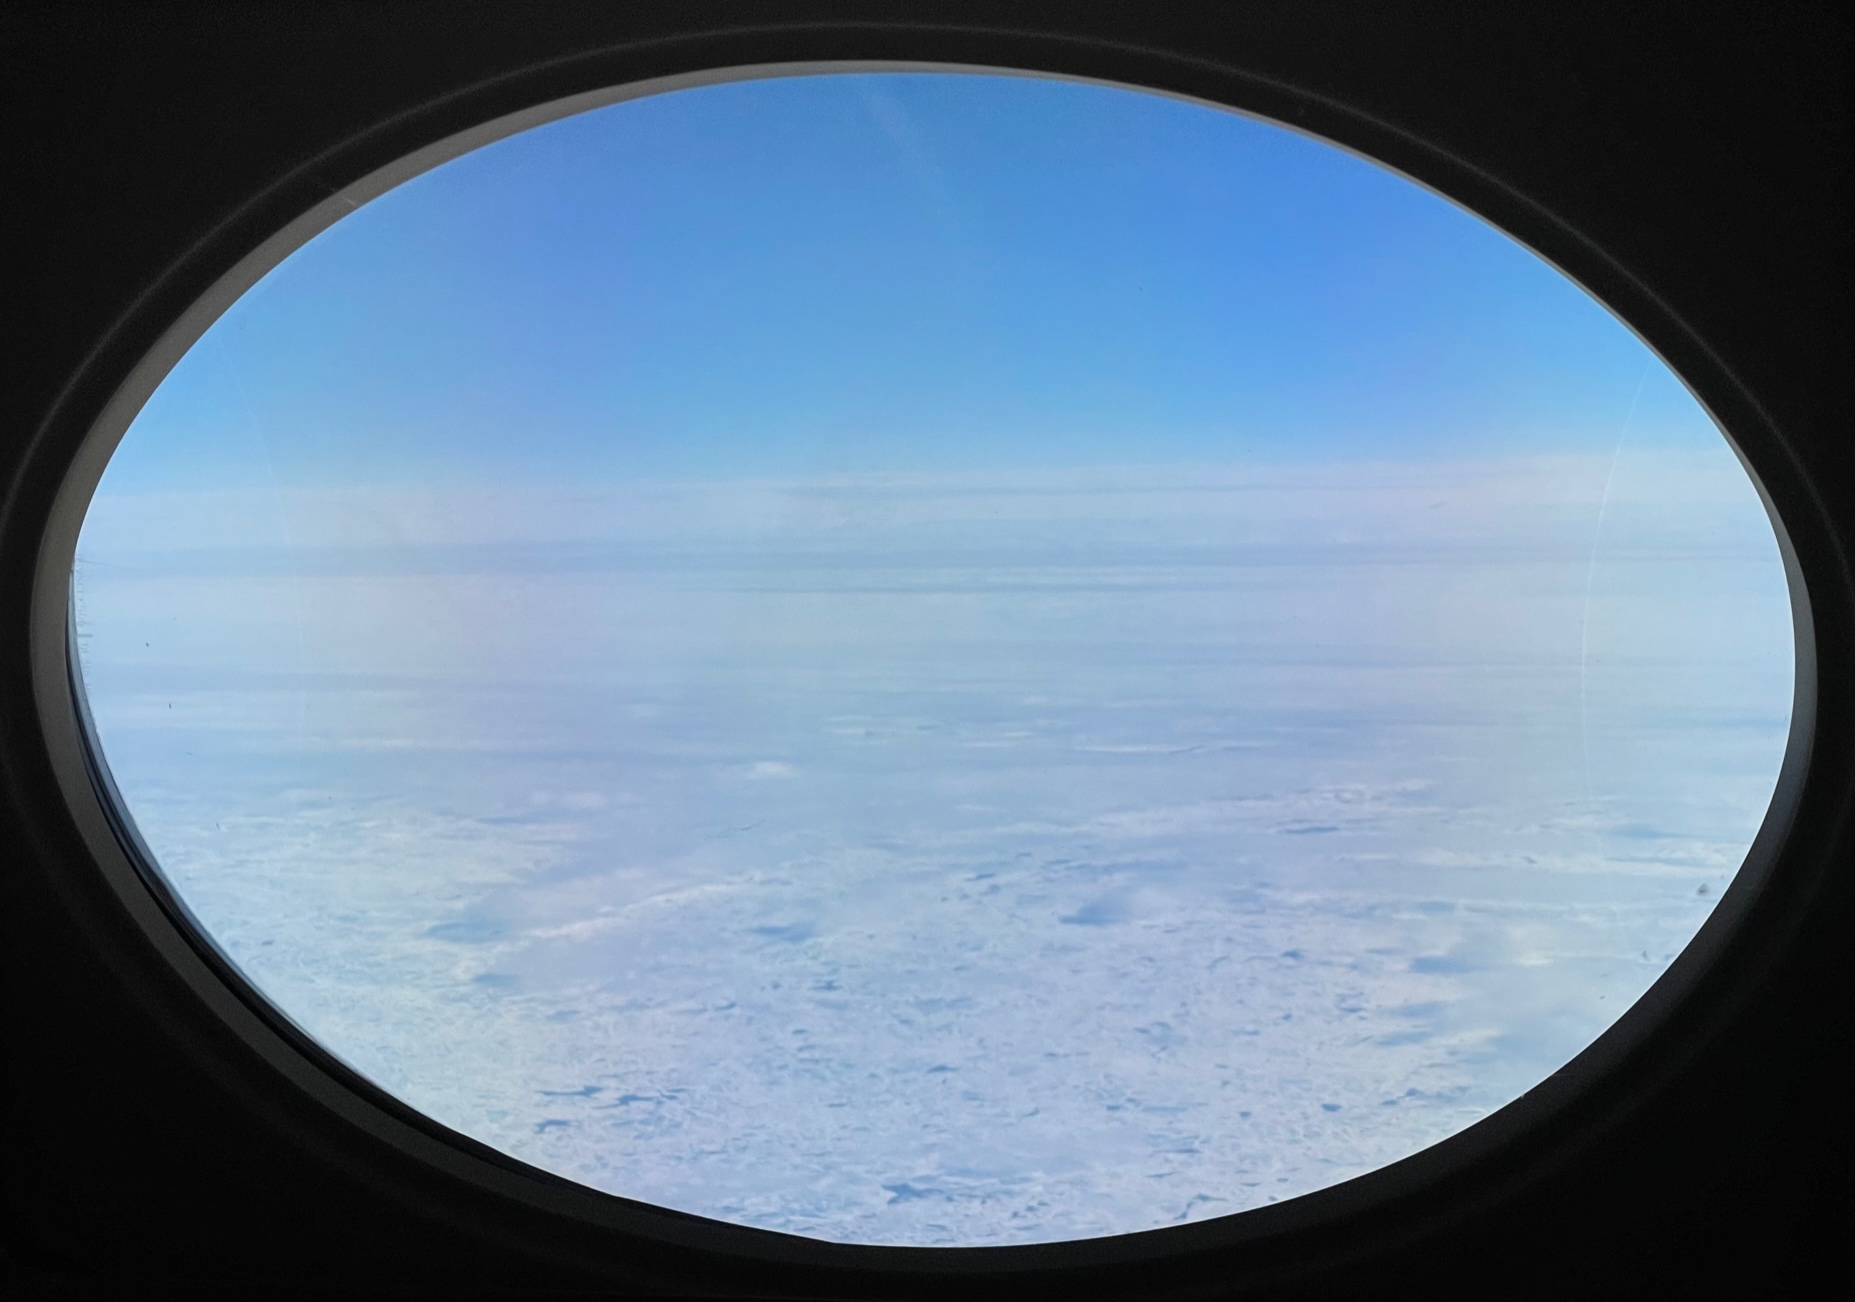
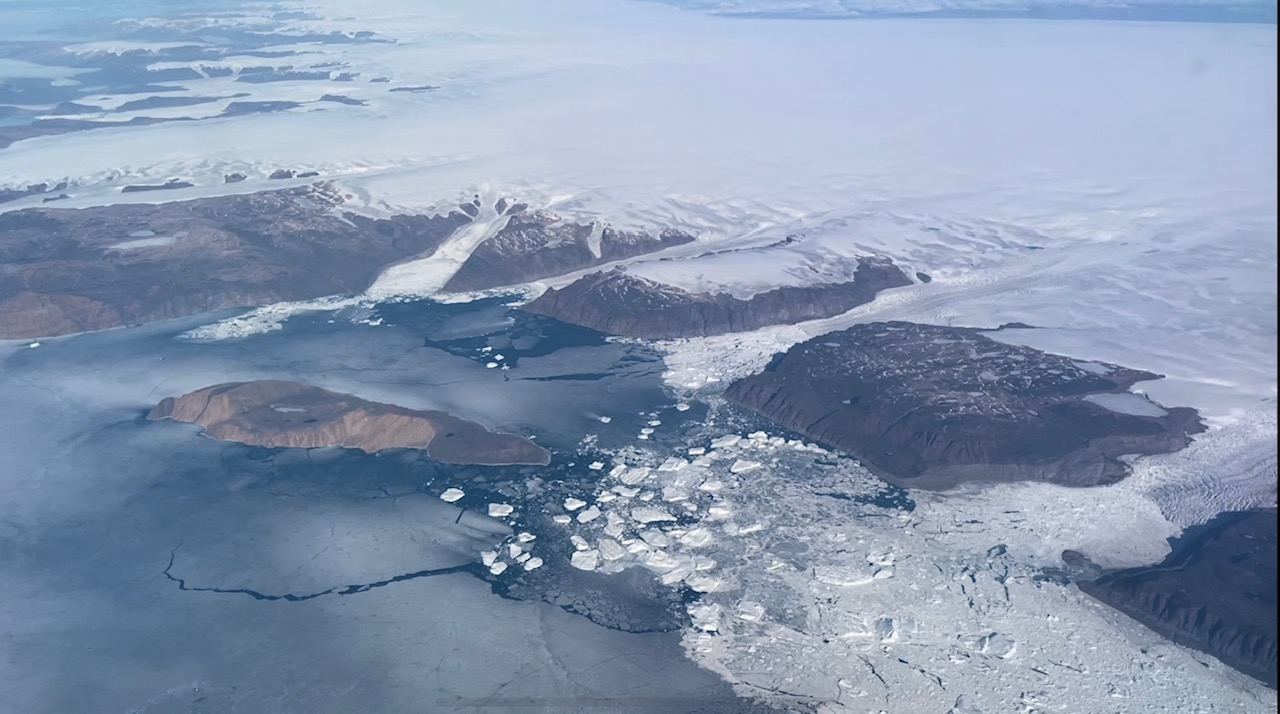
It’s like miles and miles of shattered glass, these bits and pieces of ice broken apart and jammed back together. It’s like a honeycomb pattern, except, well, more a mishmash of geometric shapes, no neat hexagons. A 10,000-piece jigsaw puzzle of white ice floes and teal melt ponds and dark open ocean? Let’s go with that.

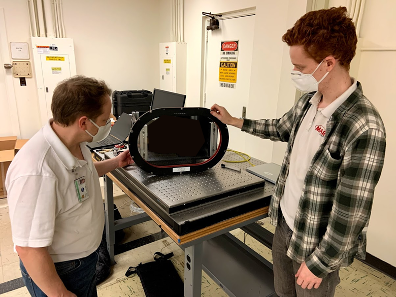
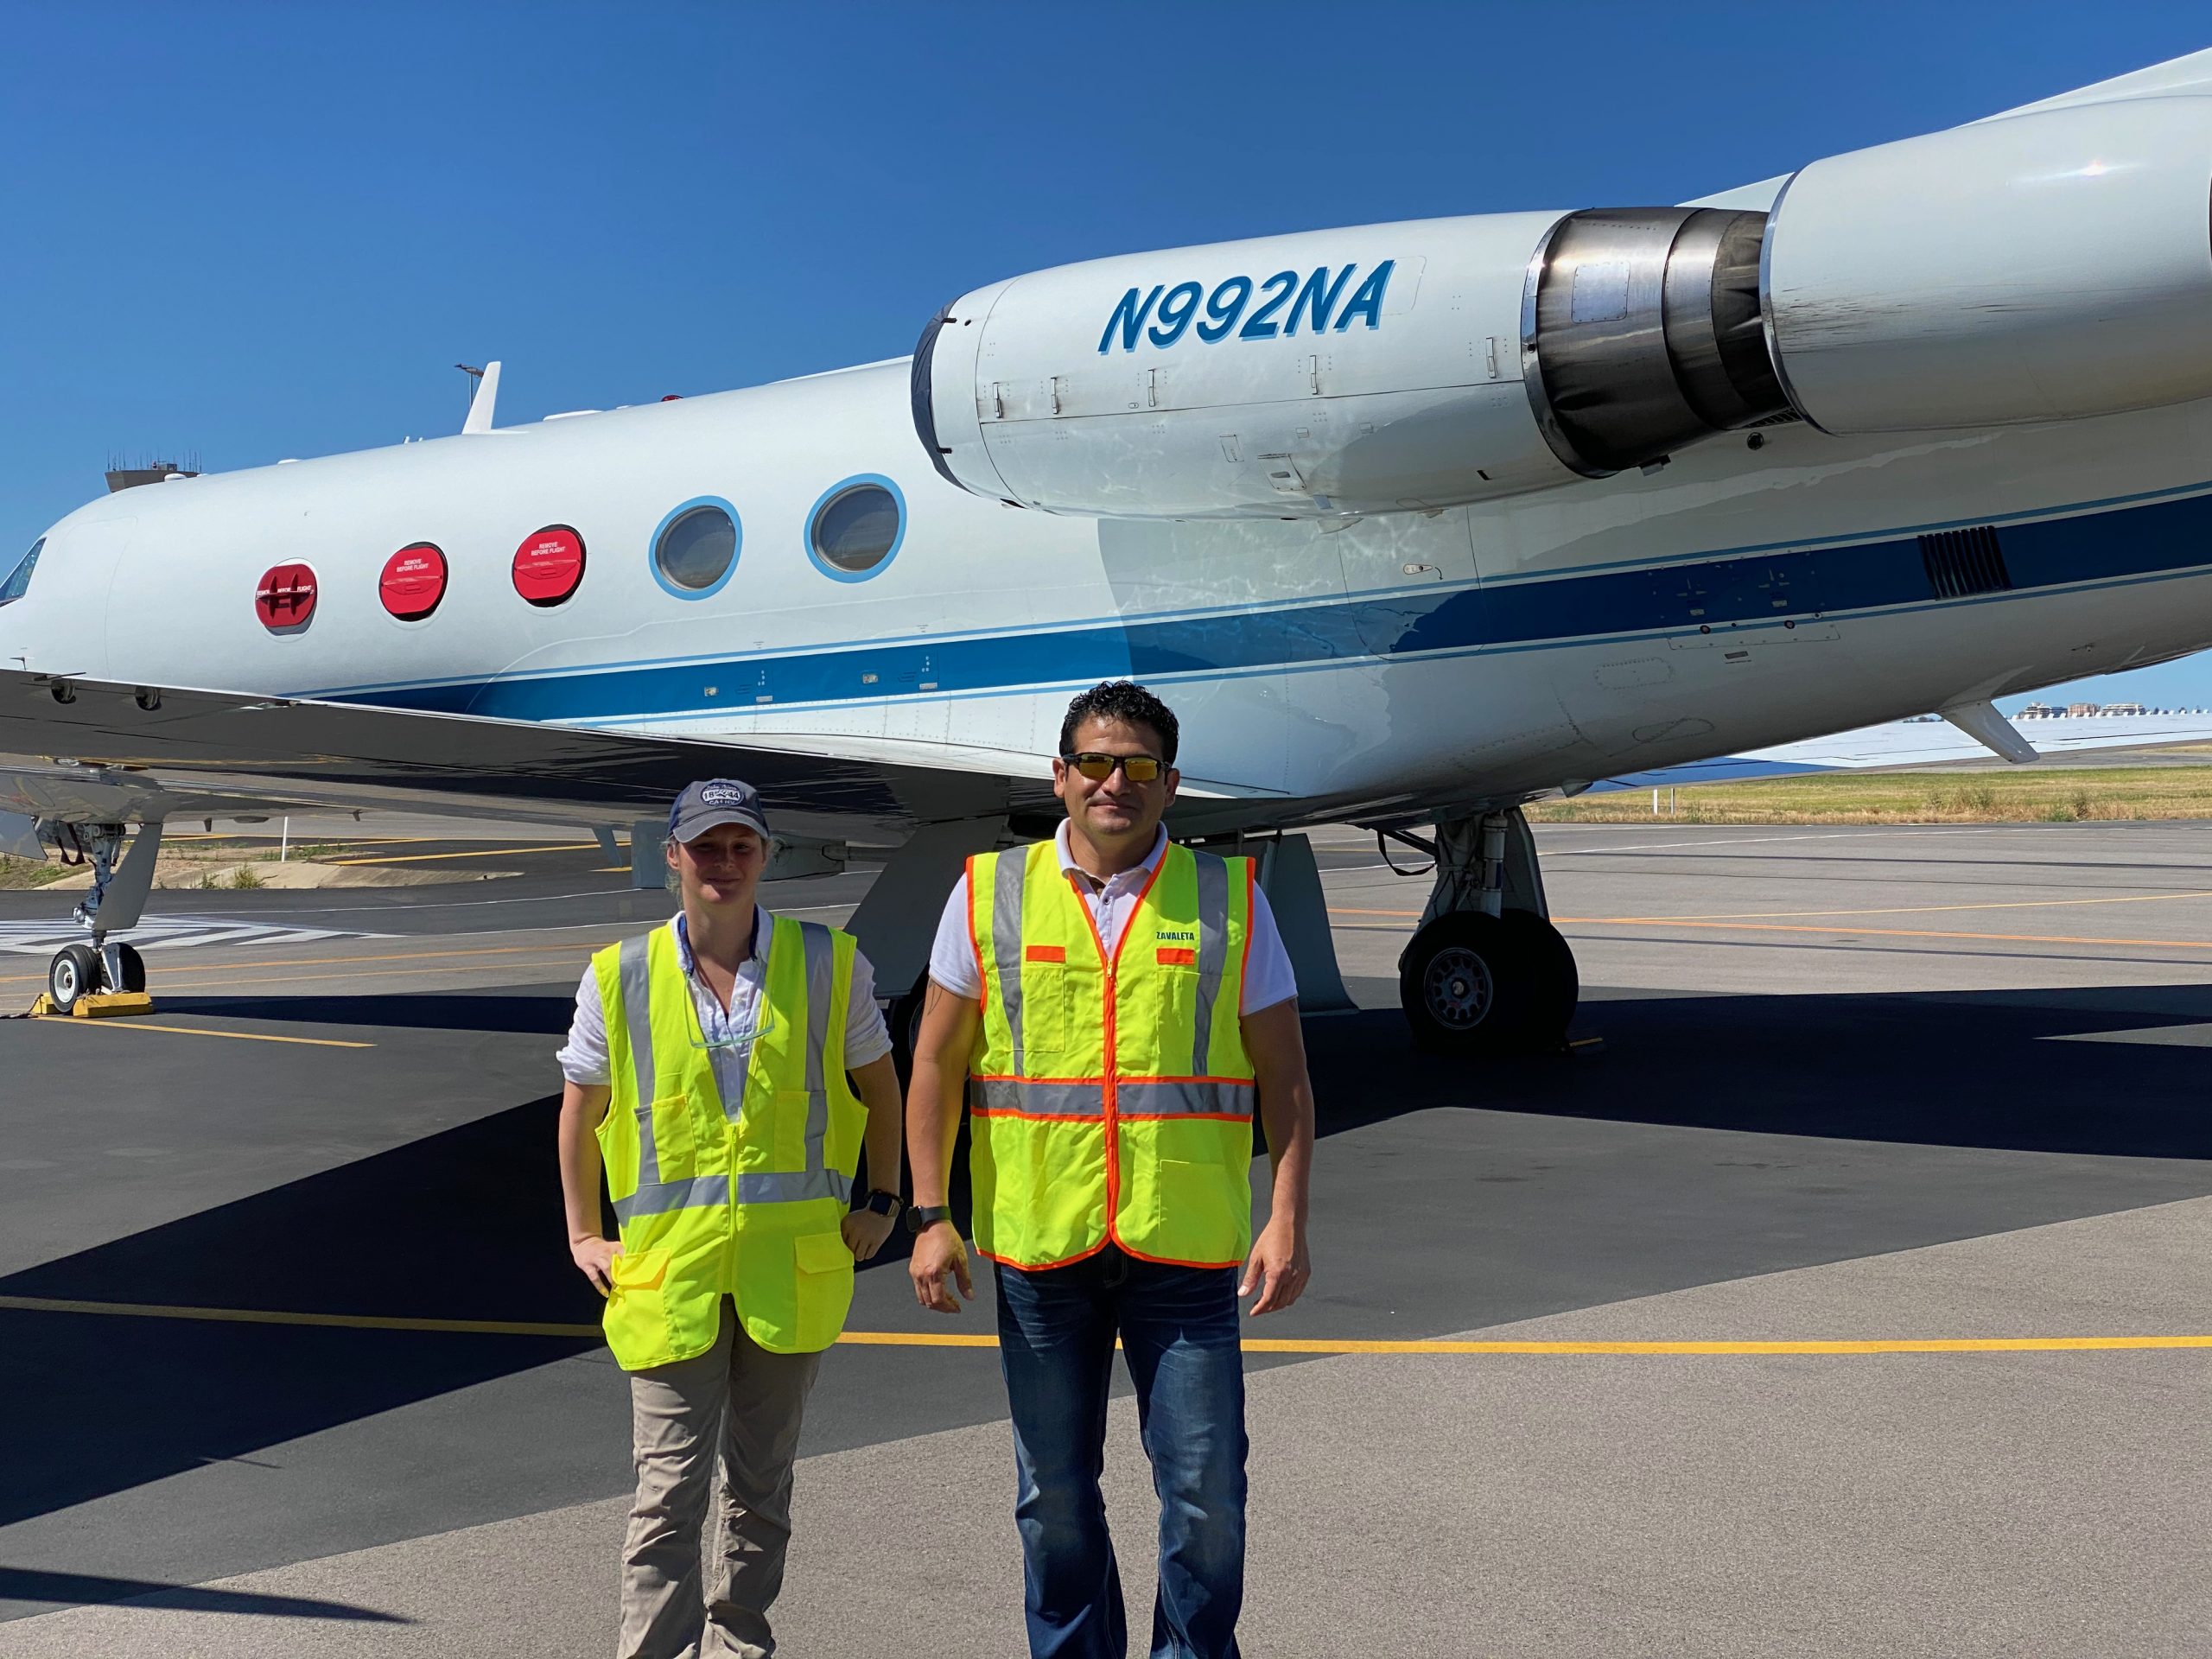
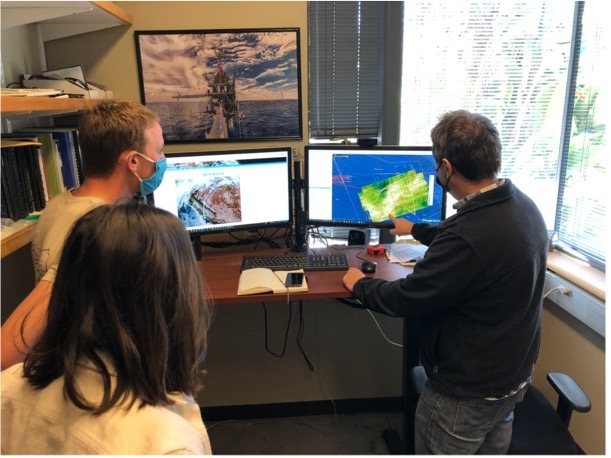
We’re flying above the Arctic Ocean in NASA’s Gulfstream V plane, a repurposed corporate executive jet (the swoosh branding of the previous owner still adorns the stairway). Onboard are two laser instruments that precisely measure the height of the ice, snow, melt ponds and open ocean below. Hundreds of miles above us, earlier that morning, the ICESat-2 satellite flew the exact same path, measuring the same ice. Scientists will compare the sets of data to improve how we use the satellite measurements, and better understand how and when sea ice is melting in the warming summer months.

The view of sea ice out the airplane window. White extends in all directions to the horizon line, cloudless blue sky above.
Arctic sea ice and clouds, as seen from NASA’s Gulfstream V jet on July 11, 2022. (Credit: NASA/Kate Ramsayer)
Two women and two men are gathered around a pair of laptoms, looking at the screens in carpeted hotel room.
NASA Goddard scientists, from left, Nathan Kurtz, Michelle Hofton, Marco Bagnardi and Rachel Tilling study weather forecast models and ICESat-2 flight paths to plan a flight over the Arctic Ocean. (Credit: NASA/Kate Ramsayer)

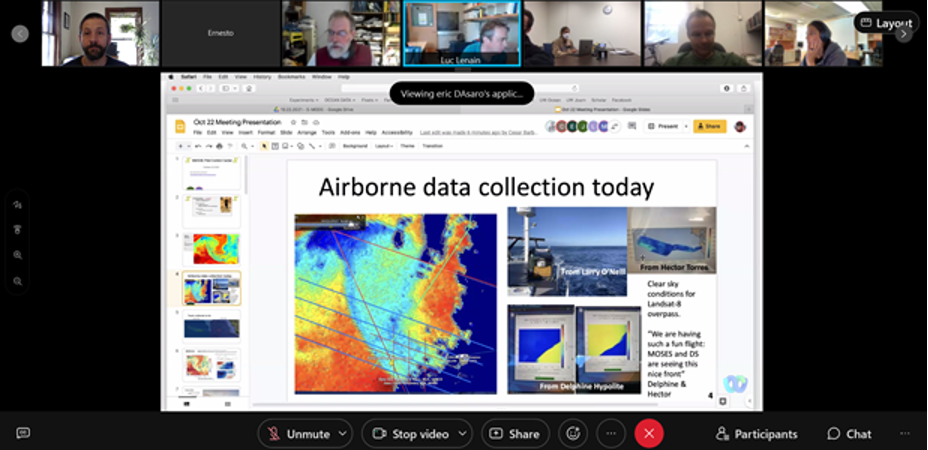
Lining up the instrument measurements and the satellite measurements is no easy feat. Starting days before, the scientists had gathered in a common room at our hotel on Thule Air Base in northwestern Greenland, comparing the orbit paths of ICESat-2 with weather forecasts of clouds. Clouds are the scourge of summer airborne campaigns in the Arctic – large storm systems can cover almost the entire ocean, and weather forecast models are not as reliable at this high latitude.

But on this first flight of the campaign the clouds clear for long stretches, sending the scientists, instrument operators and yours truly to the windows to oooh and ahhh at the spectacular ice below.

“Now this is the good stuff,” said Rachel Tilling, sea ice scientist at NASA’s Goddard Space Flight Center, as the abstract stained glass mosaic (that any better?) of sea ice appears under sunny skies.

It’s mesmerizing, watching all the ice go past, seeing the cracks between flows and the ridges where the bits of ice have slammed into each other and refrozen. This campaign is particularly interested in measuring melt ponds, bright bits of teal where the snow covering the sea ice has melted and pooled, causing the ice to thin from the surface.

On the aircraft a scientists sits in gront of a boxy instrument, looking at the screen readout.
NASA Goddard’s David Rabine monitors the LVIS instrument as it gathers height data on the melting Arctic sea ice below. (Credit: NASA/Kate Ramsayer)
The view of sea ice from directly above taken by the LVIS instrument. Mottled white and pale blue sea ice with thin cracks fills the scene.
NASA’s Land, Vegetation and Ice Sensor (LVIS) uses a laser to measure the height of what it flies over, and also carries a camera to collect images like this one, over the Arctic Ocean north of Greenland on July 11, 2022. (Credit: NASA/LVIS team)

As we kneel in front of the port windows, looking out, the laser instruments are right next to us, looking down. On this flight, Goddard’s Land, Vegetation and Ice Sensor (LVIS, pronounced like The King) is firing its laser to time how long it takes for light to go from the plane to the ice or pond or water and then return; ICESat-2 is doing much the same thing from orbit.

It’s not all smooth sailing, though. To calibrate LVIS, the plane has to do a series of pitches and rolls. In the air. Over the polar ocean. With me on board.

I’m not a huge fan of flying. It’s only been a decade or so that I can fly without imagining a fiery death every time we hit a bit of turbulence. (I know, “physics,” but still.) I tolerate it, though, because I love going places.

A view from the plane of Grenland's white glaciers on land in the top and top right of the image. Brown rock of the cliffs and shoreline are a buffer between the land ice and the gray-blue sea ice on the ocean. Broken chunks of icebergs are on the right edge of the image, and a brown rocking island is in the bay.
Glaciers flow into a frozen fjord dotted with icebergs in northern Greenland, as seen from NASA’s Gulfstream V jet flew from Thule Air Base to measure sea ice for the ICESat-2 airborne campaign. (Credit: NASA/Kate Ramsayer)

But now we’re in a small plane, intentionally doing a series of pitches (up fast, then down fast) and rolls (one wing down, then the other wing). Intentionally. Three times. The first time is the worst, says Nathan Kurtz, ICESat-2 deputy project scientist and the campaign’s leader. Maybe for some; not for me. The first time was kind of fun, I’ll grant you, and there’s video evidence somewhere of me laughing nervously.

The second time: “Isn’t the LVIS calibrated well enough?” was the primary thought in my mind, which is why I’m not an instrument scientist.

The third time, I was regretting the snacks I had brought along for the flight. Look to the horizon, I told myself – right as the plane started its rolls. The horizon quickly disappeared, and then the plane rolled the other way, and it was all ice, and then it rolled the other way….

I closed my eyes, took deep breaths, and imagined the spectacular view, a patchwork of ice and water, that would be there once the plane stopped rolling.

NASA Airborne and Field Data Workshop, March 29-30, 2022

Four images in a grid, two with aircraft and two without, showing different views of Earth's surface. Text reads: NASA Airborn and Field Data Workshop, March 29-30, 2022
Credit: NASA

NASA’s Earth Science Data Systems (ESDS) Program Airborne Data Management Group (ADMG) and the Earth Science Data and Information System (ESDIS) Project are holding a two-day NASA Airborne and Field Data Workshop March 29-30, 2022. This workshop offers an opportunity for stakeholders to provide input on ways to improve the usability of NASA airborne and field data. The first day of the workshop will focus on input from data users, and the second day will focus on input from data producers.

Skier, Mountaineer, Snow Scientist: In the Field with the Women of SnowEx

By Gabrielle Antonioli, Montana State University /BOISE, IDAHO/

“Watch me,” I say to Megan as I tip my skis over the edge of snow at the top of a steep gully in the southern portion of the Sawtooth Mountains in Idaho. She nods knowingly from the ridge above. Not letting her eyes leave me, she watches as I quickly pop off my skis and get my shovel out of my backpack to dig a snow pit. Though this pit is smaller than the snow pit we dug the previous day at the Banner Summit weather station and radar site, it gives us a similar glimpse at the structure of the layered snow under our feet. After a quick test to assess the strength and stability of the snowpack as well as look at the overall structure of the top meter of snow, I determine the snow looks stable (which means the risk of avalanche is low) and we start our ski descent down the narrow snow gully. 

abrielle Antonioli assessing the snow atop the Elevator Shaft ski line in the Sawtooth mountains of Idaho.
The other side of snow science: Gabrielle Antonioli assessing the snow atop the Elevator Shaft ski line in the Sawtooth mountains of Idaho in March of 2021. Credit: Megan Mason

The intersection between scientists who study snow and those who are fascinated with mountaineering and avalanches is an interesting one, to say the least.  Like many other Earth sciences, we must venture out into the element of study and observe it carefully and with a curious mind to start to understand the complex dynamics by which it operates.  And though the snow-centric field of cryosphere science is infinitely interesting, it is an intimidating path to choose. Women in cryosphere sciences – whether on the path of data scientist, glacier researcher, or avalanche forecaster – are few and far between. I met like-minded women like Megan Mason and Isis Brangers when I joined HP Marshall’s Cryosphere Geophysics and Remote Sensing group (CryoGARS) at Boise State University and the NASA SnowEx 2020-2021 campaign he led as co-project scientist. Isis is currently finishing her Ph. D. with the CryoGARS group and previously worked on a project studying snow depth over the European Alps with the European Space Agency’s Sentinel-1 satellite. Megan is currently a research scientist for NASA’s Goddard Space Flight Center. 

Megan Mason using an SMP on the Grand Mesa SnowEx campaign in 2020, photo: C. Hiemstra.

SnowEx campaigns utilize traditional snowpit observation techniques alongside techniques aimed at being able to monitor and infer properties about the snow from afar. These include Unmanned Aerial Vehicles (UAVs), light detection and ranging (LiDAR), SnowMicroPenetrometry (SMP), liquid water content sensors, ground-penetrating radar, and airborne inferometric synthetic aperture radar (InSAR).

HP Marshall and Isis Brangers doing a full snow pit profile. Credit: Megan Mason

Remote detection of snow water equivalent (SWE) – or how much liquid water a snowpack contains – has long been a goal of hydrologic scientists. SWE is important to other branches of the snow world, like avalanche control and forecasting, which attracts a variety of scientists with specialized skill sets that enable them to reach mountain locations in winter. This work is challenging and involves risk, and I’m continually inspired by the women I meet that can troubleshoot a faulty weather station, dig a full profile science snow pit in a blizzard, and handle adversity of any kind with positivity and determination.

Isis clearing the solar panels on a radar station.
Isis clearing the solar panels on a radar station at Banner Summit, Idaho. Credit: HP Marshall

Large hydrology-focused projects like SnowEx can directly benefit the snow and avalanche community, and subsequently many economies across the mountain west. This is where the intersection between backcountry skier and snow scientist occurs. Mapping SWE throughout a mountain range in real-time would shift the entire landscape of forecasting for both snow hazard and spring water run-off monitoring. Currently, these monitoring efforts are based on using index sites such as Snowpack Telemetry sites, or SNOTELs, combined with historical knowledge and experience, to help extrapolate how much water the snowpack holds.  Even with current technology, precipitation estimates are relatively unreliable in some places and can be highly uncertain in both amount and type of precipitation. With remote sensing technologies like those being tested with SnowEx, and the women behind the scenes working to improve these technologies, we can fill that gap.

Megan Mason in the snow in Grand Mesa.
Megan Mason on the Grand Mesa 2020 campaign. Credit: K. Hale

The focus of the 2021 SnowEx airborne and field effort in Idaho was part of an experiment at sites in the Boise and Sawtooth mountains, in addition to sites in Utah, Colorado, and Montana. Radar sensors were flown at 40,000 feet each week across all sites from January through March, producing a time series. The sensor that was used has shown promise for mapping changes in SWE and a similar sensor may one day be launched into space in 2023 by a joint NASA and Indian Space Research Organization satellite mission called NISAR.  

Though the 2022 SnowEx campaign was canceled due to COVID-19 concerns, data collection continued at ground-based radar station sites and helicopter LiDAR flyovers continued over these zones. This data is key to refining remote sensing technologies for snow. Collecting data that is both accurate over large areas and sampled at frequent time points is important because accurate snow data estimations require that our instruments are precise. 

Snow research is a challenging field to enter, but barriers to that entry are getting lower. Women like Isis and Megan forge a path for others to enter the field with less resistance and support to reach even further. Snow’s ability to serve as a water reservoir is shifting beneath our feet due to climate change, whether we sense it or not.  Disparities in weather patterns, rising rain lines in the mountains, and unpredictable climate patterns are at our doorstep.  Research like the NASA SnowEx campaign is key in developing new tools to observe these environmental changes.  Our efforts to synthesize and utilize new and non-traditional tools as well as offer a diverse and supportive workplace can help us better understand the past and the changing future. 

Gabrielle looking into the Sawtooth Range in Idaho.
Gabrielle looking into the Sawtooth Range in Idaho in March of 2012. Credit: Megan Mason
Gabrielle setting a trail on skis.
Gabrielle demonstrating some of the more unique skills of snow science– setting a good trail! Credit: B. Kniveton
Megan Mason skiing the Elevator Shaft in the Idaho backcountry.
Megan Mason skiing the Elevator Shaft in the Idaho backcountry. Credit: Gabrielle Antonioli


Planning, Coordinating and Communicating: The Science Behind Winter Storm Chasing Experiments

by Abby Graf

As the snowstorm headed through New York on February 24, one professor at Stony Brook University in Stony Brook, New York spent the hours leading up to it preparing his students to head right into the storm.

Brian Colle, atmospheric science professor at Stony Brook University, is part of many operations in NASA’s Investigation of Microphysics and Precipitation for Atlantic Coast-Threatening Snowstorms (IMPACTS).

Whether it’s preparing a team to operate radars and mobile trucks, launching weather balloons, or flying in the cockpit of one of two aircraft used in the experiment, Colle’s job deals with the fun of coordinating and communicating, and the heart of the mission: science. IMPACTS aims to understand the precipitation mechanisms within snowstorms. The campaign uses two aircraft, ground-based radars, weather balloons, computer simulations, and airborne instruments to help answer questions about how snowstorms form and develop, and how to better predict them.

“One of my jobs is serving as the liaison between the teams,” said Colle. “We start with a briefing the morning of, then I’m making sure I know the plan of the day. I’m coordinating, sending emails, making sure the radar truck is ready. As the mission goes along, I’m in contact with the teams the whole time, making sure we’re collecting data. The job isn’t finished until the storm is over.”

Using Mobile Radar Trucks at Key Locations to Capture Data 

Colle sent teams of students out midday on February 24 to prepare for the overnight storm. One of the teams operates the mobile radar truck that has a Skyler-2 radar on it, which sends out pulse signals every few seconds to collect observations about the atmosphere from lower altitudes, providing high-resolution data from the large geographic regions it samples. “This is the next generation of radars; [helping us] understand rapid storm evolution,” said Colle.

Radar truck parked in a snowy lot with instruments on the back.
The Stony Brook University radar truck deployed during a storm. The instruments on the back of the truck provide data from the Skyler-2 radar, snow size particle sizes from the Parsivel instrument, as well as pressure, temperature, humidity, wind direction, and wind speed of the storms they sample. Photo courtesy of Brian Colle.

The truck is also outfitted with a Parsivel instrument, which is a vertically pointed radar that samples the sizes of snowflakes or raindrops, along with a standardized weather instrument package including thermometers, gauges, pressure sensors, and more. Some of the team headed up to the storm hours before it began to find a location with good visibility in all directions. The goal is to have an area where trees and buildings are not blocking the sensing instruments. While collecting data would’ve begun around 1 a.m., internet issues prevented the team from getting the experiment running, but they have collected a great amount of data from past storms. 

Launching Weather Balloons in the Depths of the Storm

Back at Stony Brook University, Colle organized a group of students to launch weather balloons on campus to measure temperature, pressure, and humidity at different altitudes. An instrument package is attached to the balloon and can “communicate” with a computer on the ground, sending data back as the balloon rises in the air.

A group of students prepares to launch a weather balloon from a snowy field.
A group of Stony Brook students getting the weather balloons ready for a past storm on January 28, 2022. The instruments are tied to strings attached to the balloons, including a parachute and GPS system that provides the location of the balloon. Around 8 kilometers (5 miles), the communication drops off and contact is lost with the system. Photo Courtesy of Brian Colle.

These balloons are launched from a radar truck, which is also equipped with instruments to measure snowflake characteristics. The team started collecting data hours before the two aircraft reached the storms. The P-3 aircraft flies directly into the storm, with instruments aboard to collect data and images from various altitudes. This gives scientists a deeper look at the microphysical properties of the storm, while the ER-2 aircraft flies at roughly 65,000 feet, capturing data with six remote-sensing instruments from above the clouds. The ER-2 arrived at the storm around 4:30 a.m., but the P-3 faced mechanical issues that delayed its launch until the morning of February 25.

The Full Flight Experience

Though not on the P-3 flight this time around, Colle has had the opportunity to fly in the cockpit of the aircraft a few times the past two months, including the February 17 snowstorm in the Chicago area. This falls under his one of many roles but is one of the reasons he joined this mission early on. Interested in studying snowstorms for years, being in the cockpit of the plane during these storms is a lot of fun for Colle. He’s the mission scientist when on the plane, helping interpret the data collected, modify flight tracks, communicate any changes to the pilots, and helping with coordinating the instruments on the plane to make sure everything is functioning and communicating. 

One of the lessons he’s learned is how the pilots navigate the busy airspaces. In populated areas like Chicago or New York, there are a lot of planes taking off, flying, and landing, requiring the pilots to coordinate where the aircraft is headed. It requires a team effort to figure out how to best orient the aircraft. 

With a radar snapshot showing the storm being sampled by the P-3 aircraft, Colle snaps a selfie in the cockpit of the plane. Photo Courtesy of Brian Colle.

“It’s awesome to be a part of the mission. For many years we didn’t have these opportunities. In the past, I’d take measurements on the ground, collecting snowfall and looking under a microscope at the crystal shapes and habits. Looking at data in real-time, looking out the window, and then interacting with the pilots and hearing what they have to deal with…it’s a continuous science experiment and participating in regions we haven’t sampled before has been very exciting,” said Colle.

As IMPACTS winds down its science experiments this winter, Colle and the rest of the team are looking forward to their opportunities next time around. Winter storms aren’t always the easiest to sample, and the scientists are constantly learning. But the instances in which challenges and difficulties occur only make Colle more confident that the data collected this year will give them better opportunities for improvement next year.

Storm Chasing Scientists Fly Into the Clouds to Understand Winter Snowstorms

By Abby Graf

Imagine the feeling of flying on an airplane. Smooth sailing, clear skies, not a cloud in sight. It’s a relaxing ride that many take for work or recreational travel. Now imagine flying through clouds, with the turbulence of different intensities. While some sink and hold onto their seats, others view it like a rollercoaster ride with their adrenaline pumping. Christian Nairy and Jennifer Moore know a thing or two about that.

Nairy and Moore, two atmospheric science graduate students at the University of North Dakota, are part of NASA’s Investigation of Microphysics and Precipitation for Atlantic Coast-Threatening Snowstorms (IMPACTS). Their job is to operate probes on one of two aircraft used in the experiments. The P-3 aircraft that houses their airborne office flies directly into the snowstorms, allowing the instruments Nairy and Moore operate to measure snow particles and atmospheric properties within the storm clouds.

The P-3 aircraft on the tarmac at NASA Wallops.
The P-3 aircraft at NASA Wallops on February 3 before a science flight. Credit: Vidal Salazar

IMPACTS is the first comprehensive study of snowstorms in the Northeastern United States in 30 years. The campaign combines satellite data, ground-based radars, weather balloon launches, computer simulations, and airborne instruments to understand snowstorms. The goal is to develop greater comprehension of winter storm formation and development by using several instruments that examine the microphysical characteristics of snow particles at various temperatures and altitudes. The data collected during the multi-year IMPACTS campaign can help advance the future of snowstorm forecasting and predictions.

“If we understand the microphysics of the clouds, what we’re seeing, when we’re seeing them, and how we’re seeing them, it gives scientists in other disciplines a better understanding of what they’re studying,” said Nairy. The IMPACTS experiments will provide robust datasets about winter snowstorms for scientists to analyze and incorporate into their own research.   

Nairy and Moore have spent the last few months based at NASA’s Wallops Flight Facility in Virginia, spending their days troubleshooting problems and revamping the nine probes that are on each flight. When a storm is in the forecast, it’s go time. They arrive at the hangar to prepare the probes, computers, and flash drives that will accompany their research in the air. An hour before the plane takes off, they board the P-3 and continue prepping the cloud probes.

All but one of the probes hangs off the tips of the plane’s wings, away from the propellers, each having its own job: taking high-definition photos of ice particles, measuring the total amount of water (both in liquid and ice form),  measuring the size of full and partial snow particles, and sampling shattered particles. These data-collecting tools can sample over 30 million particles in a single eight-hour flight alone.


Close-up images of snow particles captured by one of the probes on the P3.
A few of several particle images that the probes captured. Dependent upon the temperature and humidity at which they’re formed, some are “Bullet Rosettes” which are star-patterned, near the top of cold clouds; There are also hexagon-shaped particles, a pencil-shaped particle with hexagons at each side, a conglomeration of “plates” that are connected and more. Photos courtesy of Christian Nairy taken on the PHIPS Instrument.

“The whole point is to measure as much as we can when it comes to particles, concentration, sizes and particle habits,” says Moore. “We want to further our understanding of these storms and why they dump snow over the Northeast.”

Probes hanging off the wing of the plane.
The left wing of the P-3 aircraft. The probes capture data in different ways, some particles entering directly into their openings, some read by lasers, and more. Photo Credit: Christian Nairy
Probes hanging off the wing of the P3.
The right wing of the P-3 aircraft with its probes. Credit: Christian Nairy

Once the plane takes off, the team settles in for eight hours of flying and collecting data. Flying through the clouds isn’t always smooth sailing, though. Sometimes there’s turbulence and sometimes the storm quickly changes from snowflakes one minute to liquid water droplets the next. The transitions are quick, but the technology that captures these changes furthers the researchers’ understanding of how snowstorms work. While much of the flight involves looking at data in real-time, there are downtimes where conversation and collaboration can happen. The team chats with other researchers onboard, cracks jokes, takes notes of what they’re seeing and communicates with the IMPACTS HQ ground team at NASA Wallops.

IMPACTS Principal investigator Lynn McMurdie is on the ground at NASA Wallops as the flights take place. While the planes cruise at 300 mph at various altitudes within the storm, she’s constantly communicating with the teams, directing them to sample certain parts of the storm – like snow bands and when to make in-flight adjustments.

Snow bands are narrow structures in the atmosphere that are created by the storm itself. These banded structures tend to cause heavy snowfall. Not all storms produce these bands, however, and sometimes the bands don’t dump lots of snow, which furthers the importance of understanding just why, how, and when they do or don’t form. 

“We decide where to fly based on forecasts of our storm of interest,” McMurdie shares. “We tend to draw a line or box of where we want to do our sampling, usually going across any banded structures from one side to the other. Going across the snow bands gives us variability in and outside of the band.” 

Sampling snow bands with variability offers researchers’ an improved understanding of how the distribution of snow varies from storm to storm. It’s dependent upon two factors: storm strength and location. There are times when snow bands will drop many inches of snow within a short period of time, but other times when there’s only a light dusting of snow.  Sampling from within and outside of the band, and at different altitudes, helps the team see the whole picture of precipitation and snow production.

Christian Nairy and Jennifer Moore seated at their in-flight computers in the P3 aircraft.
Jennifer Moore (left) and Christian Nairy (right) are seen here operating the monitors and looking at data that their nine cloud probes produce. Photo Courtesy of Christian Nairy.

“The more data we can get, the better we can predict and understand. It’s so important to try and fly in every storm we possibly can,” Moore says. “[The snow storms] can be really impactful, even if it’s an inch or two. You think you understand them, but then you actually get into the science of it. You learn so much more when you’re actually experiencing it.”

As the eight-hour flight prepares to land, Nairy and Moore’s work isn’t done. As soon as the P-3 touches down, the probes are shut off and covered, the data is downloaded to computers, and a post-flight briefing occurs. The two graduate students update and maintain the probes to ensure they’re ready for their next storm-chasing flight. And then it’s time to call it a day.

Up, up and away: Launching Balloons in a Blizzard

by Sofie Bates

Andrew Janiszeski and Troy Zaremba blow up a weather balloon in a dark hotel lobby. The weather was calm last night when they drove into Plymouth, Massachusetts, but this morning a blizzard is raging outside. Snow is piling up in the hotel parking lot, wind gusts are near 70mph, and the power is out – but they have a job to do.

Janiszeski and Zaremba, two graduate students at the University of Illinois at Urbana-Champaign, are one of several teams deployed throughout the northeastern United States to launch weather balloons during the approaching snowstorm. While the teams launch weather balloons from the ground, two NASA aircraft will fly overhead to study the storm from a different vantage. The experiments are part of NASA’s multi-year Investigation of Microphysics and Precipitation for Atlantic Coast-Threatening Storms (IMPACTS) mission, which is the first comprehensive study of snowstorms across the Eastern United States in 30 years. 

Satellite image of snowfall over the northeastern U.S.
The nor’easter dumped snow on the northeastern United States on January 28-29 and brought hurricane force winds and blizzard conditions to some states. Image by NASA Earth Observatory / Lauren Dauphin using MODIS data from NASA’s Aqua satellite.

Janiszeski and Zaremba bundle up and step out into the blizzard to prepare for the first balloon launch of the day. They bury a communications antenna in a snowbank next to their van and attach a small device, called a radiosonde, to the balloon with tape and zip ties. If all goes well, the radiosonde will measure the balloon’s position as well as the temperature, pressure and humidity at different altitudes as the balloon rises into the sky. This data will help the scientists understand the atmospheric conditions of the storm and how they change with altitude.

Andrew Janiszeski prepares to launch a weather balloon in a winter snowstorm.
Andrew Janiszeski prepares to launch a weather balloon near Geneseo, New York on a previous deployment for IMPACTS. Hanging below the weather balloon is the radiosonde, which will collect data as the balloon rises and then parachute back down once the balloon pops. Photo courtesy of Troy Zaremba.

They walk the balloon out of the hotel lobby. Double check that the communications antenna and radiosonde are working. Then they let the balloon go.

“It went fifteen feet up, caught a gust of wind, did a loop, dove down, almost hit a car, rag dolled around a tree, went over a gas station, and popped,” said Janiszeski. They tried again with another balloon. Same thing – pop! Hesitant to sacrifice more balloons to the winds, Janiszeski and Zaremba called the IMPACTS Headquarters team to report that they couldn’t launch.

Snow piles up in the hotel parking lot in Plymouth, Massachusetts where Janiszeski and Zaremba are launching weather balloons. Photo courtesy of Andrew Janiszeski.

Meanwhile at IMPACTS Headquarters, based at NASA’s Wallops Flight Facility located on the eastern shore of Virginia, scientists monitored the weather and coordinated with the various teams on the ground and in the air. Their goal is to fly the two aircraft – the ER-2 aircraft that flies above the storm clouds and the P-3 aircraft that flies within them – in a stacked formation, one above the other, providing a look at the storm from different perspectives. The team also plans the flights so that the aircraft pass over the teams launching weather balloons and the teams using ground-based radars. 

“We’re trying to coordinate all of the equipment to get a nice cross section of the storm. But the storm doesn’t sit still for us, so sometimes we have to adjust our plans,” said Bob Rauber, Director of School of Earth, Society and Environment at the University of Illinois at Urbana-Champaign and one of the assistant flight planners for IMPACTS. There are a lot of factors to consider, though: clearance from the Federal Aviation Administration (FAA), weather forecasts, where the storm is moving and points of interest in its path, and last-minute changes for the aircraft and ground teams – including problematic weather balloon launches.

The NASA P-3 Orion aircraft preparing to take off from NASA’s Wallops Flight Facility.
The NASA P-3 Orion aircraft preparing to take off from NASA’s Wallops Flight Facility. Photo courtesy of Andrien Liem.

By early afternoon the winds had subsided to around 40 mile per hour gusts at the balloon launch site in Plymouth, said Janiszeski, so he and Zaremba decided to attempt another launch. They tied the radiosonde to the weather balloon, adding extra zip ties and duct tape for good measure. Then they walked it out of the hotel lobby, took a breath, and let it go.

As soon as it was released, the balloon was taken by the wind. It flipped once, twice, three times, and Janiszeski’s hope plummeted. But then the balloon righted itself and kept rising, and rising, until it was impossible to see. 

“It was a miracle,” said Janiszeski. “I really thought we were going to get a whopping zero balloons up at the beginning of the day.” But from there on out, the balloon launches were largely successful, he said. The duo got five successful balloon launches before the storm moved away from Plymouth. 

“This was, without the remotest doubt, the most severe conditions we’ve experienced during IMPACTS,” said Janiszeski. “I was getting a little pessimistic, but five radiosondes in a storm like that… We’ll take it as a win.” 

Mission (almost) Impossible: SHARC

Part of the SHARC team–including members from MARS (Mobile Aerospace Reconnaissance Systems), JAXA, SCIFLI, RSD and ESPO – in front of a NASA Gulfstream, G-III, aircraft at Adelaide Airport, South Australia, in the early morning hours following the team’s overnight dress rehearsal flights.

Richard von Riesen, Ron Dantowitz, Michael Legato, Brent Johnson, Joe Sanchez, Jr., David Zimmermann, Christian Lockwood, Nick Newman, Satoshi Nomura, Mac O’Conor, Hideyuki Tanno, David Hudson, Shunsuke Noguchi, Brian Lula, Yiannis Karavas, James Scott, Carey Scott, Jr., Rob Conn, Jennifer Inman, Zev Hoover, John Bombaro, Jr., Jhony Zavaleta, Caitlin Murphy. Not pictured: Bill Ehrenstrom, Kurt Blankenship, Katelyn Gunderson, Johnny Scott, Jr., David Fuller, Taylor Thorson, Matt Elder, Kevin Shelton, Rob White, Ken Cissel. Credit: NASA

By Katrina Wesencraft

As project manager for NASA’s Scientifically Calibrated In-flight Imagery (SCIFLI) group, Dr. Jennifer Inman is used to managing complicated logistics and solving problems ahead of her team’s deployments. Someone needs a new laptop? No problem. A research plane needs new window panels? OK!

The SCIFLI team – which specializes in in-flight imaging – collects data used to predict the aerodynamics of spacecraft launches, flights, parachute deployments, and atmospheric re-entries. In November 2020, they were due to put their skills to work in Australia, observing JAXA’s Hayabusa2 sample return capsule, with pieces of asteroid Ryugu on board. The international mission was called the SCIFLI Hayabusa2 Airborne Re-entry Observation Campaign, or SHARC.

Dr. Inman’s team would image the return capsule – one of the fastest human-made objects to ever fly through Earth’s atmosphere – while flying high above the landing site, Woomera in South Australia, nearly 300 miles north of Adelaide. It was her responsibility to get the SCIFLY team, and all their scientific instruments, to the site.

But the COVID-19 pandemic has a way of putting a wrench into even the most meticulous plans. As countries closed their borders and travel came to a screeching halt, Dr. Inman found herself in a tangled web of changing regulations both at home in the U.S. and abroad.

“It was like Whac-A-Mole, solving one problem at a time,” she said. “And the bad days were days where moles that I’d already whacked, popped their heads back up.”

The SHARC team selected an airliner-style plane, the NASA DC-8 based out of Armstrong Flight Research Center, to carry out their observations. But there was a major problem – the DC-8 was due to have an engine replaced before their trip. However, the maintenance facility was shut down because of the pandemic. The aircraft wasn’t going to be ready in time for the mission.

“We ended up scrambling. And where we settled was that we were going to use two of NASA’s Gulfstream III aircrafts,” Inman said. “But it meant we had to redo everything. All of our plans, all the engineering and analysis.”

The Gulfstream III is much smaller than the DC-8. The gimbals – specially engineered mounts used to secure scientific instruments in the aircraft – didn’t fit the smaller cabins and had to be completely redesigned and rebuilt. The mission computers were also too big. Dr. Inman had to order NASA-approved laptops – a relatively small purchase, but one that can take months to be approved.

Making matters worse, the scientific instruments used to observe the sample return capsule couldn’t ‘see’ through the Gulfstream III jets’ windows – no UV light could pass through them, and their multiple panes would have resulted in images with multiple reflections.

“We ended up borrowing some aircraft windows and window frames, like the actual hardware that got epoxied into the airframes,” said Inman. “We borrowed those from Armstrong, some of them, and had to fabricate additional windows and frames using Armstrong’s design.”

SHARC scientists Ron Dantowitz (left) and Zev Hoover (right) of MARS, Scientific, Inc., prepare an optical window for integration with one of the NASA Gulfstream G-III aircraft prior to deployment to South Australia. Credit: NASA

Pandemic restrictions were difficult for collaborators from Japan, too. During normal times, JAXA colleagues would have come to the U.S. to integrate their scientific instruments into the aircraft and perform system checks on their equipment. They ended up having to ship their equipment to Johnson Space Center, in Houston, where they entrusted a NASA team with those tasks. The next time JAXA scientists got to see their equipment again would be in Australia.

And all of this happened before even leaving the U.S. Getting the research planes and essential personnel to Australia in time for the mission were also huge hurdles.

In addition to visa requirements, the team needed special authorization to enter Australia and to travel across internal, police-controlled borders. The rapidly changing situation meant that travel regulations weren’t well-defined, particularly for the NASA aircraft that needed to make several international fuel stops along their route to Australia. Initially, the team didn’t know what types of COVID-19 tests would be accepted or where they could obtain them.

Jhony Zavaleta, mission support specialist from the Ames Earth Science Project Office (ESPO) was concerned that the team wouldn’t be able to provide their test results within a set time frame. “Some of our guys were getting tests, and sometimes it would be 48 hours or maybe a week until results came back,” he said. “There was a lot of uncertainty.”

NASA Ames’ ESPO (Earth Science Project Office) team, Caitlin Murphy and Jhony Zavaleta, welcome N992NA, one of the two Gulfstream G-III mission aircraft, upon its arrival from Johnson Space Center to Adelaide, South Australia. This aircraft carried several imaging instruments from JAXA and NASA. Credit: NASA

For the personnel not traveling on the NASA planes, getting to Australia wasn’t any easier. The team faced the prospect of a 42-hour journey, via Qatar, where there were more requirements to provide negative tests and additional documentation. There were also very few flights scheduled – and many of those were being canceled.

As the clock ran down, the team was running out of options. Zavaleta had to charter an aircraft to carry the key personnel to Australia.

Dr. Jay Grinstead, SHARC’s principal investigator from NASA Ames, was impressed by the last-minute efforts: “People were really interested in seeing this mission succeed. So they made concessions and made funding available.”

The team conducts a final pre-flight briefing just prior to the observation flight. From left to right: Joe Sanchez, Jr., Caitlin Murphy, Michael Legato, Katelyn Gunderson, Jennifer Inman, Brent Johnson, Hideyuki Tanno, Carey Scott, Jr. Credit: NASA

Zavaleta and a colleague from ESPO made it to Australia ten days early to allow them to set up ahead of the full team’s arrival. “Nobody from our team had been to Australia before to plan,” he said. “We didn’t know what the situation on the ground was.”

Normally, key details like where to buy supplies and the team’s transportation would be sorted six months in advance. But now, the team didn’t know what restrictions would be in place by the time they arrived, who would be supporting them, or even what hangars their planes would be in. The instruments also needed to be calibrated, and Zavaleta had to make sure the hangar operators were aware of the team’s needs and willing to work off-hours. It was an incredibly tight turnaround.

Despite the numerous setbacks, the mission was a huge success, largely due to the collaboration between Dr. Inman’s team, the aircraft organizations at both Langley Research Center and Johnson Space Center, ESPO, NASA Headquarters, JAXA, the Australian Space Agency, and other Australian officials. Dr.Grinstead said, “We really could not have pulled this off without our international partners.”


Preparing for Landing: NASA’s S-MODE Wraps up Last Week of Experiments

By Dragana Perkovic-Martin, Principal Investigator for DopplerScatt at NASA’s Jet Propulsion Laboratory // SOUTHERN CALIFORNIA //

11/02/21

Yesterday was a hard down day for the team – everyone needed a rest after a very active week before. The hard down days are in NASA airborne rules and ensure that fatigue does not set in and keep everyone’s safety  the top priority.

The NASA King Air B200 and the early morning fog at NASA Ames Research Center.
Spooky! NASA King Air B200 and the early morning fog at NASA Ames Research Center. Photo credit: Alex Wineteer / NASA JPL

To fly or not to fly … Today is supposed to be a good day for optical measurements but the pesky fog is really not willing to leave the area of S-MODE operations. We sit and wait for updates from the ship, satellite imagery and forecasts. In the meantime, we are using the Saildrone measurements of wind speed in the area of interest to determine if it’s worthwhile to operate DopplerScatt. The winds are very low. The hourly reports are telling us that the winds have been below DopplerScatt’s threshold for the whole morning, reporting wind speeds of one meter per second. At this wind speed the ocean surface is very still, so still that it may look like a mirror. This is bad news for radar signals bouncing off the surface as their strength depends on the surface roughness. No dice for DopplerScatt today, and the same decision was made for the MOSES and MASS instruments on the Twin Otter. 

11/03/21

Remember that pesky problem with the monitor from last week? I overnighted a replacement monitor for the DopplerScatt team since yesterday was a doozy with no flights, they decided to swap out the monitor and keyboard on the plane. Trouble is they did not test that it worked. We just thought, “well what could go wrong, it’s the same model.” What do you know, it did go wrong! I’ll spare you the details and the frantic messaging between myself and the operators, but after some time they realized that the power cable was not plugged in and the monitor was not getting power. All in a day of DopplerScatt deployments!

Crew in front of the NASA King Air B200.
Crew of the day from left to right: Karthik Srinivasan (JPL DopplerScatt operator), Hernan Posada (AFRC pilot), Jeroen Molemaker (UCLA MOSES operator), James Less (AFRC pilot). Photo credit: Alex Wineteer / NASA JPL

11/04/21

Today is a science extravaganza! We have a big day ahead of us with two NASA King Air B200 flights planned and all of the in-water assets sampling data throughout the day. The weather is finally cooperating and we have a clear yet windy day ahead of us. The plan today is to fly a morning flight – which just took off at 8am – and then another one leaving approximately 6 hours later and flying the exact same pattern. The comparison of data between the two will tell us about the daily variability of the ocean processes. 

“This is one of the reasons why I am so excited about S-MODE,” said Hector Torres, DopplerScatt team member, operator and one of the main people responsible for simulating ocean processes. “The results based on theory and numerical simulations produced in the last five years are about to get confirmed or debunked today. Either way it will be a breakthrough!”

Flight one is now done! There were some pesky low clouds right in the area of collection that prevented MOSES from collecting quality data for half of the flight, but the second half was great. DopplerScatt data collection went as planned and data are churning already! We are seeing the first quick look data products trickle in as we watch the afternoon flight take off.

While the first flight was a bit difficult for our optical colleague running the MOSES system, Jeroen Molemaker from the University of California, Los Angeles, the afternoon was gloriously clear and provided a great opportunity for all airborne instruments to collect data at the same time. 

Quick look composite image of the sea surface temperature as observed by the MOSES instrument on the November 4, 2021 afternoon flight. The tracks are overlaid on DopplerScatt derived surface current velocities from the morning flight, showing the spatial relationship between currents and density fields. The color scale blue to red has a range of 2°C. Credit: NASA’s S-MODE team / Jeroen Molemaker

Today the S-MODE pilot experiment operated as we envisioned many months ago, with all platforms sampling data throughout the day over the area of interest. The field experiment crew is  tired but happy and the team is excited about the science that we will extract from this data set.

Goodnight moon. NASA King Air B200 on arrival at Moffett Field, California after a long day of flights. Photo credit: Alex Wineteer / NASA Jet Propulsion Laboratory

11/05/21

Today is the final day of the S-MODE pilot campaign. It’s a bittersweet feeling for me as it was so much fun to collaborate and coordinate daily activities with so many people. I will miss that, but I certainly will not miss the hectic calls of “we have a problem with …”

The NASA King Air B200 will fly in the afternoon collecting data in the western region of the S-MODE study area  together with the Twin Otter aircraft. Meanwhile, our friends on the ship will start recovering the autonomous assets and make their way toward Newport, Oregon.

Trouble struck again as our GPS unit could not get itself aligned and produce a good navigation solution, requiring a power reset and making S-turns i.e. banking the aircraft left and right in succession. After this excitement things went smoothly for the rest of the flight. You never know what will go wrong during a field deployment, you just know that something will and you need to be prepared to react and fix things without letting the panic set in! Thankfully that is what happened today thanks to Alex Winteer, a DopplerScatt operator from NASA JPL. He performed a cool and collected power reset while in air!

Happy crew on their last flight of the S-MODE pilot campaign. On the left is Jeroen Molemaker (UCLA MOSES operator) and on the right is Alex Wineteer (JPL DopplerScatt operator). Photo credit: Karthik Srinivasan / NASA JPL

Now it is time to work on our post-deployment to do list and eagerly await results of data processing.

I will leave you with two short blurbs from DopplerScatt team members Alex and Karthik about their impressions of the pilot campaign. 

“On most days, you don’t wake up looking forward to a boring day. As an instrument operator, a boring day during a deployment, however, is a different story. You look forward to sitting in a small round aluminum tube for 4.5 hours with nothing to do. That is a perfect day – a day when the radar just works. No last minute excitement of monitors not turning on (because someone unplugged it and forgot to plug it back in!) or the satellite phone connection not working. While the entire science team is excited about an action-packed day of coincident data collection, all the instrument operators look forward to is a day where everything just works as it should! Of course, sitting in an aluminum tube for many hours, staring out at the ocean with nothing to do makes you yearn for some excitement, but that is a fleeting thought until you get a text message via satellite link asking you to pay attention to the speed of the aircraft!” 

– Karthik Srinivasan, NASA JPL DopplerScatt operator


“I’ve been on quite a few field deployments with DopplerScatt, but none quite as exciting – or as important—as this one. Indeed, such a coordinated effort consisting of multiple aircraft and many assets in the water has never been attempted, and the resulting science will lead to new understanding of our ocean, atmosphere and the climate system as a whole. On Thursday, we attempted two flights for the first time. I operated the first flight: crew brief at 6:30 AM with a takeoff time of 8 AM. Thankfully, our instrument operated normally, and we were able to fly a bit lower –under the clouds – to ensure MOSES could see the ocean surface with its infrared camera. We landed five hours later, at around 1 PM, and I immediately took our data back to our field processing center in the aircraft hangar to start crunching. In the meantime, Karthik took off for our second flight of the day. By the time I finished the first round of processing, it was 5 PM and Karthik was almost back from the second flight, so I went downstairs to welcome him back (and grab the data!). A few hours later, we had both flights processed to quick look data products and I was exhausted. Being just one person, a small part of a much larger mission, it can be easy to lose sight of why we do this, especially when the hours are long. But when the data started pouring in, my exhaustion was quickly replaced by excitement. We were seeing a dataset no one had ever seen before. With these two flights, we are able to not just see the sub-mesoscale structure of the ocean surface over a large area, but we could also see its evolution over time and how the atmosphere interacts with that evolution! There is much work to go in analyzing these data, especially in comparing the many other instruments to our DopplerScatt measurements, but I am grateful to play a part in that analysis, discovery and understanding.”

– Alex Wineteer, NASA JPL DopplerScatt operator

The (Virtual) Room Where it Happens: Inside NASA S-MODE’s Control Center

By Alison Gold // NASA GODDARD SPACE FLIGHT CENTER, MARYLAND //

NASA’s Sub-Mesoscale Ocean Dynamics Experiment (S-MODE) relies on two aircraft, 17 remote-controlled vehicles, a ship and dozens of drifting instruments to make its detailed study of ocean eddies, currents and whirlpools. The researchers aim to assess how these small, high-energy ocean events contribute to circulation and heat exchange in the upper ocean, and how oceans affect climate change. The tools are stationed in a 7,800 square mile (roughly 20,200 square km) area west of San Francisco Bay, which the researchers call the “S-MODE Polygon.”

But one of the mission’s most critical tools, its control center, is not on site. The control center is a virtual daily meeting where up to 40 scientists gather to share new data, check in on the mission’s assets and plan where to maneuver their instruments and vehicles to capture the most useful measurements.

Map of the S-MODE study area, or "S-MODE polygon",  off the coast of San Francisco.
The S-MODE Polygon, where the mission’s instruments are stationed, is located off the coast of San Francisco. Credit: Cesar Rocha / University of Connecticut

The S-MODE researchers are studying sub-mesoscale ocean processes like eddies – swirling pockets of ocean water that stretch about 6.2 miles or 10 kilometers in distance and often last for only a few days. Because eddies are relatively small and quick-fading, they can be challenging to study. Opportunities to study these processes often spring up with little warning. To study these events, the S-MODE team needs to be able to move their vehicles around quickly and strategically within the polygon.

For instance, one of the airborne instruments may spot an eddie or whirlpool developing. The scientists may then decide which water measurements they would like to gather, and agree to send the appropriate mission vehicles out to the location of interest. The scientists discuss such decisions at control center meetings.

During the call, representatives for each of the assets begin by providing their status updates.

“First, we review the data our assets are seeing in the field that day or the day before, and then decide what is the interesting feature that we want to study,” said Dragana Perkovic-Martin, principal investigator for DopplerScatt, one of S-MODE’s airborne instruments, at NASA’s Jet Propulsion Laboratory. “Based on that decision, we determine which assets we need in that spot and position them in the right area.” 

A screengrab of scientists during a virtual control center meeting.
Scientists participate in a control center meeting on October 22.

The control center was originally going to be hosted in-person at the NASA Ames Research Center in Silicon Valley, California.

“The idea was for a group of us to work together there to examine the conditions and the data and to update the plan as things unfolded,” said Tom Farrar, S-MODE Principal Investigator and a scientist at Woods Hole Oceanographic Institution in Falmouth, Massachusetts. As COVID-19 cases surged in late summer 2021, the team decided to shift to a virtual format. Now, the only people who are in the field are those who cannot complete their work remotely, like those flying the planes or collecting measurements aboard the ship.

All of the scientists involved in S-MODE have done traditional field deployments before, Perkovic-Martin said. But few have had experience coordinating an expedition from a virtual control center. The group has adapted quickly with the help of online platforms including Slack, WebEx, email, and Zoom.

“The control center works in much the same way as originally envisioned, with a group of people trying to take in as much information about what is happening to make decisions about the plan,” Farrar said. 

One of the S-MODE Deputy Principal Investigators, Professor Eric D’Asaro of the University of Washington, leads control center meetings, with the goal of ending each meeting with an updated plan for the next few days.

“We have benefitted a lot from Eric’s enthusiasm, and his experience in other large field campaigns,” Farrar said. “We have a great team of experts and specialists, and I’m really excited about the coordinated dataset the team is collecting.”


On the Edge of Something New: Studying the Sea with a Fleet of Technologies

By Nick Pizzo // OFF THE COAST OF CALIFORNIA //

The October deployment of NASA’s Sub-Mesoscale Ocean Dynamics Experiment (S-MODE) mission is underway and a current of excitement has filled the halls of our virtual meetings. Over the past two years, more than 50 members of the S-MODE project have been meeting virtually to prepare for this moment. Our campaign has begun and we are testing our instruments, optimizing our sampling patterns and comparing our measurements between various instruments over a nearly three-week pilot experiment. The mission for S-MODE is ambitious: we seek to better measure, understand and ultimately model submesoscale currents, which are ocean fronts, narrow currents called jets, and filaments that are about 300 feet (100 meters) to 6.2 miles (10 kilometers). These are elusive targets for oceanographers as they are difficult to measure: too big for a ship-based study alone, too quick for ship surveys, and too small for remote sensing. Therefore, these currents must be examined using a combination of different approaches and novel technologies, as is being done in our experiment. 

View of the R/V Oceanus ship taken from the Twin Otter aircraft.
View of R/V Oceanus from the Twin Otter aircraft with the SIO MASS package on board. Credit: Nick Statom / Scripps Institution of Oceanography

To researchers with the NASA S-MODE mission, it feels like we are near the edge of something new – that it is a time of rapid change in our understanding of the ocean. Sub-mesoscale currents pull apart and push together water at the ocean surface, and this leads to water flowing up and down, respectively. This up and down motion is important for a number of Earth science processes, including interactions of the air and sea that impact weather and processes that affect the distribution of nutrients that are important for plankton productivity. 

Autonomous vehicles called Wave Gliders on the deck of the R/V Oceanus ship.
Wave Gliders on the deck of the R/V Oceanus being prepared for deployment. Credit: Courtesy of Ben Hodges / Woods Hole Oceanographic Institution(WHOI)

I am part of a team that is deploying Wave Gliders, a small uncrewed vessel that has a set of fins on a submersible platform tethered to a surface float, which it uses to kick its way around the upper ocean. These platforms are decked out with instruments and are not limited by interference from the ship. They also do not have the same risk as putting humans out in the middle of large storms (like ones we have experienced during S-MODE!). 

On the transit from Newport, Oregon to the experiment site off the coast of San Francisco, large waves (some reaching around 23 feet or 7 meters tall) rolled over the deck of the research vessel Oceanus and three of the four Wave Gliders were damaged in the process. Researchers in the Air-Sea Interaction Laboratory at Scripps Institution of Oceanography and a team at Woods Hole Oceanographic Institution began to problem solve issues with the Wave Gliders by inspecting extra platforms that were on land here in San Diego, California and diagnosing the issues based on pictures provided by the team on the R/V Oceanus. Scientists from across the country then assembled to repair the Wave gliders in San Francisco harbor.

Scientists perform emergency repairs on the Wave Gliders.
Ben Hodges, Emerson Hasbrouck, Luc Lenain and Laurent Grare (not shown) perform emergency repairs to the Wave Gliders! Credit: Courtesy of Laurent Grare / Scripps Institute of Oceanography

With the Wave Gliders repaired and deployed, we could again pursue our mission objectives. There was still considerable swell in the water from a historically large storm that had just passed through the region (which was accompanied by the well-publicized atmospheric river that brought so much rain and snow to northern California). In fact, the Saildrones in our campaign measured large significant wave heights during this storm! After the major storms passed, the Wave Gliders were deployed, and they are currently operating in unison with the other instruments in the campaign. The data has started to roll in!

I and several others in the campaign am interested in how surface waves interact with sub-mesoscale current features. For example, as waves turn as they approach the beach to be parallel to shore, sub-mesoscale currents steer the waves, sometimes leading to wave breaking in localized regions. These breaking waves are important for upper ocean dynamics and air-sea interactions: they generate spray and bubbles that are important for gas transfer between the atmosphere and ocean.  Historically, wave data has been viewed as measurement noise. But, with the emerging technologies being employed in S-MODE, scientists are excited about the possibility that wave information can tell us about the underlying currents.


Figure showing measurements from the Sail Drones of the significant wave heights.
Measurements from the Sail Drones of the significant wave heights. Figure courtesy of Bia Villas Boas / Caltech / Colorado School of Mines

For many of us, this experiment has been invigorating, bringing us back in touch with the excitement and discovery that comes with oceanographic field campaigns. There have been many excited conversations around a monitor, examining the data as it comes into our stations on shore. As an early career scientist, I feel as if I am taking part in a historical campaign. This is truly an exciting time to be an oceanographer.  

Researchers Kayli Matsuyoshi, Luke Colosi and Luc Lenain in the Air-Sea Interaction Laboratory at SIO discussing the latest S-MODE findings.
Researchers Kayli Matsuyoshi, Luke Colosi and Luc Lenain in the Air-Sea Interaction Laboratory at SIO discussing the latest S-MODE findings. Credit: Courtesy of Nick Pizzo