Collecting Fingerprints in the Sky

by Denise Lineberry / HAMPTON, VA. /

This NASA airborne science experiment that started flights over the eastern United States this month resembles a classic case of “who done it?” ACT-America, the Atmospheric Carbon and Transport – America expedition, is studying the movement of two powerful greenhouse gases — carbon dioxide and methane.

It was hot and humid in the Mid-Atlantic region as the first set of science flights began in mid-July. The scene on July 18 was the hangar at NASA’s Langley Research Center in Hampton, Va. The lineup of potential suspects included gases from plants, fossil fuels, air conditioning units and electrical transformers.
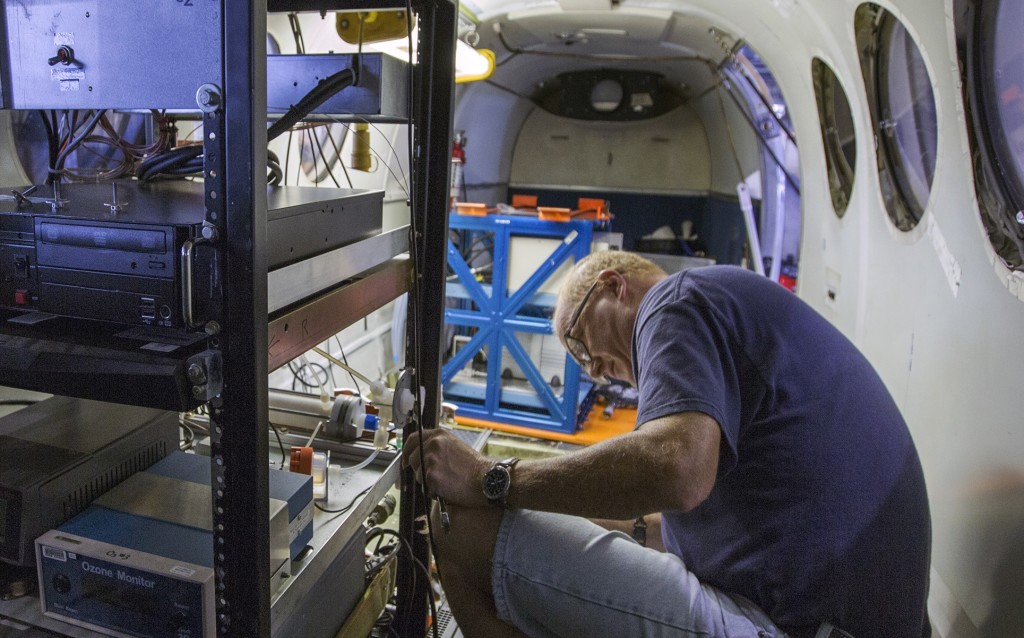
Technician Jim Plant gets the ACT-America science instruments ready onboard NASA’s B-200 aircraft.

Inlets built into several sensors on the belly of NASA’s B-200 aircraft take in samples of the air and atmospheric gas with the push of a button once the flight was underway. The sensors are strategically placed to not take in any exhaust from the aircraft.
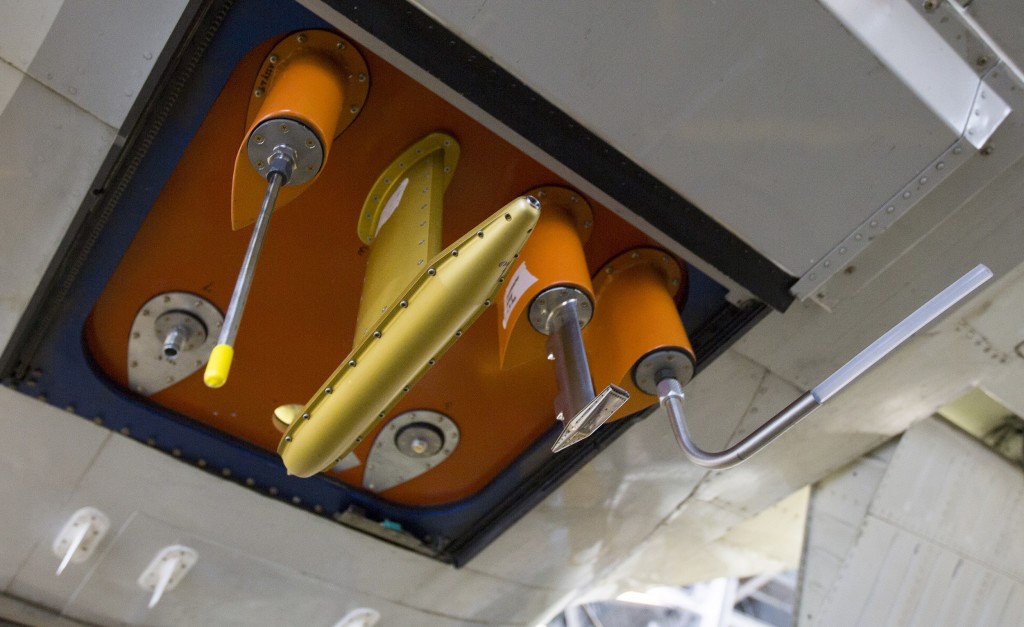
Inlets on the belly of the NASA B-200 collect samples of carbon and methane during flight.

For ACT-America’s first B-200 science flight, Colm Sweeney from the National Oceanic and Atmospheric Administration (NOAA) at Colorado State University watched from the hangar as the B-200 prepared for takeoff with NOAA’s flask package onboard. Air samples that fill the flasks are atmospheric fingerprints that provide clues about where individual chemical compounds came from.

“Plants take up lighter carbon, and emitted carbon has a different ratio,” Sweeney explained.

Gases have certain tracers, such as SF6 used in electrical transformers, and those tracers stay with them as they rise into the atmosphere as a plume.

“We’re basically getting a fingerprint on where the plumes are coming from,” Sweeney said.

Jim Plant was the lone instrument operator aboard the aircraft, accompanied by science instruments, a pilot and co-pilot to minimize the weight on board for a longer duration flight. The B-200 met up in a predetermined area or “box” along with the larger, more instrumented NASA C-130 aircraft that took off from NASA’s Wallops Flight Facility along the Virginia coast.
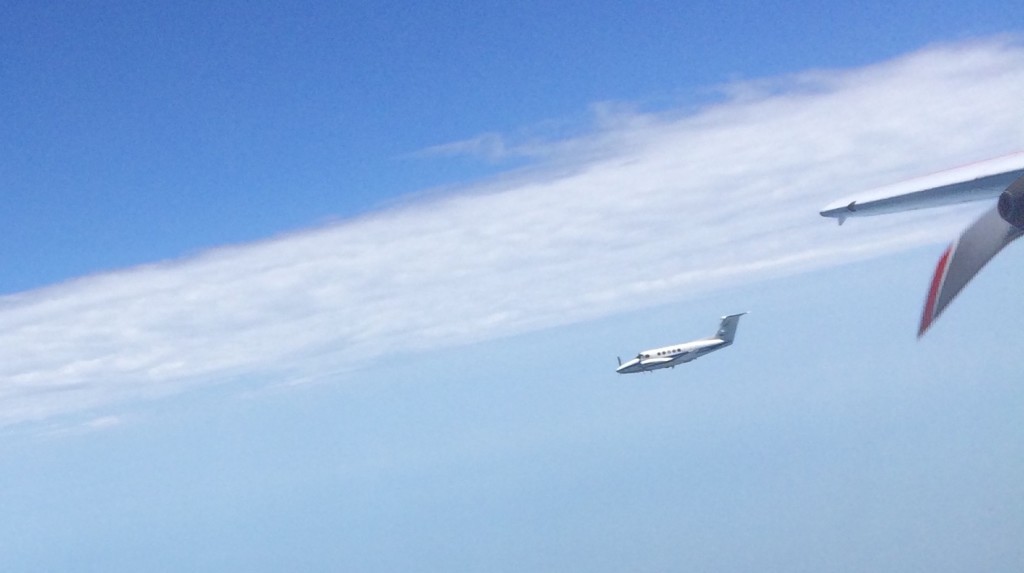
The B-200 meets up with the C-130 aircraft in coordinated flights over the Mid-Atlantic region this month.

The B-200 made lawnmower patterns inside the box and circled down through layers of the Mid-Atlantic atmosphere to study how carbon dioxide and methane cycle into and out of the atmosphere.

“We want to better understand what’s going on inside the box to later extrapolate what’s going on outside of the box,” said Byron Meadows, ACT-America’s aircraft instrument manager.

With the push of a button onboard, a sample of air and gas fills the flask package, which is closed off from outside exposure. Once the dozen flasks are filled, the monitor reads, “Have a nice day.”
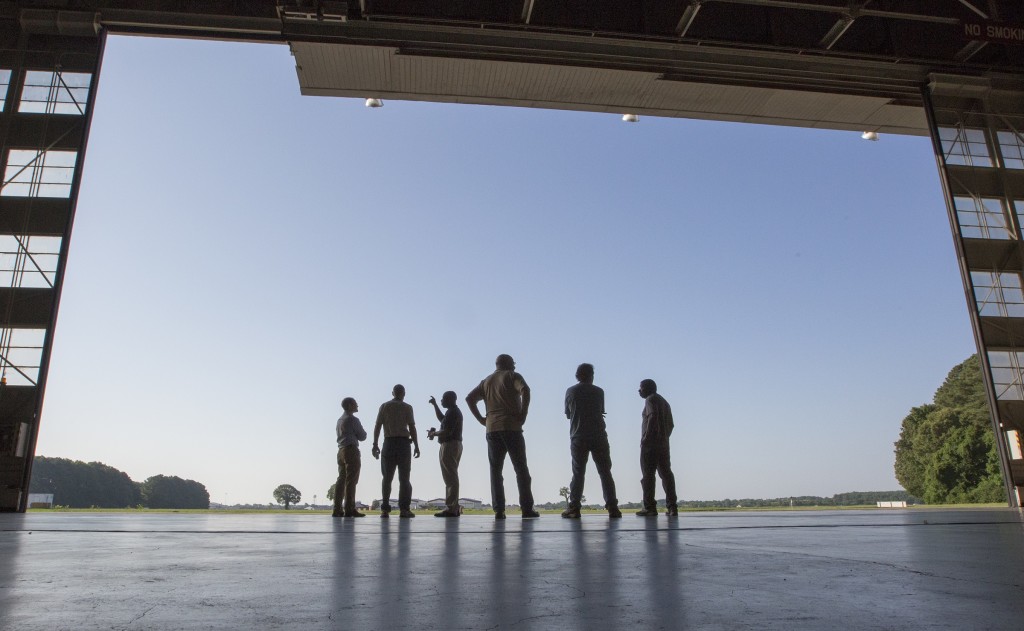
ACT-America team members discuss final preparations before the start of the Mid-Atlantic portion of the month-long flight campaign.

After the flights, the samples are sent back to a lab at Colorado State University where they are analyzed. The final step, according to Sweeney, is to model the samples to determine if carbon and methane emissions are increasing or decreasing.

“If we plan to curb emissions, we have to be able to check the accuracy of them and inform the proper policies needed to make a difference,” Sweeney said.

In addition to the flask system that collects samples from the air, several other instruments are integrated into the B-200 to study carbon and methane. Several ground measurement sites complement and fill in gaps between the study regions

This case is far from closed. In August ACT-America continues its sky sleuthing over two other parts of the eastern U.S. with flights from Lincoln, Nebraska, and Shreveport, Louisiana. With each passing flight, the data collected provides scientists with new clues that will help improve diagnoses of the global carbon cycle for decades to come.

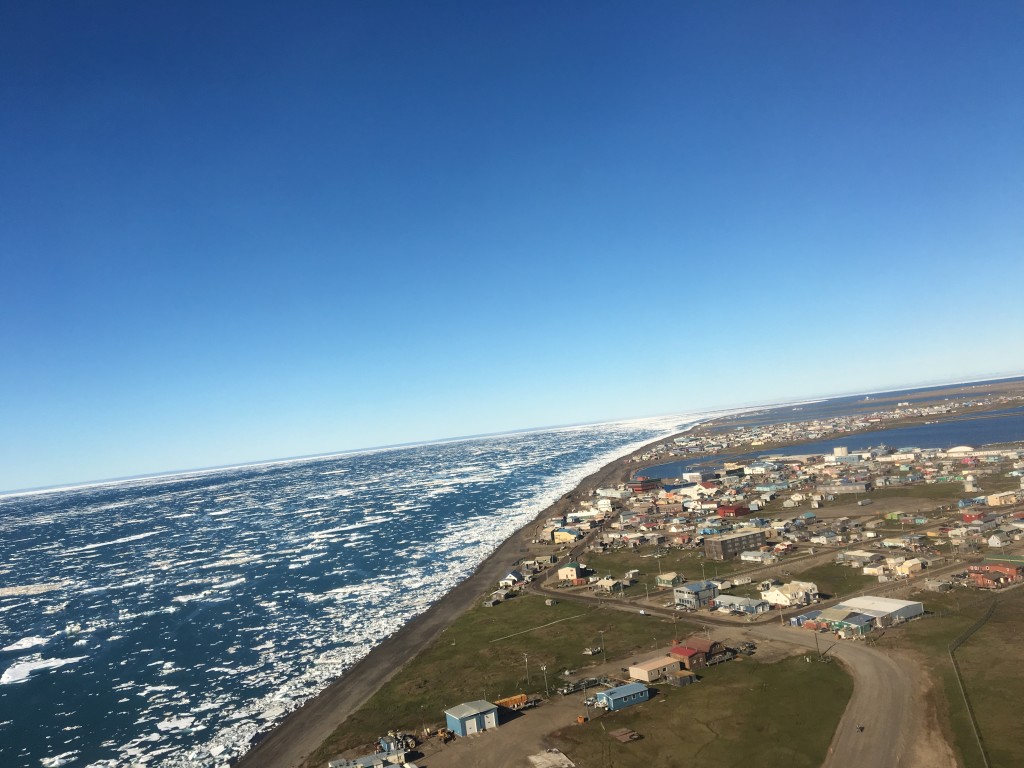


Exploring Barrow with Operation IceBridge


Taking off from the Wiley Post-Will Rogers Memorial Airport provides a view of Barrow and the neighboring Chukchi Sea, at 71° N latitude. Credit: NASA/Kate Ramsayer

by Kate Ramsayer / BARROW, ALASKA /

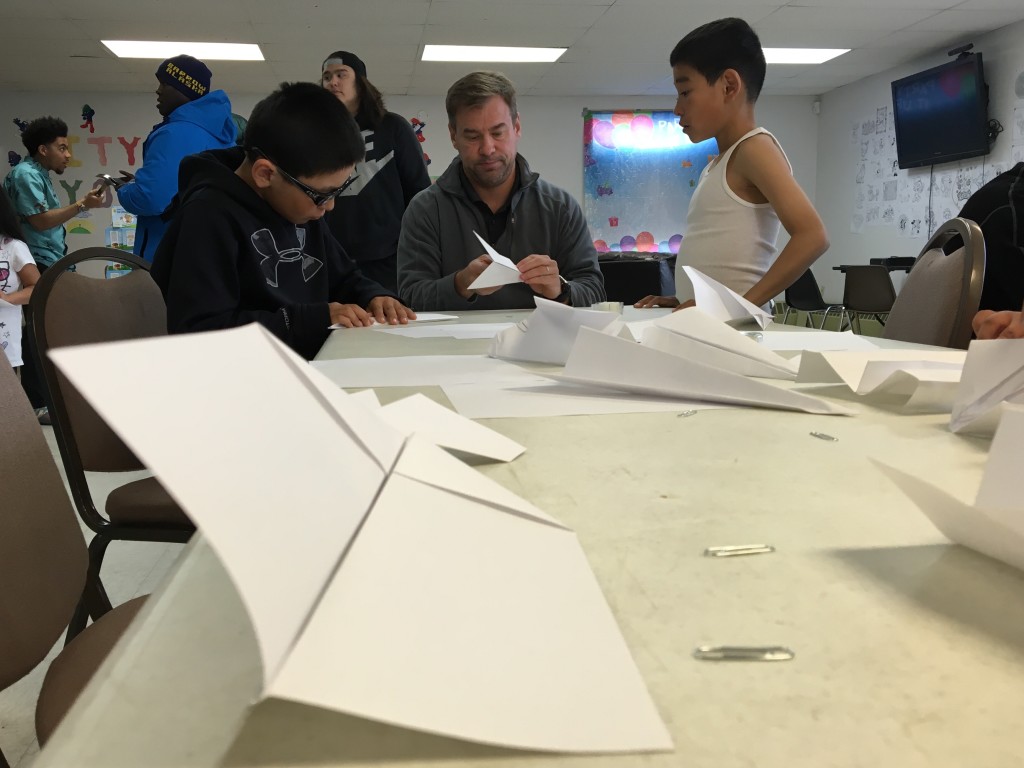
A cloudy day in the middle of Operation IceBridge’s summer campaign in Barrow, Alaska, meant no flights that day, so instead several members of the campaign showed local kids how to build and fly NASA-quality paper airplanes.

“This is what an engineer does, see what works and what doesn’t,” pilot Rick Yasky told one elementary-age summer camper.

Children learning how to make paper planes
Pilot Taylor Thorson, of NASA’s Langley Research Center in Virginia, shows Barrow kids how to design different kinds of paper airplanes. “There’s no right or wrong way to do it, we’ll just try to make it fly” he said. Credit: NASA/Kate Ramsayer

The campaign, which measured melting sea ice in the Arctic, was the first IceBridge mission out of Barrow, so while in town the 11 scientists, pilots and flight crew explored the local science, culture and community.

One of the flight crew was walking along the beach when he came across fishermen pulling in a line of salmon—he helped, and walked back to the hotel with enough fish to eat for the rest of the campaign. Another chatted with local women who were removing reindeer tendons, which would dry out until the fall when the women would braid them together to use in sewing.

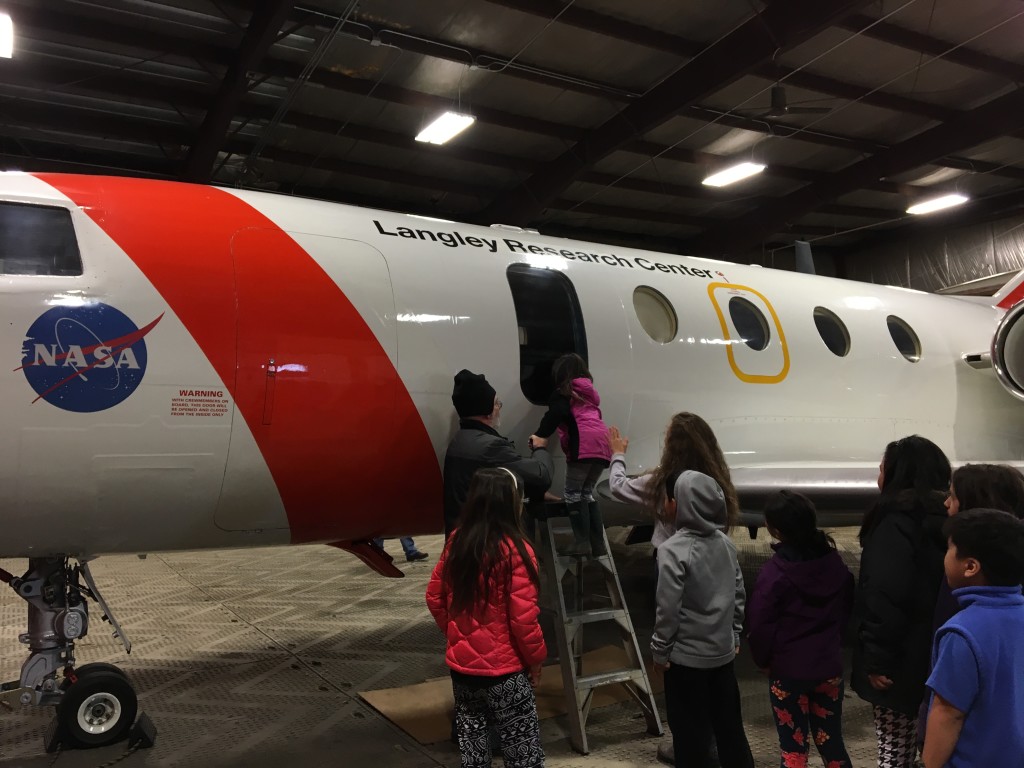
And in the middle of the campaign, they helped at a summer camp by making birdhouses, holding a paper airplane contest and showing the campers the NASA Falcon jet out of Langley Research Center in Virginia.

John Woods, Operation IceBridge project manager with NASA’s Goddard Space Flight Center in Greenbelt, Maryland, explains the rules of a paper airplane contest to day campers at a Barrow summer program. There were two categories – farthest distance, and longest aloft. Credit: NASA/Kate Ramsayer
John Woods, Operation IceBridge project manager with NASA’s Goddard Space Flight Center in Greenbelt, Maryland, explains the rules of a paper airplane contest to day campers at a Barrow summer program. There were two categories: farthest distance and longest aloft. Credit: NASA/Kate Ramsayer
Barrow day campers check out NASA’s Falcon jet, which IceBridge flew for its summer sea ice campaign. Credit: NASA/Kate Ramsayer

“When anyone comes up, we like to have them visit with the kids,” said Chris Battle, Barrow recreation director and deputy mayor. “We’re isolated so it’s good to let them have exposure to these things.”

John Woods, IceBridge project manager, also gave a library talk on how NASA measures sea ice and Arctic health, speaking to whaling captains, scientists, locals and three kids in astronaut suits. Woods and others also talked with local researchers working on the tundra with carbon monitoring stations, weather instruments and more.

Man walking in Barrow.
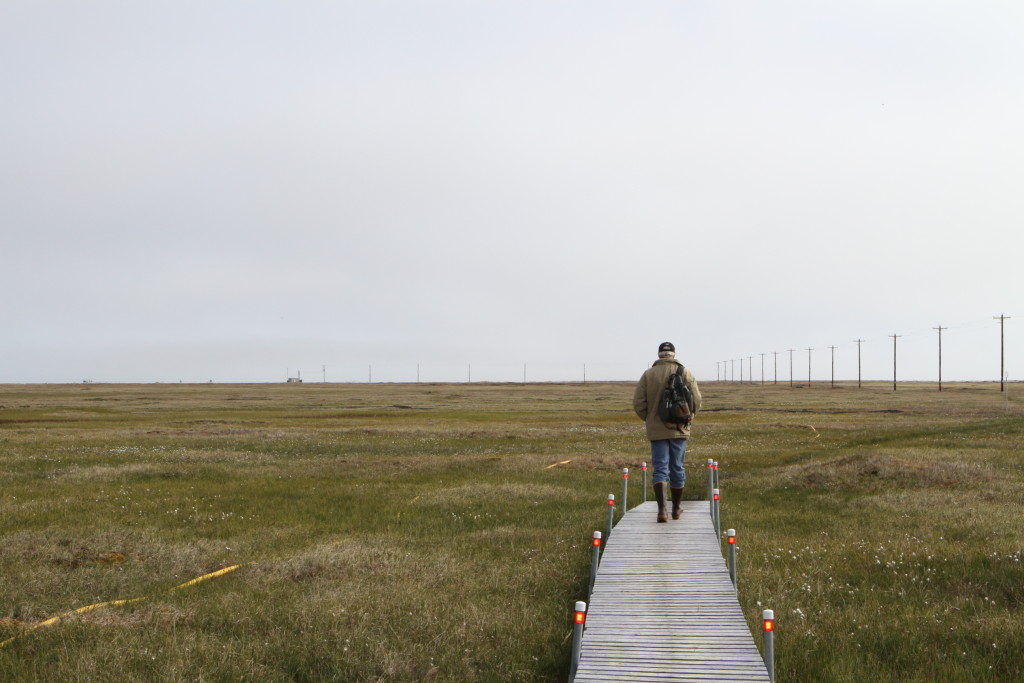
Karl Newyear, chief scientist with the Ukpeagvik Inupiat Corporation in Barrow, leads a tour of the Barrow Environmental Observatory, where researchers come to study the tundra. Credit: NASA/Kate Ramsayer

This is the first time that IceBridge has been based in Barrow—the farthest north town in the United States. And the mission hopes to use it as a base to fly out again, Woods said.

“It’s an ideal location, between the Beaufort and Chukchi seas,” he said, referring to two of IceBridge’s research destinations. “We couldn’t have gotten better support from the City of Barrow and the local community. They’ve been terrific, and we’d love to see our relationship with them grow.”

Ten Things You Should Know about ACT-America

C130 Hercules from Wallops Flight Facility is being used with Atmosphereic Carbon and Transport-America which is a muiliti-year airborne campaign that will measure concentrations of two powerful greehouse gases-- carbon dioxide and methane in relation to weather systems in the eastern United States.
The C-130 Hercules from Wallops Flight Facility is being used for Atmosphereic Carbon and Transport-America, a muilti-year airborne campaign that will measure concentrations of two powerful greehouse gases, carbon dioxide and methane, in relation to weather systems in the eastern United States.

by Mark Kaufman and MaryAnn Jackson / Hampton, Va. /

Atmospheric Carbon and Transport – America, or ACT-America, kicked off July 18. Here are ten things we think you should know about this aiborne field campaign:

  1. The ACT-America study will last 5 years. Each airborne campaign will last six weeks and fly during every season: fall, winter, spring and twice during the summer over the eastern United States.
  2. Other than studying the transport, sources and sinks of carbon dioxide, ACT-America seeks to better understand the sources of methane release into the atmosphere. Methane is an especially potent greenhouse gas—“pound for pound,” a methane emission has 25 times the warming effect of carbon dioxide. (Source: https://www3.epa.gov/climatechange/ghgemissions/gases/ch4.html)
  3. In the United States, the Environmental Protection Agency estimates that the digestive processes of domestic livestock, like cattle and sheep, produce 22 percent of the country’s methane emissions. Globally, however, these animals are believed to be the primary contributors to methane emissions.
  4. Both ACT-America planes, the C-130 and B-200, are fitted with instruments that actively take in bits of the atmosphere as they fly over the rural and urban areas of the United States.
  5. The larger of the two ACT-America planes, the C-130, can stay aloft in eastern American skies for up to 8 hours, cutting “lawnmower” patterns through the atmosphere.
  6. During the growing season, forests serve as effective carbon sinks, taking carbon dioxide from the air and turning it into leaves and other plant matter. During winter, however, when leaves drop and plants decay, these same forests become sources. But are these forests net sinks or net sources of carbon dioxide? ACT-America intends to find out.
  7. At times, the C-130 aircraft will fly underneath, or “under-fly,” a NASA satellite called the Orbiting Carbon Observatory – 2 (OCO-2). Like ACT-America, OCO-2 measures the carbon dioxide in the atmosphere in order to characterize its sources and sinks. ACT-America’s measurements will help to evaluate the accuracy of the satellite’s observations.
  8. Terrestrial ecosystems, like farms and forests, remove one-fourth of anthropogenic carbon dioxide emissions from the atmosphere. ACT-America wants to better understand where this is happening and how these sinks might evolve in the future.
  9. ACT-America is flying over the eastern United States—regions east of the Rockies—because they provide ideal environments to study the transport, release and absorption of carbon: lively and dynamic weather systems, abundant forests and farms, cities, and productive industries.
  10. Understanding how weather moves carbon around the atmosphere will benefit our understanding of an uncertain climatic future. In five years, says Principal Investigator Ken Davis, “we should be able to better manage and predict the future climate.”

Going with the Floe: Measuring Summer Arctic Sea Ice

Sea ice from an airplane
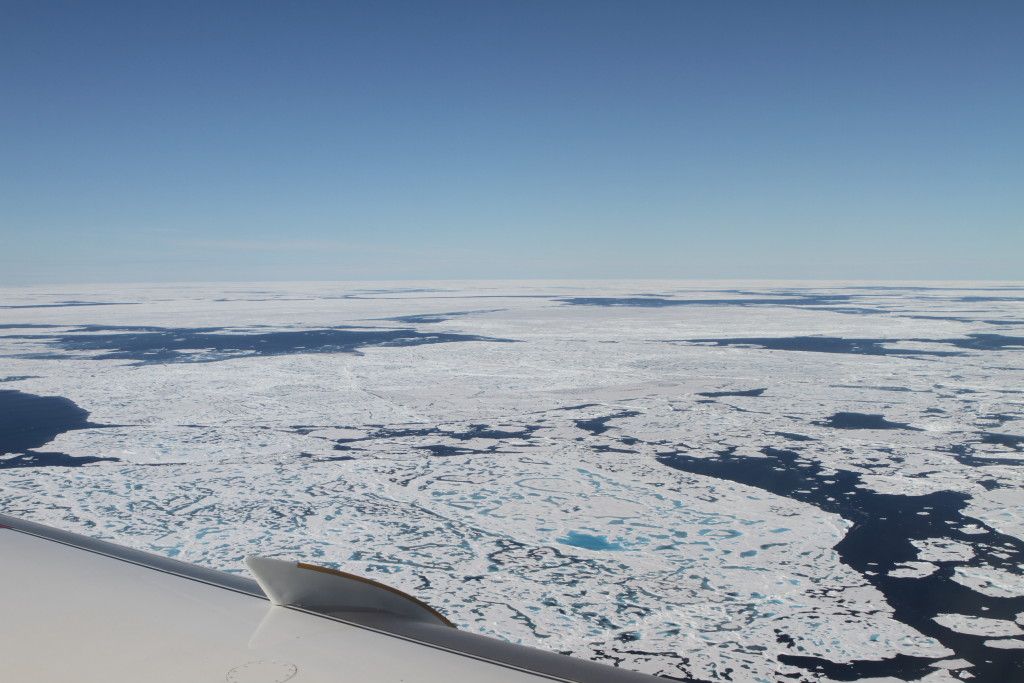
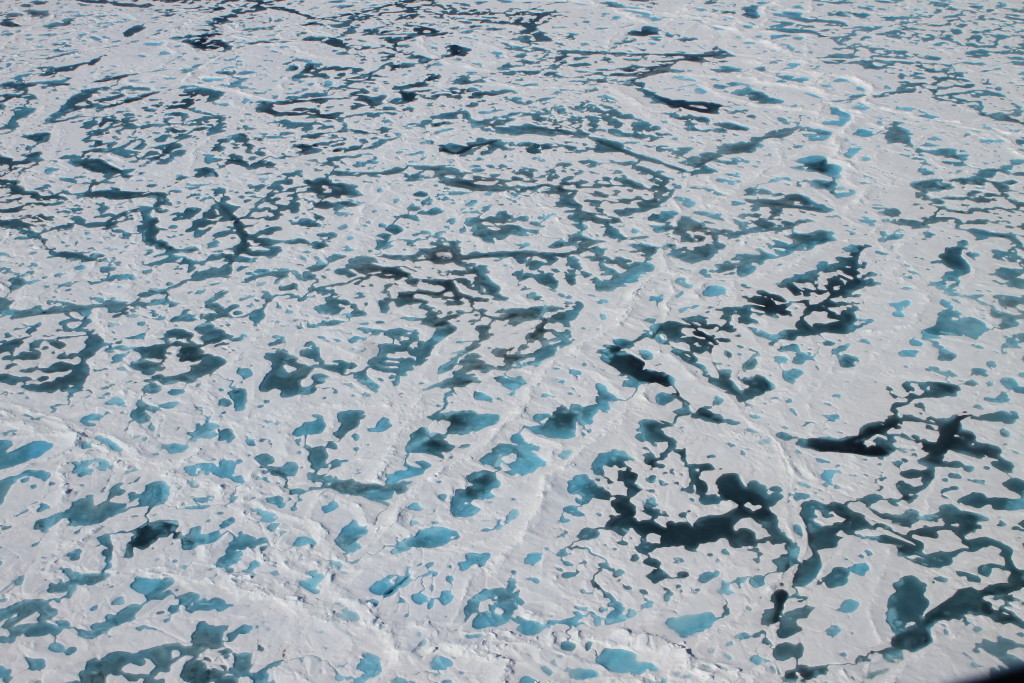
From 1500 feet above the Chukchi Sea, Operation Icebridge sees melt ponds, ridges and other topography on ice floes. Credit: NASA/Kate Ramsayer

by Kate Ramsayer / BARROW, ALASKA /

In July the Chukchi Sea, 300 miles north of Barrow, Alaska, is as varied as any land terrain.

Sheets of floating ice called floes are cracked into pieces like pottery shards and are dotted with ponds of melted snow. The deepest blue ponds, whose dark colors signify melting that’s occurring in thicker ice, connect to neighbors with winding black rivers that empty into the open sea. Giant chunks of ice form rough ridges where ocean currents and winds have slammed the ice floes into each other.

It’s summertime in the Arctic, and the ice is in flux.

“I’ve flown in the spring lots of times, and then the Arctic ice cover is just a flat expanse, it just goes out forever,” said Nathan Kurtz, Operation IceBridge project scientist from NASA’s Goddard Space Flight Center in Greenbelt, Maryland. “Now, in the summer, it’s just so variable. You see places where the floes are a lot more broken up, you see a mixture of places where the snow has melted and you see bare ice, and various depths of melt ponds … you see these patches all over of ice in different stages of melt.”

Melt ponds in the summer could be an indicator of how this year’s Arctic sea ice extent will be at the September minimum.
Melt ponds in the summer could be an indicator of this year’s Arctic sea ice extent at the September minimum. Credit: NASA/Kate Ramsayer

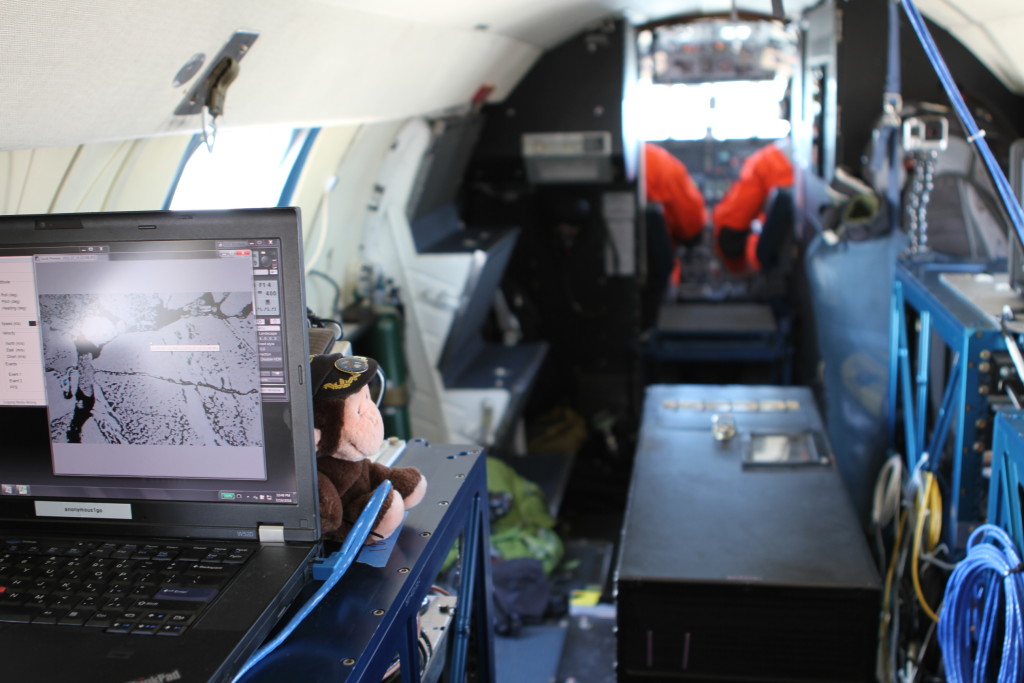
Operation IceBridge made two flights out of Barrow on Tuesday, July 19, as part of the campaign’s first effort to take airborne measurements of melting summer sea ice. Flying 1,500 feet above the ice floes were three instruments: a laser altimeter that measures the heights of the water, snow and ice; an infrared imager that provides temperature readings to help differentiate between water and ice; and a downward-facing mapping camera.

“We’ve never mapped melt ponds so extensively like this,” Kurtz said. And there were many melt ponds to map, as stretches of open water dotted with ice alternated with stretches of ice dotted with ponds and open water.

On the first flight, fog in Barrow and cloudy skies for the first couple hundred miles cleared up just as the agency’s Falcon jet, out of NASA’s Langley Research Center, reached the line the scientists wanted to measure. The goal? Take readings along the path that the European Space Agency’s CryoSat-2 would fly over shortly after 3 pm, local time. That would provide ways to compare the satellite and airborne data and see if scientists could use the summer satellite data.

Instruments on NASA’s Falcon jet monitor the sea ice in the Chukchi Sea below.
Instruments on NASA’s Falcon jet monitor the sea ice in the Chukchi Sea below. Credit: NASA/Kate Ramsayer

Then, early Tuesday evening, the team took off on another flight to the northeast. This flight was designed to see the patterns and topography of sea ice in the Beaufort Sea along a path dubbed the Linkswiler line, after Matt Linkswiler, operator of the laser altimeter.

Kurtz and his colleagues are investigating whether a combination of measurements can help estimate sea ice thickness. It’s a tricky piece of information to get, but one that could provide clues to how fast the summer ice will melt, or whether it could stick around for another year.

They’re studying how well the laser altimeter can measure the depths of the melt ponds—another possible indication of the year’s overall melt season. It’s one of several ways the IceBridge campaign is preparing for the Ice, Cloud and land Elevation Satellite-2, or ICESat-2, scheduled to launch by 2018. How IceBridge can measure summer ice melt could help ICESat-2 scientists develop programs to analyze the satellite’s summer data.

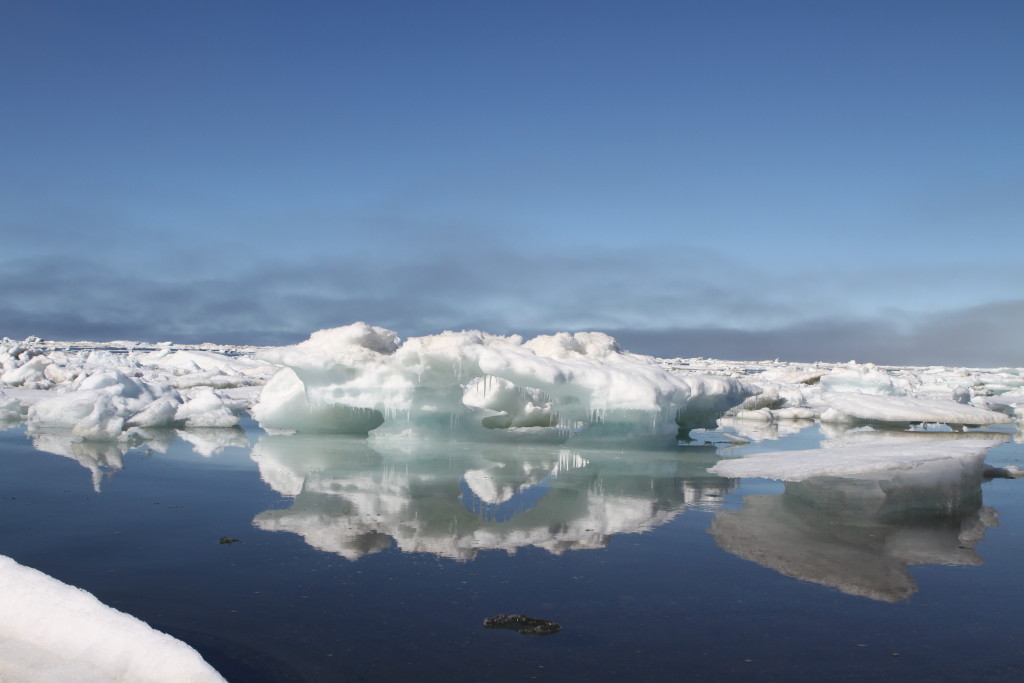
Sea ice melts off the beach of Barrow, Alaska, where Operation IceBridge is based for its Summer 2016 campaign. Credit: NASA/Kate Ramsayer

For Kurtz, the sheer variety of the summer ice is surprising and was especially noticeable on the Tuesday afternoon flight. Different shades of white gave hints to whether it was just ice or snow on top of the ice, while in some areas the ice was brown, possibly due to embedded algae, Kurtz noted.

After Tuesday’s two flights, Icebridge had completed five of its six planned flights for the Barrow summer campaign. With its clear skies, Tuesday afternoon’s expedition was the best yet.

“That was an excellent flight,” Kurtz said over the plane’s intercom system. “I don’t think we lost anything to clouds.”

Taking Measure of a Remote Slice of Alaskan Forest

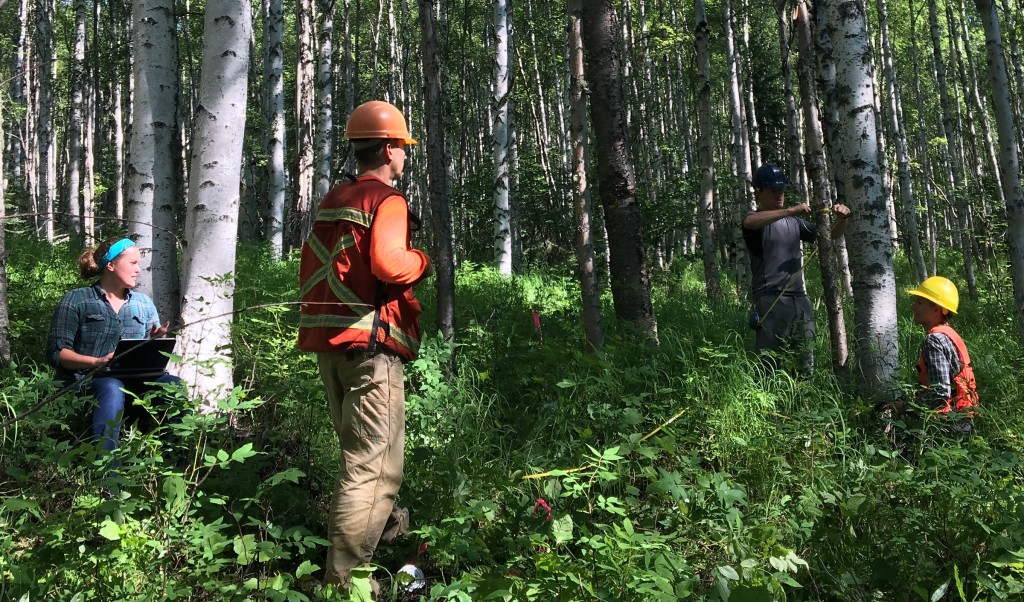
Kate Legner points out the next tree in the survey site as other crew members measure key information about the vegetation in a 53-foot diamter plot. Credit: NASA/Kate Ramsayer

by Kate Ramsayer / SALCHA, ALASKA /

In a birch forest in interior Alaska’s Tanana Valley, there’s a stake with pink plastic tape attached. More than three decades ago, a plane flew over it to take stereoscopic pictures of the surrounding plot, and scientists trekked out to survey the trees and vegetation. Now, scientists are re-flying and re-surveying the site, using advanced airborne instruments and satellite images to track changes in interior Alaska.

“This is going to be 10.3,” called out Sean Cahoon, a scientist with the University of Alaska, Anchorage. He was standing at the end of a tape measure radiating out from the stake, using another tape measure to check the diameter of the base of a birch tree.

Birch trees, numbered in yellow, have been measured as part of the site survey. Credit: NASA/Kate Ramsayer

Kate Legner, with the University of Washington in Seattle, recorded the number as well as the diameter at breast height, the distance from the stake, and the azimuth (angle from due north) of the tree’s location.

“That’s all you need to recreate this whole area,” Legner said. The area in question is a circle with a 53-foot radius out from the stake. Mostly birch, with a few aspen and white spruce trees, just sparse enough to let some sun filter through to shrubs, seedlings, moss and lichens thick on the ground.

ABoVE scientists measure a field site in interior Alaska's Tanana Valley, which has been monitored from the ground, airborne instruments and satellites to track changing ecosystems. Credit: NASA/Kate Ramsayer
ABoVE scientists measure a field site in interior Alaska’s Tanana Valley, which has been monitored from the ground, airborne instruments and satellites to track changing ecosystems. Credit: NASA/Kate Ramsayer

The recreation of this and other plots in the Tanana Valley is a key part of the NASA-funded Arctic Boreal Vulnerability Experiment, or ABoVE. Scientists will compare ground surveys to surveys from 35 years ago, along with aerial photos from similar time periods. They’ll also incorporate data from NASA Goddard’s Lidar, Hyperspectral, and Thermal (G-LiHT) airborne imager, which provides vegetation heights and composition information along sample strips throughout the valley.  The times between these ground and airborne observations are filled by periodic image data from Landsat satellites. Landsat provides a more continuous record of change, but the coarse resolution of the data does not capture tree-scale information.   

“Our overall objective is to make use of a really rich historical inventory dataset that we have available,” said Hans Andersen, an ecologist with the U.S. Forest Service and co-investigator on the project. “We’ll be interested in changes in the vegetation cover that could be due to climate change over that period of time.”

The different sources of data complement each other, he said. Ground surveys allow researchers to identify and count individual trees, while aerial photos can cover more ground. The strips of G-LiHT data, covering the valley and collected by NASA Goddard’s Bruce Cook, who is leading the project, provide high-resolution data of tree heights, species composition and moisture conditions of the site.

Every time a Landsat satellite passes overhead and captures a cloud-free image, the team adds that to the data record as well. It’s not a coincidence that the 53-foot-radius plot matches up with a single Landsat pixel, Andersen said.

And it’s not just tree composition that the crew is interested in. As Legner and Cahoon were measuring and marking trees, Andersen and the fourth member of the survey crew were nearby digging a hole, collecting soil samples in plastic zippered bags.  

“The soil samples are all about the carbon,” said Robert Pattison, with the U.S. Forest Service’s Anchorage Forestry Sciences Laboratory. “For interior Alaska, it’s really the biggest story.”

One new element to the survey protocol: taking soil samples at different depths to check carbon content. Credit: NASA/Kate Ramsayer

This summer, the crew is refining their field sampling protocols and investigating “road-accessible” sites. The birch site was a half-mile scramble up a hillside covered in prickly bushes and thick shrubs, with fallen trees and branches providing additional obstacles.

Next year, the crew will use helicopters to get to even more inaccessible sites across the Tanana Valley. They’ll survey about two dozen representative sites, measuring trees, soils and other sources of carbon, with the goal of making computer models to relate those findings to sites across the valley.

“The end product is essentially an estimate of carbon in various places across the entire Tanana,” Andersen said.

Living Off the Land in a Changing Arctic Climate

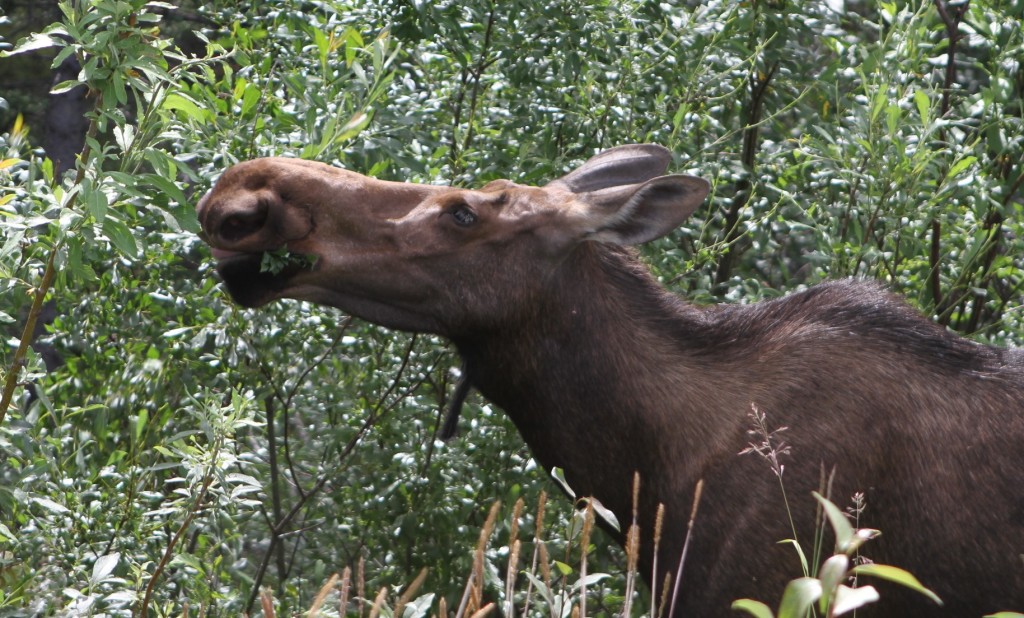
Moose
Moose are one of the main resources for subsistence hunters in Alaska. Areas that are recovering from a low-severity wildfire can attract the ungulates. “If we didn’t have fires ripping through, we would have fewer moose walking through here and fewer full freezers,” said Todd Brinkman, an assistant professor at the University of Alaska, Fairbanks. Credit: NASA/Kate Ramsayer

by Kate Ramsayer / FAIRBANKS, ALASKA /

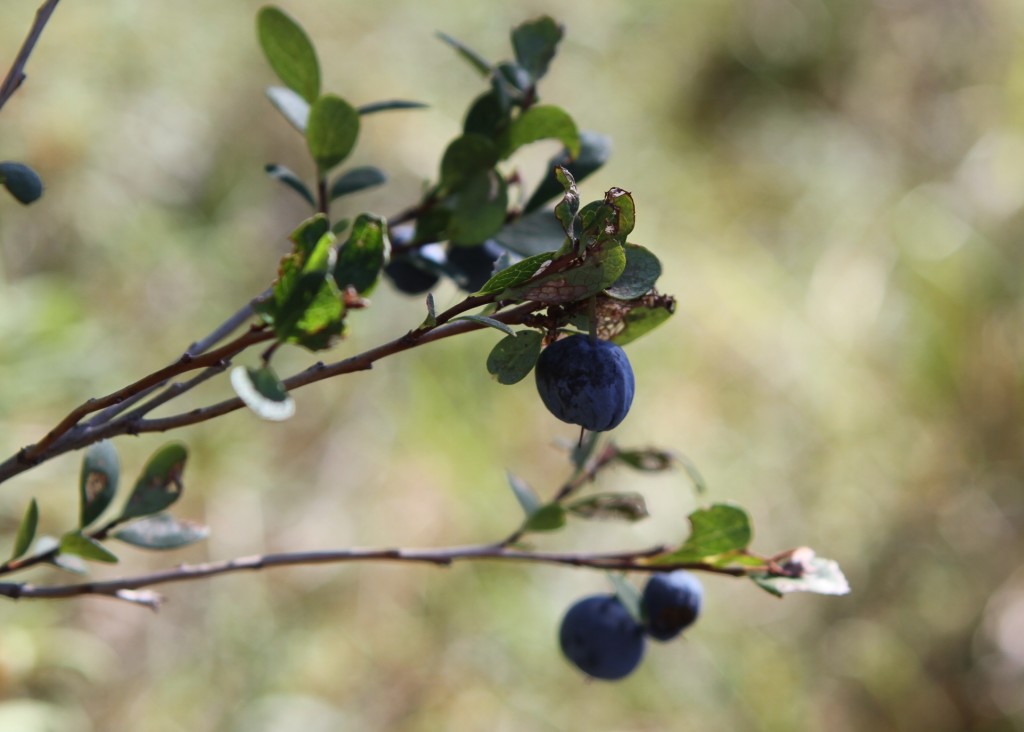
Scrambling up the bank of the Tanana River south of Fairbanks, Theresa Hollingsworth was looking for examples of how the forest recovers after a wildfire. She found an unexpected sweet surprise.

“Blueberries!” she yelled from the banks.

Gathering handfuls, she instantly planned a return trip later in the week to go picking. “You fill your freezer with as many berries as you can.”

It’s a way of life for many Alaskans, said Hollingsworth, a research ecologist with the U.S. Forest Service’s Pacific Northwest Laboratory. People have favorite—often secret—berry spots they go back to year after year. They also hunt and fish, stocking freezers with moose and salmon and other game.

For many Alaskans, summer is time to stock freezers with blueberries. Credit: NASA/Kate Ramsayer
For many Alaskans, summer is time to stock freezers with blueberries.
Credit: NASA/Kate Ramsayer

Many of the rural villages in this giant state—more than twice the size of Texas—aren’t connected with roads, said Todd Brinkman, an assistant professor at the University of Alaska, Fairbanks.

“The road network for a lot of these rural communities is on the rivers, or trail networks through the woods,” he said. “That’s their access to the grocery stores—grocery stores being the forests around them.”

But many residents are reporting that the changing environment is creating obstacles to how they reach these resources. So Brinkman and Hollingsworth are working on a research project with the NASA-funded Arctic Boreal Vulnerability Experiment, or ABoVE, to investigate how access to game, berries, and neighboring villages is changing in a warming climate.

In March, Brinkman gave camera-equipped GPS units to subsistence hunters in eight or so villages across Alaska. Over the next year, the residents will document anything that blocks or hinders their travel, whether it’s an early thaw of river ice, a wildfire, a trail sunk by thawing permafrost or something the researchers haven’t yet thought of.

“We’re letting the subsistence users really drive the research,” Hollingsworth said.

In one area, for example, women were wary of collecting blueberries in their traditional spot, since a wildfire had torn through and left dead trees in danger of toppling over. Wildfires can also change the types of plants that grow back, which in turn could impact the wildlife as well as the people living nearby.

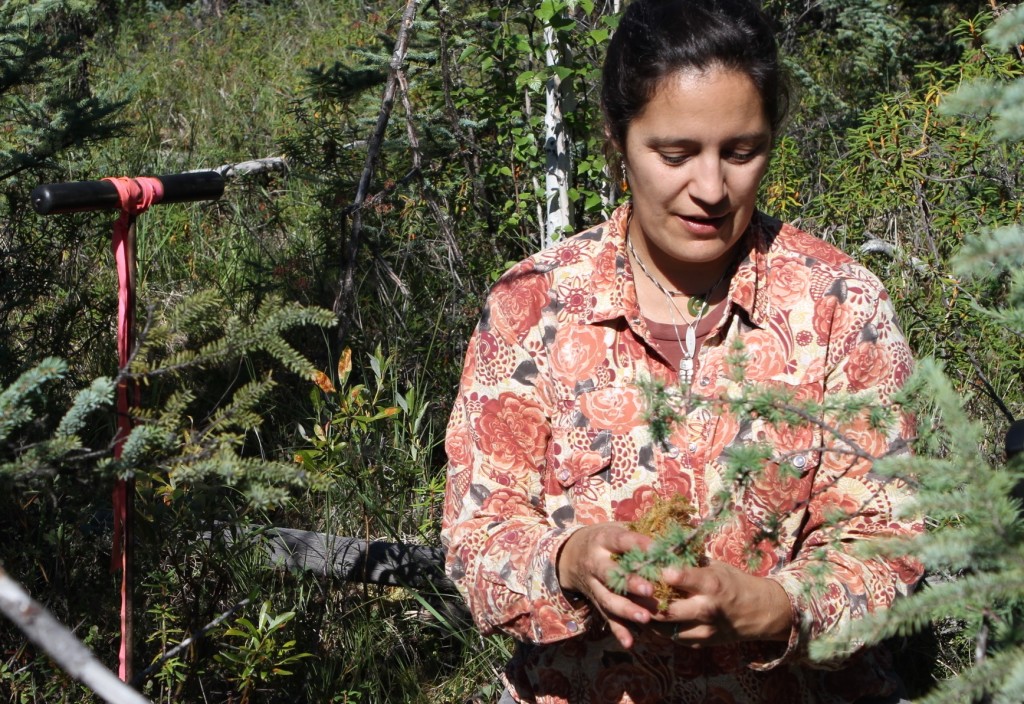
Scientist looks at plants.
Theresa Hollingsworth examines the moss and lichens on a forest floor. Credit: NASA/Kate Ramsayer

Rural residents have also noted changes to the rivers, Brinkman said. People boat along rivers in summer and use them as a snowmachine trail in winter, but the in-between periods while the ice is breaking up or forming make travel incredibly difficult. If a warming climate means early ice break-up, it’s significant to people who depend on that river, he said.

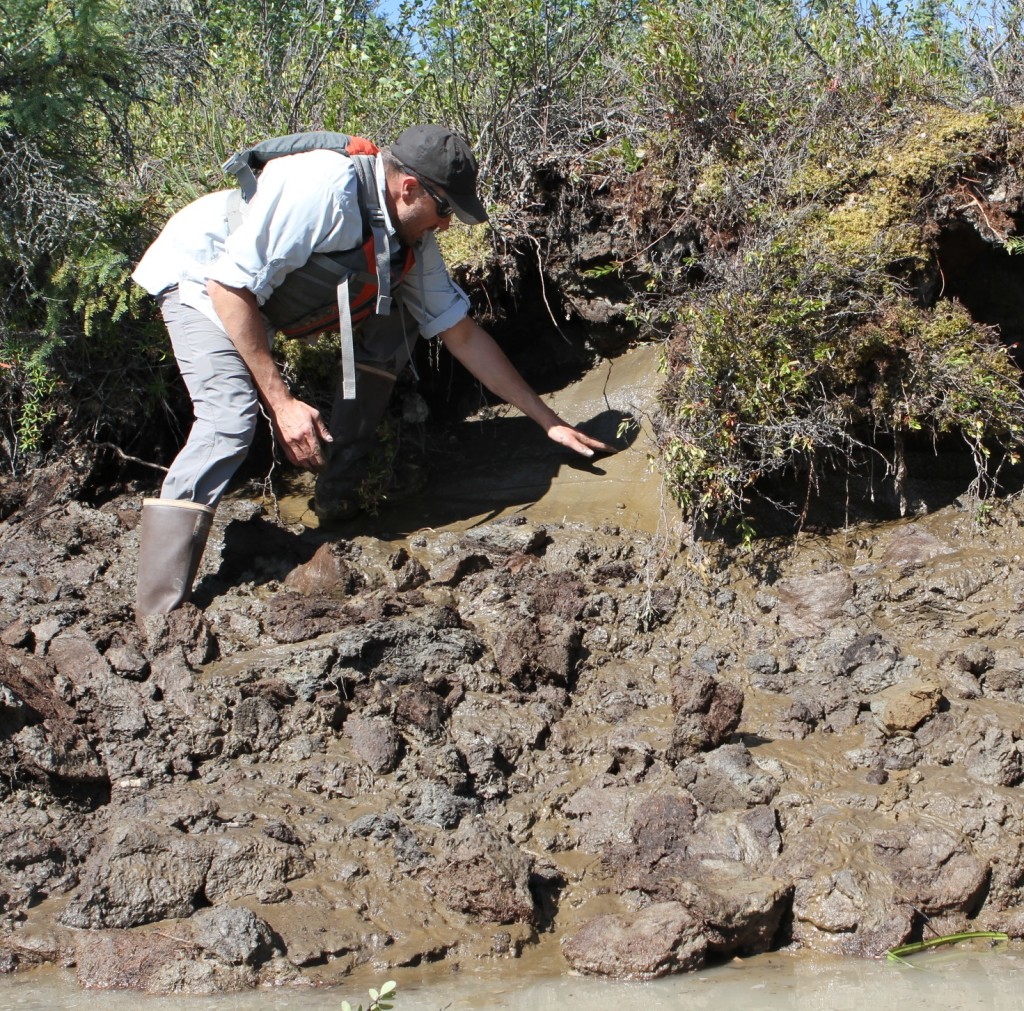
The character of some rivers is also changing. Residents are noting that the permafrost in the banks is thawing, leading to erosion. More erosion means wider rivers, which also means shallower rivers.

“Where the permafrost is exposed, it’s challenging navigating on a lot of these river systems,” Brinkman said.

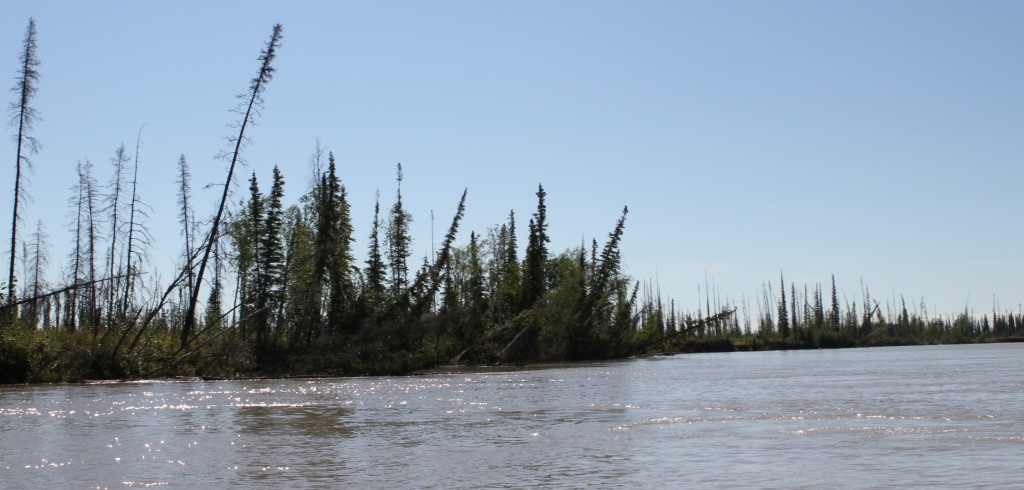
A river.
The Tanana River south of Fairbanks, Alaska. For many rural residents, rivers are an important transportation route.
Credit: NASA/Kate Ramsayer
A riverbank.
Brinkman looks at a riverbank of thawing permafrost, which is dripping water and sending clumps of soil into the river. Credit: NASA/Kate Ramsayer

After a year’s worth of these disturbances are recorded, Hollingsworth and others will examine the sites. They’ll analyze remote sensing images, including those from Landsat satellites, for before-and-after comparisons. They’ll visit the site, inventory the ground cover and trees and take soil samples and other measurements to get a sense of what is happening with the ecosystem. The researchers can also use remote sensing images to relate changes to access in one place to changes that could be happening in similar ecosystems.

And they’ll talk with the residents about how these changes are impacting their everyday lives, Brinkman said. “We’ll start to understand the types of disturbances we should dig into.”

Tower Power: Measuring Carbon in the Last Frontier

Alaska boreal forest
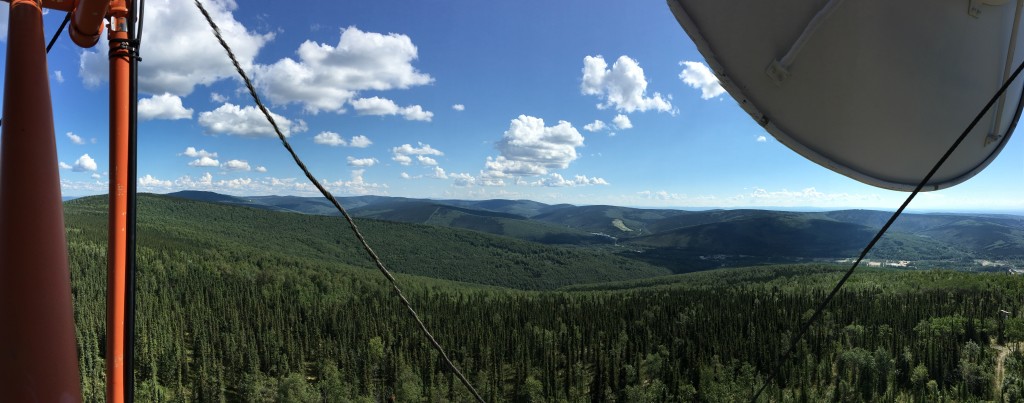
The boreal spruce forests of interior Alaska are visible from the top of a tower that measures greenhouse gasses for the ABoVE project. Credit: NASA/ Kate Ramsayer

On a clear day from atop a 100-foot tower on a peak north of Fairbanks, you can see 100 miles in every direction. The rolling hillsides are covered in black spruce, white spruce, some birch, with shrubs and moss beneath them.

For Chip Miller, deputy science lead for NASA’s Arctic Boreal Vulnerability Experiment, or ABoVE, it’s an unmatched view of the region’s carbon.

“You see the boreal forest of interior Alaska and all of the above-ground carbon that’s stored there,” he said. “And it’s carbon dioxide that’s been sucked out of the atmosphere by all of those trees and all of those plants.”

The ABoVE field campaign is studying how Alaska and northwest Canada are changing in a rapidly warming climate. On the hot Wednesday morning of July 13, Miller checked in on the tower that has played a key role in tracking the changes in greenhouse gases since 2011.

“There are such massive amounts of carbon dioxide exchanged between terrestrial biospheres and the atmosphere, and they vary quite a bit from year to year, and even month to month, week to week or day to day, depending on climate conditions,” said Miller, a researcher with NASA’s Jet Propulsion Laboratory. “We make these measurements here at the tower, 24/7, 365 days a year, to give us that continuous record of what’s going on with the carbon cycling.”

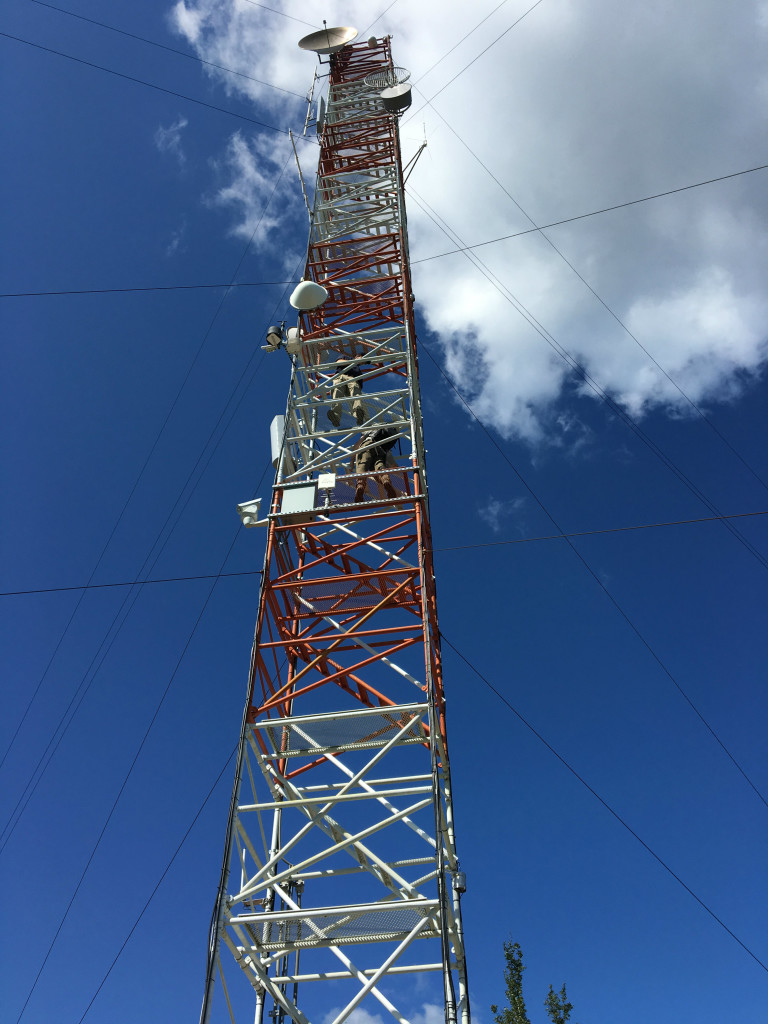
Instruments on the tower, which is operated by the National Oceanic and Atmospheric Administration, measure the amount of carbon dioxide, carbon monoxide and methane in the air. The tower measures gases that drift in from as far away as Canada and the Brooks Range in northern Alaska.

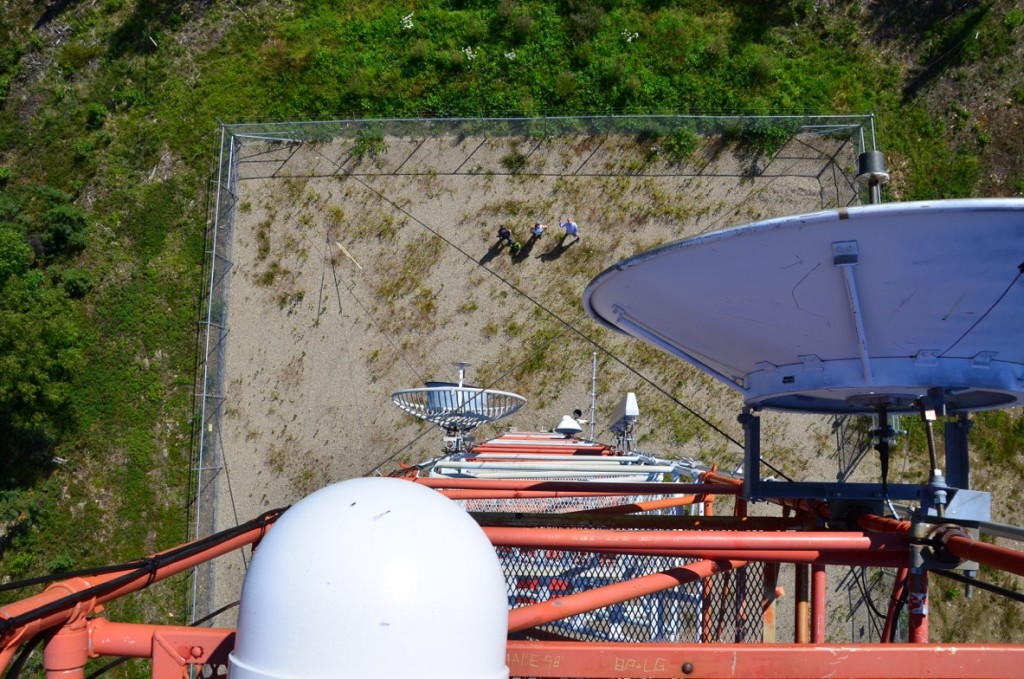
The tower has instruments along its scaffolding to take measurements of the air above interior Alaska. Credit: NASA/Kate Ramsayer

Carbon dioxide is the most important greenhouse gas that’s exchanged between the atmosphere and the vegetation on the ground, Mlller said. Methane is a potent greenhouse gas that is released from wetter ecosystems. Carbon monoxide is a key product of wildfires and so helps scientists detect when a burn is releasing the carbon stored in forests into the atmosphere, he said.

While 2016 has so far not been a big fire year for interior Alaska, last year about 5 million acres burned, he said, noting that large fires could send smoke billowing across the landscape.

“The acrid quality of the air would make a heavy pollution day in Los Angeles or Beijing look like nothing,” he said.

The tower has instruments along its scaffolding to take measurements of the air above interior Alaska. Credit: NASA/Kate Ramsayer

Since the tower started collecting measurements, Miller and his colleagues have been analyzing the data. They can identify individual fire plumes that drift toward the tower. And when they compare measurements year to year, they’ve found that there’s a lot of variability year to year in carbon dioxide—but not necessarily of the methane.

“We’re still trying to understand why the methane is not varying as much as we think it might,” Miller said. “That’s part of the ongoing scientific investigation.”

Keeping Scientists in the Arctic Safe and Supplied

LogisticsPicSign2

by Kate Ramsayer / FAIRBANKS, ALASKA /

With more than three dozen research groups scattered across 2.5 million square miles of Alaska and northwest Canada, somebody’s bound to need some last-minute chicken wire.

When one group with NASA’s Arctic Boreal Vulnerability Experiment, or ABoVE, discovered that Arctic hares were nibbling into their experiments, Sarah Sackett, the Fairbanks ABOVE logistics coordinator, made sure they got the protective equipment they needed.

Sackett’s role in ABoVE starts early on in a team’s field season. She provides safety and logistical support to researchers, works with them to identify what kinds of hazards they might run into and what specific training they need, from bear safety to proper handling of an off-road vehicle to the need for hydration even in the cold.

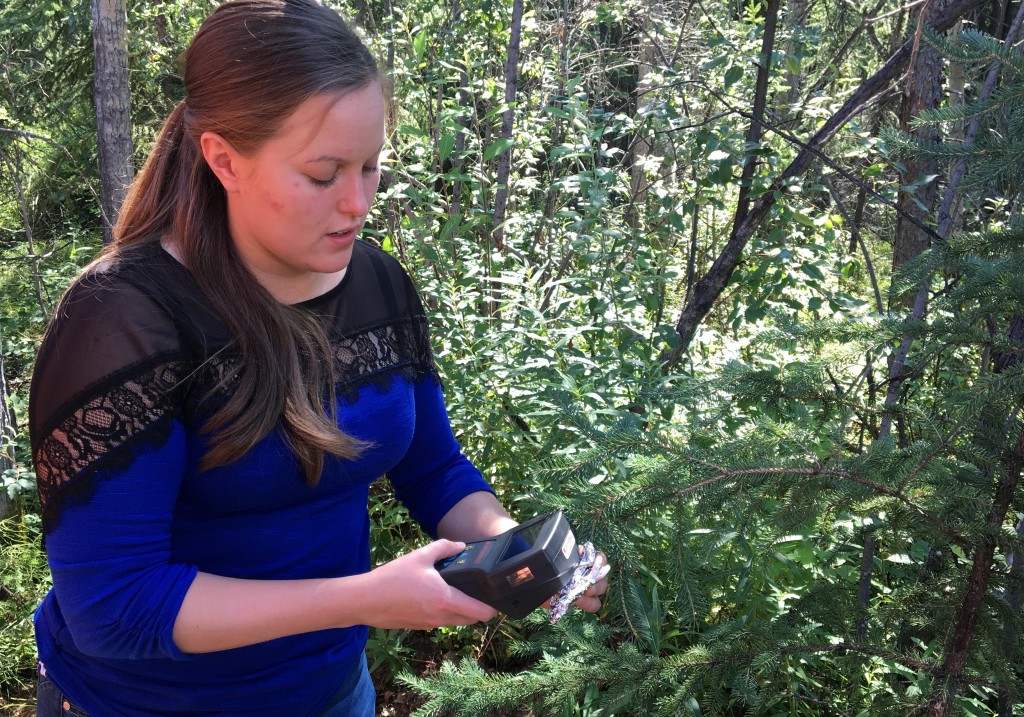
ABoVE Fairbanks logistics coordinator Sarah Sackett not only provides safety and logistics support to researchers in the field, she ventures out to collect data for scientists as well. Here, she demonstrates how to measure photosynthesis in spruce needles. Credit: NASA/Kate Ramsayer

“We start training with the very basics, because we might have graduate students from New York, brand new to the field, all the way to people who have been out in the Arctic field for years,” said Sackett, a Fairbanks native.

At ABoVE’s new office in Fairbanks, Sackett and the logistics team is building a lending library of equipment: tents, satellite phones, cooking equipment, tarps, rain boots, mosquito nets, even high-tech GPS units that can locate a remote spot to a fraction of an inch. ABoVE is a decade-long field campaign, and having stocked shelves of equipment for researchers to check out as needed will be convenient and cost-effective for the effort.

In addition to providing needed hardware to researchers, Sackett helps with logistics, from flight arrangements to truck rentals. She works closely with Dan Hodkinson and Leanne Kendig back at NASA’s Goddard Space Flight Center in Greenbelt, Maryland, who are key to the effort, Sackett said.

“The little details are where it counts, so we start as early as we can,” she said. “I like putting all the little pieces together to make the big picture work.”

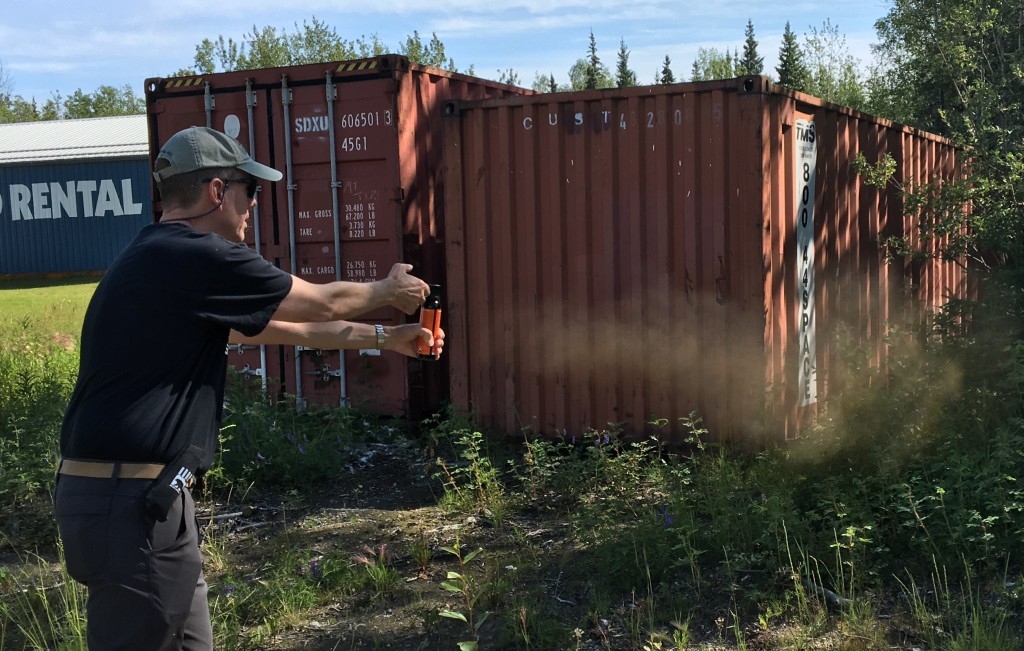
ABoVE staff scientist Peter Griffith, of NASA’s Goddard Space Flight Center, practices deploying bear spray. "Wait until it’s closer than you’re comfortable with," advises Sarah Sackett, who provides safety training for scientists heading out into the field. Credit: NASA/Kate Ramsayer
ABoVE staff scientist Peter Griffith, of NASA’s Goddard Space Flight Center, practices deploying bear spray. “Wait until it’s closer than you’re comfortable with,” advises Sarah Sackett, who provides safety training for scientists heading out into the field. Credit: NASA/Kate Ramsayer

And as she’s handling the planning and organizational side of the job, she’s learning how to do the science as well. One researcher trained her how to use a device to take measurements of needles of a spruce tree. Now she will go up monthly to collect and download the data, saving the out-of-state researchers a long trip.

“I was hoping that’d be part of the job,” Sackett said, noting that she won’t look at trees the same way again. While she’s excited to help with more of the field experiments in the future, she also loves working with the teams to solve problems and ensure they can do their work in often-difficult terrain and harsh conditions.

“It’s pretty much the best job ever,” Sackett said. “My boss is like, ’figure this out,’ and I’m like, ’OK!'”

Counting Sheep, the ’driving force’ of Denali

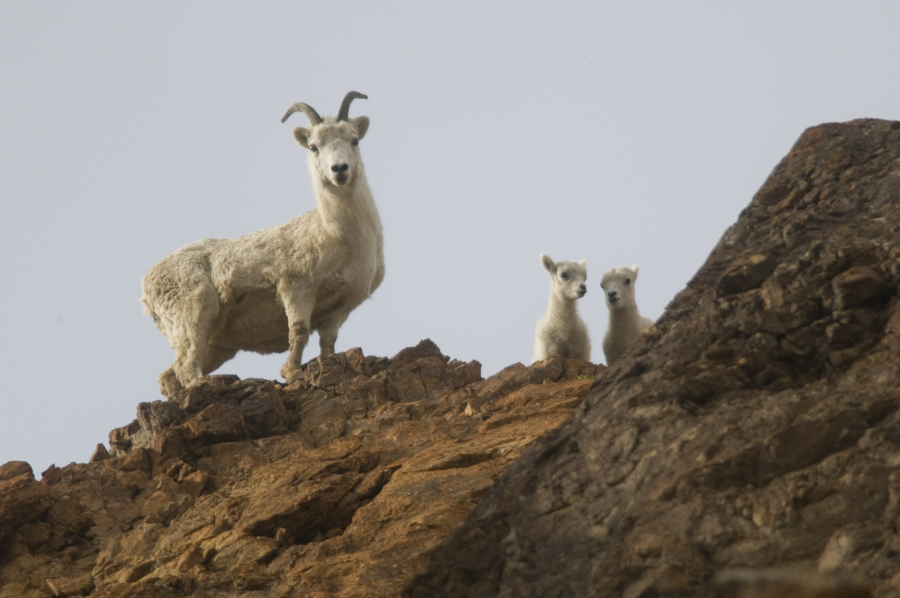
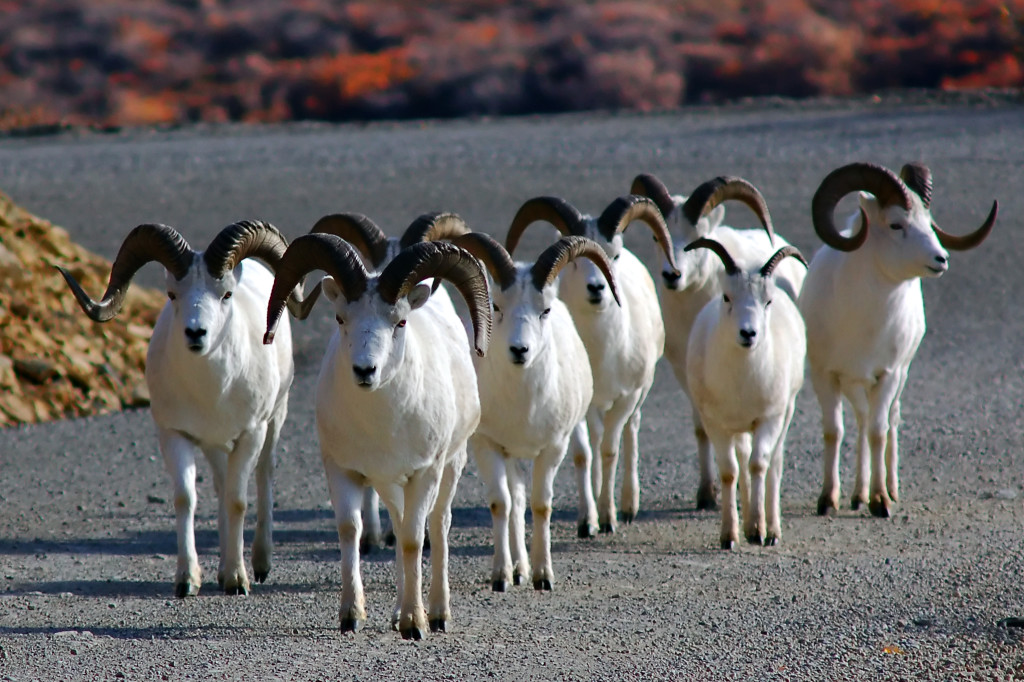
Dall sheep—an iconic species in Denali National Park—are the subject of an ABoVE project studying the impact of climate change on the animals and their habitat. Credit: National Park Service

by Kate Ramsayer / DENALI NATIONAL PARK, ALASKA /

On Monday, July 11, as the green shuttle bus stopped at a campground to pick up drenched passengers, a murmur spread. Fingers pointed out the left side of the window, necks craned, binoculars raised to eyes and sure enough, there they were—three Dall sheep perched on a craggy ledge, far above the road in Denali National Park.

What many on the bus might not realize, said Bridget Borg, Denali wildlife biologist, is that those animals spurred the formation of the park 99 years ago. Concerned that market hunters were killing too many sheep to sell to Alaskan miners, Charles Sheldon led the charge to protect Dall sheep and their habitat.

“They’re the reason the park was created,” Borg said. “A lot of people want to come see these charismatic carnivores—the bears and wolves—but sheep are really the driving force behind Denali.”

Sheep on a road
Dall sheep in Denali National Park. Credit: National Park Service

And they’re the subject of one of the research efforts in the NASA-funded Arctic Boreal Vulnerability Experiment, or ABoVE. The ABoVE campaign is looking at changes in Alaska and Northwest Canada in a warming climate, including changes to wildlife species and their habitat.

Borg and colleagues across Alaska and Canada are surveying sheep as a part of a project led by Laura Prugh, of the University of Washington, to examine how changes to snow cover and vegetation at high elevations are impacting Dall sheep.

“We’re one aspect of a really big project,” Borg said.  She and her colleagues at Denali conduct two types of sheep surveys: aerial surveys to estimate the population numbers (current count is about 2,000 in the park), and ground surveys to see how many ewes give birth to lambs in a given year.

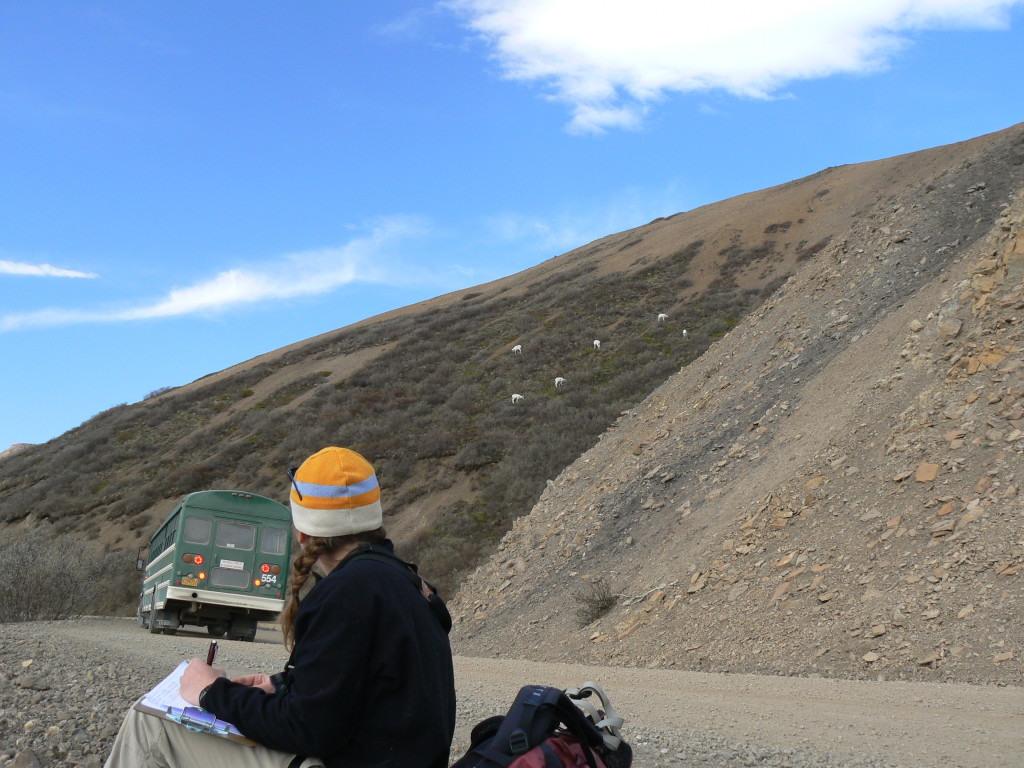
In the summer, the biologists have a pretty easy time of spotting sheep for the ground surveys, she said. They hike up from the park road to get a view of good sheep habitat—rocky areas where predators can’t climb—and then look for white spots amongst the grey rocks. It’s a little harder in the late spring, she noted, when the snow has melted into sheep-sized patches on a mountain. Shiny rocks can trick visitors on the bus into yelling out a sheep-sighting as well.

Scientists count sheep.
Denali National Park biologists survey sheep both from the ground and the air. Visitors can often see them from the shuttle bus that drives the one road into the 6-million-acre park. Credit: National Park Service

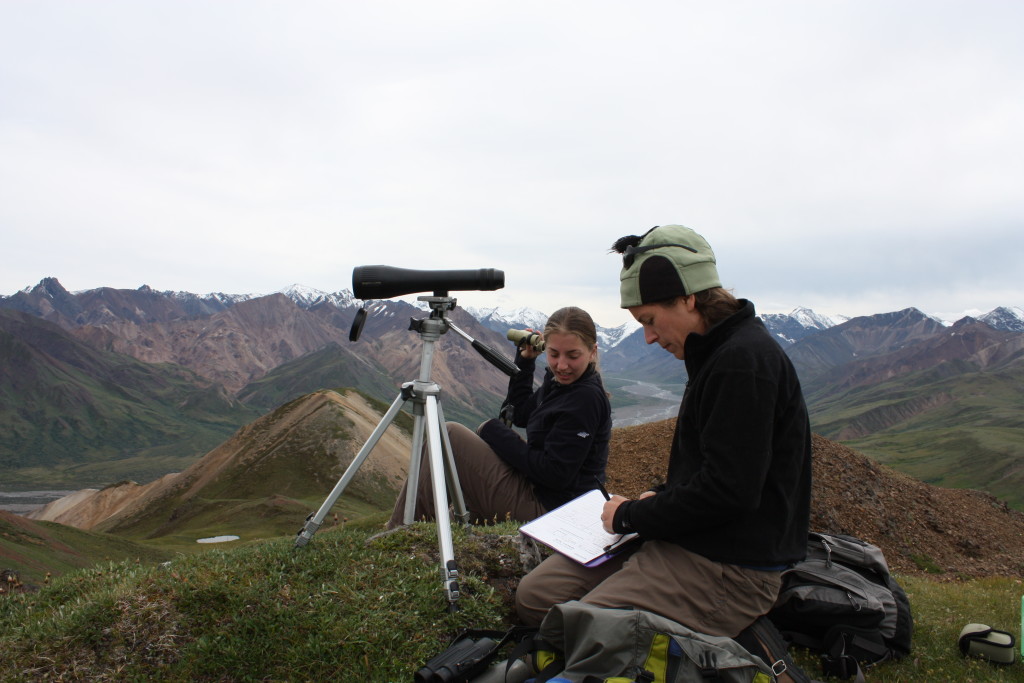
When the researchers spot sheep, they train a spotting telescope on the area and count the lambs, ewes and rams. They estimate the rams’ ages based on the completeness of the horn curl, and watch an area for a while to make sure they didn’t miss any lambs. Lambs are quite good at hiding behind their mom, Borg said. The lamb-to-ewe ratio is a good indication of the health of the population; a ratio of 30 lambs to 100 ewes is reasonable, she said, but for a few years recently that number was down around 10 lambs to 100 ewes.

“We noticed a decline in productivity—it’s really prompted some questions going forward,” Borg said.

Borg and a colleague count a herd of sheep in Denali National Park. By comparing the lamb-to-ewe ratio from year to year, scientists can see changes in the health of the population. Credit: National Park Service
Bridget Borg (right), wildlife biologist with Denali National Park, and a colleague count a herd of sheep in Denali National Park. By comparing the lamb-to-ewe ratio from year to year, scientists can see changes in the health of the population. Credit: National Park Service

With ABoVE, she hopes to address some of those questions. The sheep study group will use remote sensing maps of snow cover, as well as computer models, to study how that can impact population health. They’ll also look at whether shrubs growing higher and higher in elevation, up into rocky sheep habitat, affects the populations.

“Shrubs are moving up the slope, and the sheep really need those rocky slopes, both for the forage and the escape terrain,” Borg said. Warmer temperatures could also be changing the quality of the forage available to sheep.

With sheep so important to Alaskans and to park visitors, these are key questions to ask, Borg said. “Will future generations be able to come to this park, and see the reason it was created?”

ABoVE Looks Below the Surface for Carbon Answers

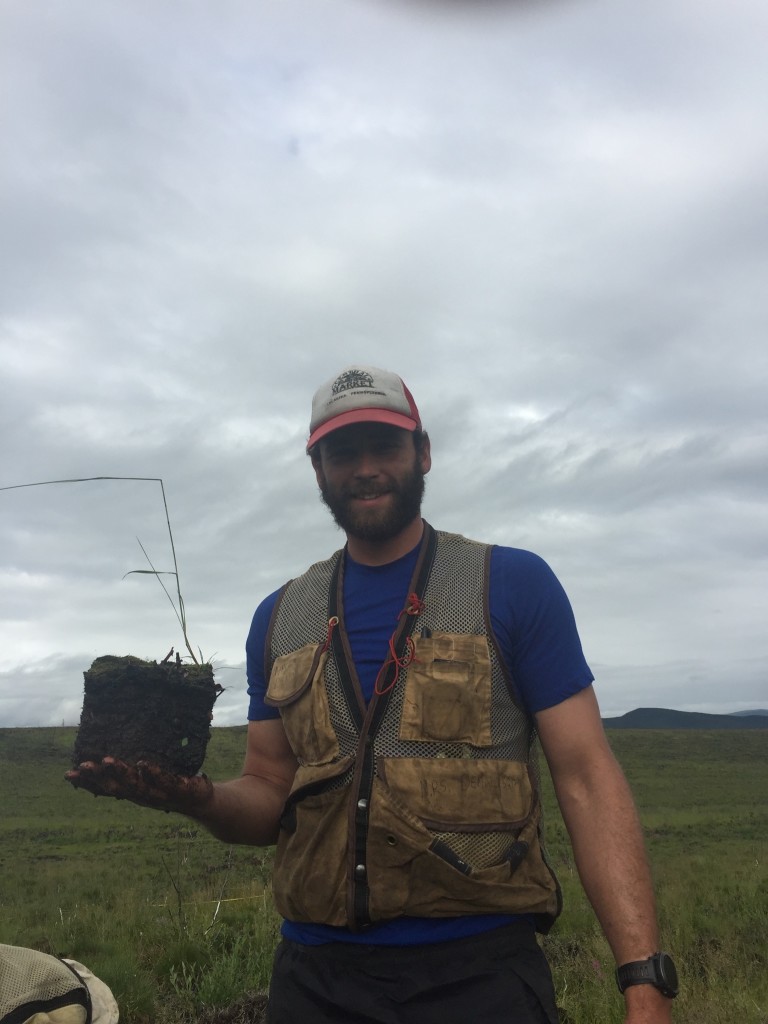
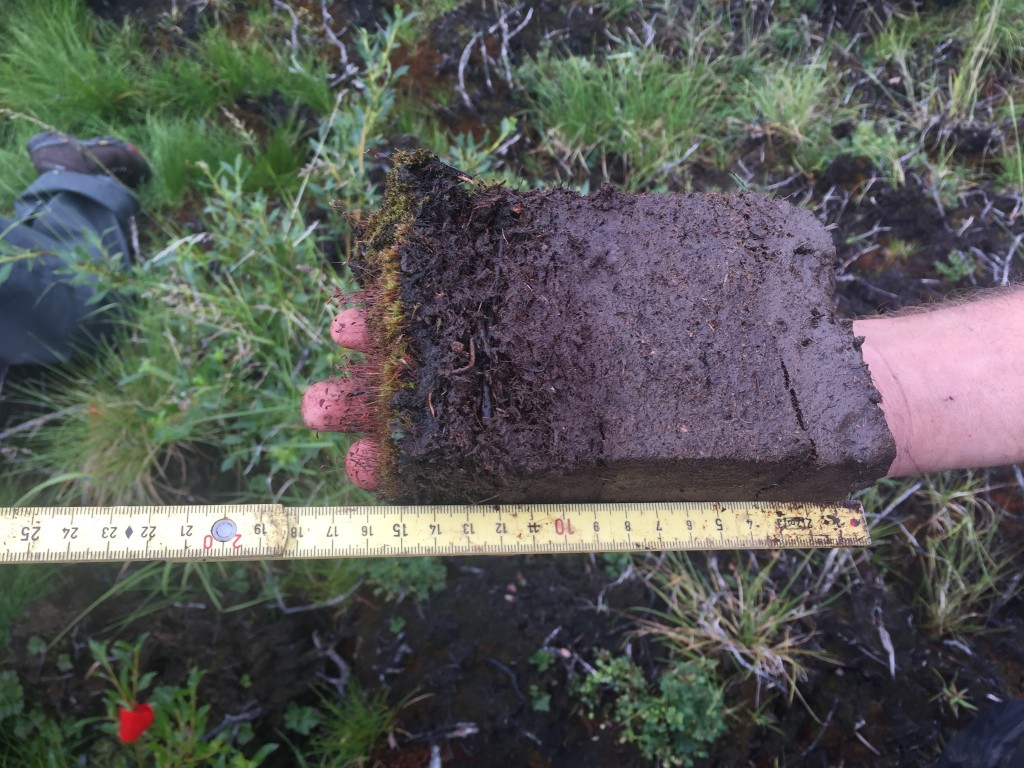
Tyler Gault, an undergraduate student at Northern Arizona University in Flagstaff, holds a cross section of tundra soil – moss, over slightly decayed moss, over more decayed moss. These layers can be hundreds or even thousands of years old. Credit: Walker/NAU
Tyler Gault, an undergraduate student at Northern Arizona University in Flagstaff, holds a cross section of tundra soil—moss, over slightly decayed moss, over more decayed moss. These layers can be hundreds or even thousands of years old. Researchers are studying whether ’legacy carbon’—carbon that has been stored in the soil for centuries—is being released into the atmosphere in recent, severe fires. Credit: Xanthe Walker/Northern Arizona University

by Kate Ramsayer / DENALI NATIONAL PARK, ALASKA /

A National Park Service helicopter lifted off Sunday morning, July 10, flying past dark clouds and green mountain slopes on a 20-minute trip deep into the Denali National Park wilderness. On board are researchers and lots of gear, from shovels to plot markers to food and water for a week. The destination: a plot of tundra charred by a wildfire in 2013. Ecologist Xanthe Walker and her crew will sample the remaining soil, looking to see if the fire burned through carbon that had been stored in the ground for centuries.

“The tundra’s not supposed to burn like that,” said Brian Howard, a PhD student at Northern Arizona University in Flagstaff.

“Which is why we want to study it,” said Walker, a postdoctoral researcher at the university.

Their study is part of the Arctic Boreal Vulnerability Experiment, or ABoVE, a NASA-funded, decade-long effort to go into the field in Alaska and Northwest Canada to answer questions about this key region.

“At its core, ABoVE is attempting a study of the vulnerability and resilience of ecosystems—and not just ecosystems, but society—to rapid environmental changes that are already taking place,” said Peter Griffith, ABoVE chief support scientist based at NASA’s Goddard Space Flight Center in Greenbelt, Maryland. “The Arctic and boreal region is a perfect laboratory to study climate change.”

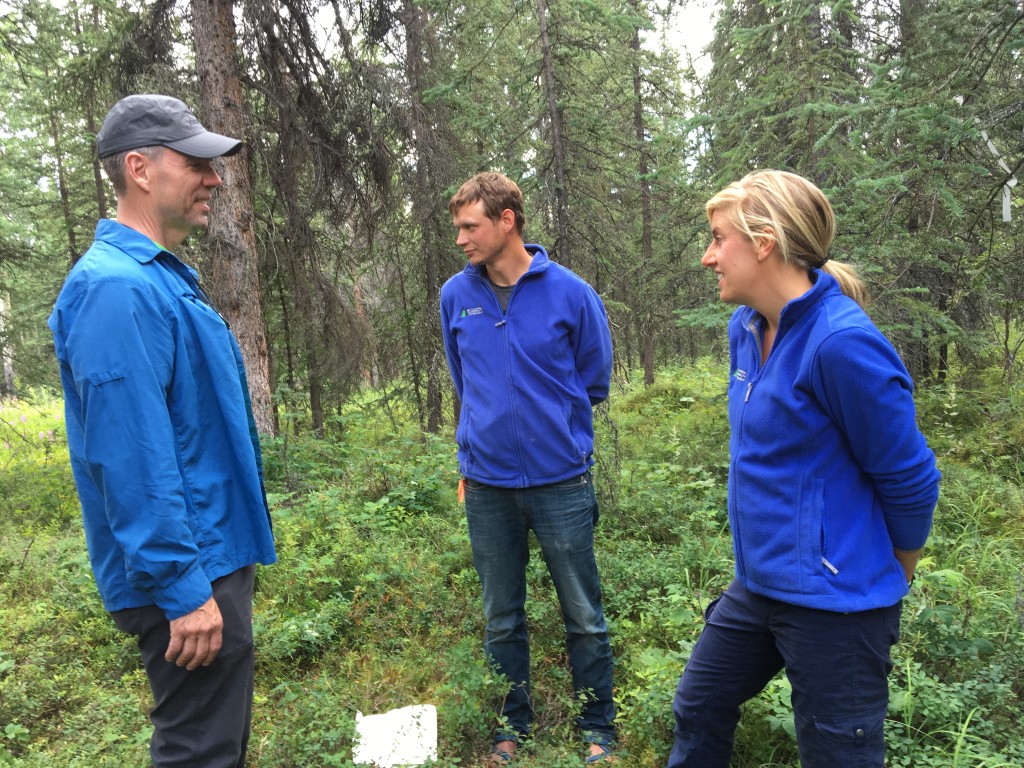
Peter Griffith, Brian Howard and Xanthe Walker discuss field work in Denali National Park to study whether ’legacy carbon’ – carbon that has been stored in the soil for centuries – is being released into the atmosphere in recent, severe fires. Credit: Ramsayer/NASA
Peter Griffith, Brian Howard and Xanthe Walker discuss field work in Denali National Park. Credit: Kate Ramsayer/NASA

It’s not necessarily an easy laboratory to work in, though. Walker’s field site isn’t a flat, squishy moss terrain—there are knee-high mounds of tussock grass, sticking up over mucky burned soils. It was rainy a week or so ago when the group went to sample sites, and there is a rainy forecast for the week ahead.

“I love it, even in the rain,” Walker said. “You’re back in the field, actually seeing what you’re studying instead of seeing numbers on a computer screen.”

The computer screen will come in the fall, when she analyzes the measurements gathered this summer not just in Denali, but at similar sites farther north in Alaska as well as Canada’s Northwest Territories. Walker and the project’s principal investigator, Michelle Mack, are asking the question: As the climate gets warmer, and summers get hotter and drier, are fires in the tundra becoming more severe and releasing carbon long stored in the ground?

The tussock tundra soils in her Denali sites are basically layers of moss—live moss, on top of slightly decayed moss, on top of more decayed moss. This moss in varying stages of decay can be a foot deep in places. While fires decades ago might have just burned the top layers of moss, leaving the lower, often-frozen layers intact, Walker is testing whether more recent fires go deeper.

An unburned cross section of tundra soil shows the rich organic layers beneath the surface. Scientists are studying how a much carbon would be released by a severe fire. Credit: Walker/NAU
An unburned cross section of tundra soil shows the rich organic layers beneath the surface. Scientists are studying how much carbon would be released by a severe fire. Credit: Xanthe Walker/Northern Arizona University

“That’s an indication that the fires are releasing much more carbon into the atmosphere than they used to,” Walker said. To find out, she’s taking soil samples, wrapping them up in tin foil, packing them in one of the six coolers that will be full by the end of the week, and driving them back to the lab for radiocarbon dating.

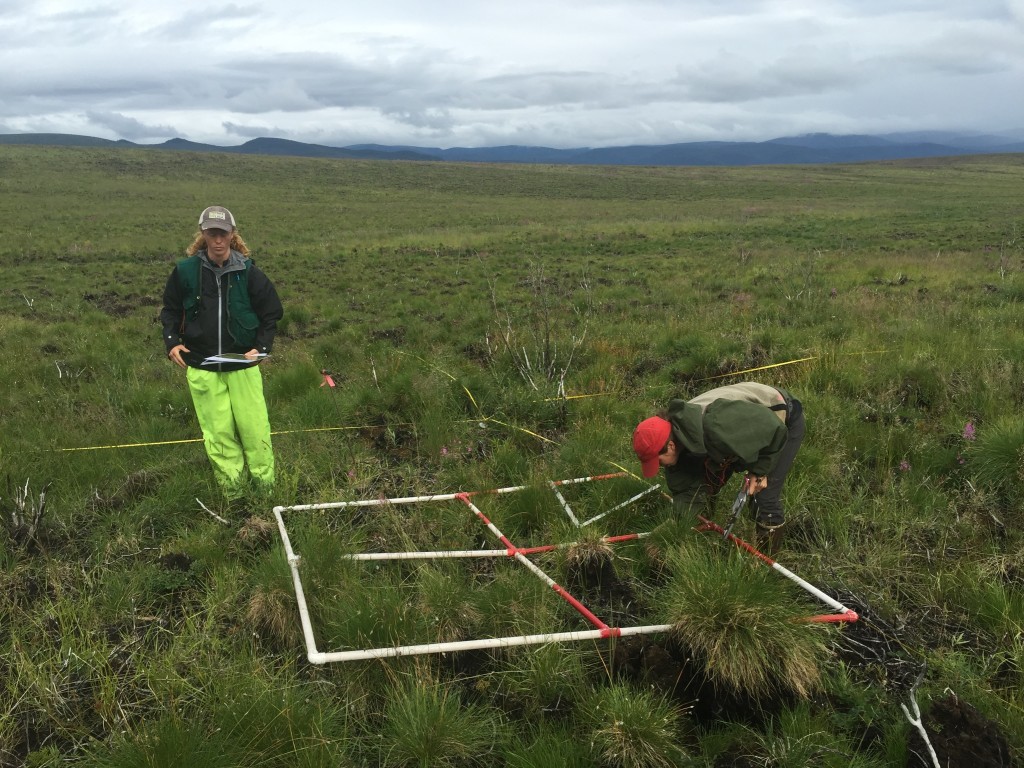
Howard is also studying not just the soils, but also what’s growing back after a fire, from mosses and lichens to trees. In the early 2000s, the National Park Service did a survey of the 50 sites the team is studying, so they have records of what the site was like before the 2013 fire to compare with this summer’s data.

“What’s interesting about these plants is they weren’t the plants that were there before a fire came through,” Howard said. Burning up more soil, and a warming temperature, could mean different grass, shrub or tree species popping up in the Arctic tundra. That’s what he’s trying to find out.

In addition to looking at the soils, researchers in Denali are studying what plants grow back after a severe fire in the tundra – and whether those plants are different from what was there before. Credit: Walker/NAU
In addition to looking at the soils, researchers in Denali are studying what plants grow back after a severe fire in the tundra—and whether those plants are different from what was there before. Credit: Xanthe Walker/Northern Arizona University